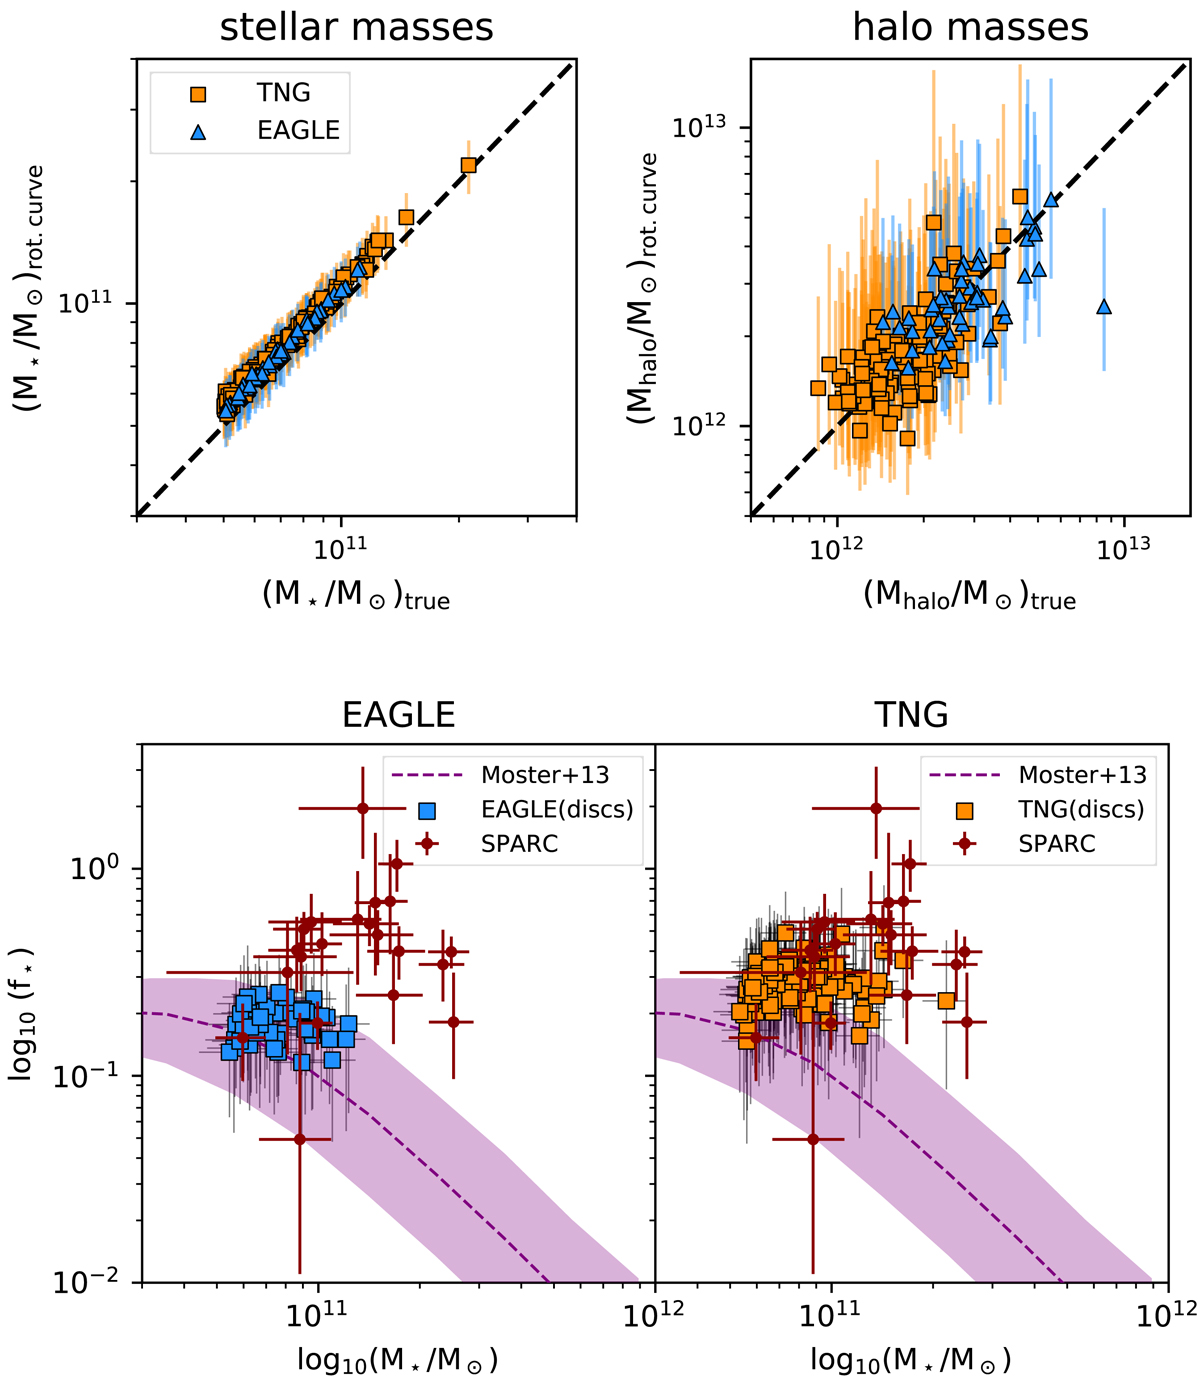
Fig. B.1.

Top left panel: comparison between the “true” stellar masses of the simulated disc galaxies (x-axis) and those derived via the decomposition of their synthetic rotation curve (y-axis). EAGLE (IllustrisTNG) galaxies are shown as blue triangles (orange squares). Error bars are given from the difference between the 84th and 16th percentiles in the posterior probability distributions. The dashed line shows the one-to-one relation. Top right panel: same, but for the halo masses. Bottom panels: plot of f⋆ − M⋆ for the simulated discs using stellar and halo masses from rotation curve decomposition. Colours and symbols are shown as in Fig. 2.
Current usage metrics show cumulative count of Article Views (full-text article views including HTML views, PDF and ePub downloads, according to the available data) and Abstracts Views on Vision4Press platform.
Data correspond to usage on the plateform after 2015. The current usage metrics is available 48-96 hours after online publication and is updated daily on week days.
Initial download of the metrics may take a while.


