Fig. A.1.
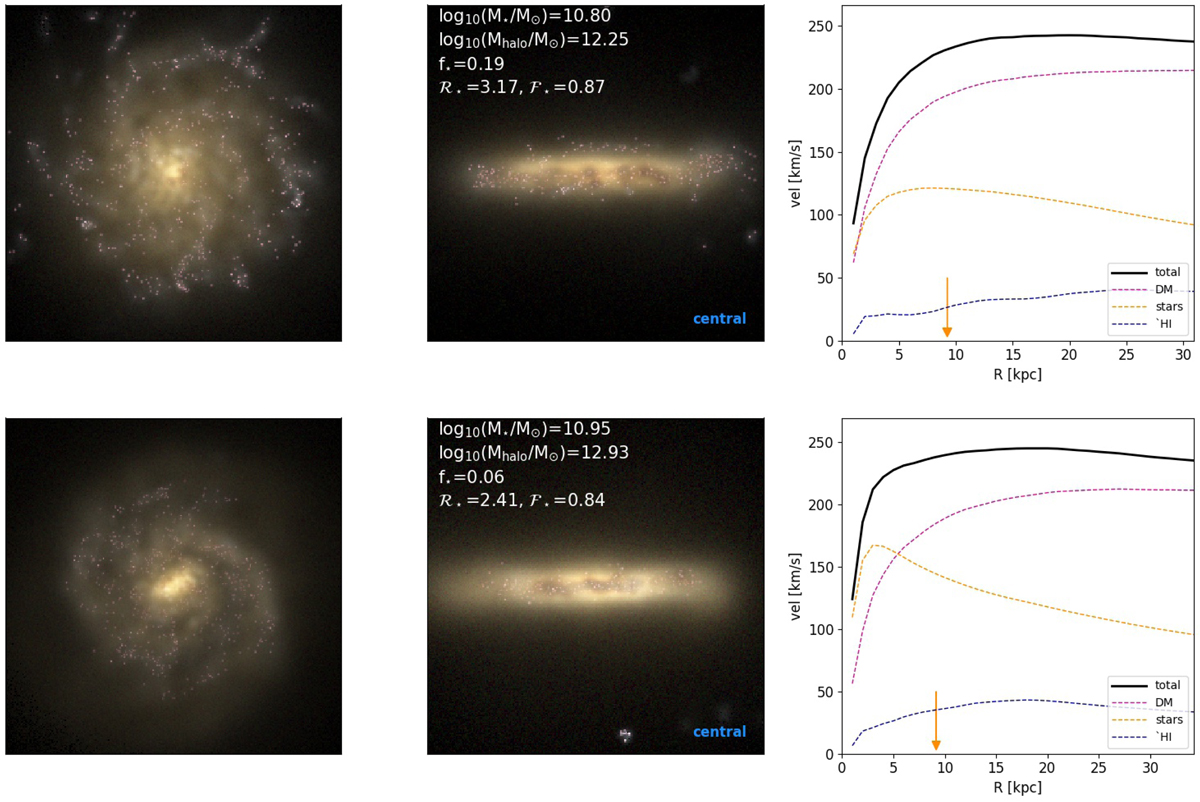
Two examples of massive (central) disc galaxies from the EAGLE simulations (run Ref-L0100N1504). The left and central panels show the systems from a face- and edge-on perspective. The right panels show the total circular velocity profiles (solid black lines), along with the separate contributions (dashed lines) from stars (orange), gas (blue), and dark matter (magenta). The vertical arrow shows the half-M⋆ radius.
Current usage metrics show cumulative count of Article Views (full-text article views including HTML views, PDF and ePub downloads, according to the available data) and Abstracts Views on Vision4Press platform.
Data correspond to usage on the plateform after 2015. The current usage metrics is available 48-96 hours after online publication and is updated daily on week days.
Initial download of the metrics may take a while.