Fig. 1.
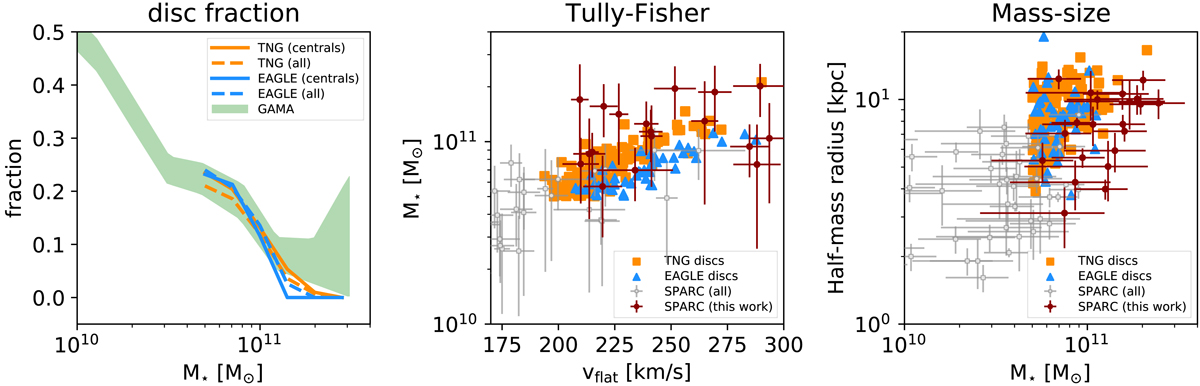
Left panel: fraction of disc galaxies as a function of their stellar mass in EAGLE (blue lines) and IllustrisTNG (orange lines), compared to that measured in the GAMA survey by Moffett et al. (2016, shaded green area). Solid lines only show central discs; dashed lines include satellites. Central panel: stellar TFR for our sub-sample of simulated (central) discs with M⋆ > 5 × 10¹⁰ M⊙ in EAGLE (blue triangles) and IllustrisTNG (orange squares) compared with the population of nearby spirals from the SPARC dataset (circles with error bars). Galaxies from SPARC are shown as circles with error bars. Filled red circles show the sub-sample of massive discs studied in this work. Right panel: stellar mass-size relation for the same systems.
Current usage metrics show cumulative count of Article Views (full-text article views including HTML views, PDF and ePub downloads, according to the available data) and Abstracts Views on Vision4Press platform.
Data correspond to usage on the plateform after 2015. The current usage metrics is available 48-96 hours after online publication and is updated daily on week days.
Initial download of the metrics may take a while.