| Issue |
A&A
Volume 640, August 2020
|
|
|---|---|---|
| Article Number | A51 | |
| Number of page(s) | 20 | |
| Section | Interstellar and circumstellar matter | |
| DOI | https://doi.org/10.1051/0004-6361/202038251 | |
| Published online | 10 August 2020 | |
Carbon isotopic fractionation in molecular clouds
1
Università degli studi di Firenze, Dipartimento di fisica e Astronomia,
Via Sansone 1,
50019
Sesto Fiorentino, Italy
e-mail: This email address is being protected from spambots. You need JavaScript enabled to view it.
, This email address is being protected from spambots. You need JavaScript enabled to view it.
2
INAF – Osservatorio Astrofisico di Arcetri,
Largo E. Fermi 5,
50125
Florence, Italy
3
Max-Planck-Institüt für extraterrestrische Physik,
Giessenbachstrasse 1,
85748
Garching bei München, Germany
4
Sorbonne Université, Observatoire de Paris, Université PSL, CNRS, LERMA,
92190
Meudon, France
Received:
24
April
2020
Accepted:
4
June
2020
Abstract
Context. Carbon fractionation has been studied from a theoretical point of view with different models of time-dependent chemistry, including both isotope-selective photodissociation and low-temperature isotopic exchange reactions.
Aims. Recent chemical models predict that isotopic exchange reactions may lead to a depletion of 13C in nitrile-bearing species, with 12C/13C ratios two times higher than the elemental abundance ratio of 68 in the local interstellar medium. Since the carbon isotopic ratio is commonly used to evaluate the 14N/15N ratios with the double-isotope method, it is important to study carbon fractionation in detail to avoid incorrect assumptions.
Methods. In this work, we implemented a gas-grain chemical model with new isotopic exchange reactions and investigated their introduction in the context of dense and cold molecular gas. In particular, we investigated the 12C/13C ratios of HNC, HCN, and CN using a grid of models, with temperatures and densities ranging from 10 to 50 K and 2 × 10³ to 2 × 107 cm−3, respectively.
Results. We suggest a possible 13C exchange through the 13C + C3 → 12C +13CC2 reaction, which does not result in dilution, but rather in 13C enhancement, for molecules that are formed starting from atomic carbon. This effect is efficient in a range of time between the formation of CO and its freeze-out on grains. Furthermore, the parameter-space exploration shows, on average, that the 12C/13C ratios of nitriles are predicted to be a factor 0.8–1.9 different from the local 12C/13C of 68 for high-mass star-forming regions. This result also affects the 14N/15N ratio: a value of 330 obtained with the double-isotope method is predicted to vary in the range 260–630, up to 1150, depending on the physical conditions. Finally, we studied the 12C/13C ratios of nitriles by varying the cosmic-ray ionisation rate, ζ: the 12C/13C ratios increase with ζ because of secondary photons and cosmic-ray reactions.
Key words: astrochemistry / methods: numerical / ISM: molecules / molecular processes
© ESO 2020
1 Introduction
Isotopic fractionation is an important chemical process that occurs in interstellar clouds. It is the set of processes that distribute the less abundant stable isotopes of an element into other molecular species. Understanding isotopic abundances over a large range of scales, from terrestrial oceans, meteorites, planetary, and cometary atmospheres up to Galactic and extragalactic environments is crucial. In particular, the variation in isotopic ratios may give important information about the link between Solar System objects and Galactic interstellar environments (e.g. Caselli & Ceccarelli 2012; Hily-Blant et al. 2013a,b; Ceccarelli et al. 2014; Fontani et al. 2015, 2020; Colzi et al. 2018a,b, 2019).
One element for which fractionation is important is carbon. C-fractionation in dense interstellar clouds has been studied with different models of time-dependent chemistry. Langer et al. (1984) introduced different isotopic exchange reactions in their model, as proposed by Watson et al. (1976). In particular, they proposed that C-fractionation in interstellar species is a result of the isotopic exchange reaction:
 (1)
(1)
They concluded that the lower the temperature, the higher the chemical fractionation of C-bearing species. In fact, this reaction leads to a 13C enhancement in CO and to a dilution in species formed from C+ when all of the carbon is not fully locked in CO. Smith & Adams (1980), under the suggestion of Langer et al. (1978), measured the rate coefficient for another isotopic exchange reaction:
 (2)
(2)
with ΔE = 12 ± 4. However, more recently, this reaction was revised theoretically by Mladenović & Roueff (2014) who derived a value of 17.4 K from detailed zero-point energy (ZPE) calculations. This value is very similar to the one estimated by Hennig et al. (1977) of 17 ± 1 K. All of these reactions are very important in a low temperature (~20 K) environment.
In more recent works, fractionation effects due to the photodissociation of CO by ultraviolet (UV) photons, based on the theoretical studies by van Dishoeck & Black (1988), has been taken into account in chemical models. In particular, the selective photodissociation of 12CO is expected to be dominant in low-density (<102 cm−3) environments, or denser regions with a strong radiation field. Röllig & Ossenkopf (2013) found, with their photodissociation region (PDR) model, that 12CO/13CO is always equal to the 12C/13C elemental ratio (~68). However, Visser et al. (2009) were able, with their PDR model, to reproduce both higher and lower values with respect to the elemental ratio, as a function of H2 column density. In fact, Visser et al. (2009) introduced Alfvén waves in their code, which have the effect of replacing the kinetic temperatures (Tkin) in the rate equation of ion-neutral reactions by an effective temperature that takes into account these non-thermal effects. They demonstrated that these effects can take place and modify the 12CO/13CO ratio.
Observationally, numerous studies of the 12C/13C ratio have been conducted towards molecular clouds in the Galaxy, but most of them through observations of CO, H2 CO, and HCO+, which, as stated before, have the possible effects of isotopic-selective photodissociation and/or chemical fractionation (e.g. Wilson & Rood 1994; Langer & Penzias 1990, 1993). To estimate the 12C/13C elemental ratio across the Galaxy, Milam et al. (2005) observed 12CN and 13CN towards Galactic molecular clouds. They found:
 (3)
(3)
Moreover, they also derived a galactocentric trend taking into account all together CN, CO, and H2 CO observations:
![Mathematical equation: \begin{align*} [^{12}\textrm{C}/^{13}\textrm{C}]_{\textrm{all\;molecules}}=&\,(6.21\pm1.00) \textrm{ kpc}^{-1}\times{D}_{\textrm{GC}} \nonumber\\ &+(18.71\pm10.88),\end{align*}](/articles/aa/full_html/2020/08/aa38251-20/aa38251-20-eq4.png) (4)
(4)
and then the average local present-day 12C/13C is 68 ± 15 (at a Sun distance DGC = 7.9 kpc, as derived by Hunt et al. 2016 and Boehle et al. 2016). In particular, the elemental 12C/13C ratio as a function of the galactocentric distance is determined by stellar nucleosynthesis processes. Romano et al. (2017) have shown that the observed trends are in agreement with Galactic chemical evolution models that include primary formation (i.e. starting from the primordial H and He nuclei) of 12C in all stars and of 13C in intermediate-mass asymptotic giant branch stars.
More recently, Yan et al. (2019) presented H2CO and H CO observations towards a sample of 112 sources from which they evaluated a new 12C/13C trend as a function of DGC. They obtained the following linear fit:
 (5)
(5)
which is consistent within the error bars with that found by Milam et al. (2005) (both Eqs. (3) and (4)). This indicates that even if H2CO can be affected by chemical fractionation processes, either as a consequence of reactions (1) and (2) or of isotope-selective photodissociation effects (e.g. Visser et al. 2009), the trend with the galactocentric distance can still be disentangledfrom these effects.
Daniel et al. (2013) performed a non-local thermal-equi- librium analysis of HCN, HNC, CN, and their 13C-isotopologues towards the pre-stellar core B1b. They found HNC/HN13C = 20 , HCN/H13CN = 30
 , and CN/13CN = 50
 . Magalhães et al. (2018) obtained, towards the starless core L1498, a HCN/H13CN ratio of 45 ± 3. These works show that nitrile-bearing species are enriched in 13C with respect to the local ISM value (12C/13C = 68).
Knowledge of the exact value of the 12C/13C ratio is also important for deriving the 14 N/15N ratio for nitrile-bearing species since most studies use the so-called double isotope method (e.g. Wampfler et al. 2014; Zeng et al. 2017; Colzi et al. 2018a,b). This is based on observations of optically thin species, with 13C substituted for 12C (e.g. H13CN, HN13C). However, this method works only if the assumed 12C/13C ratio is comparable, within the errors, with the value given by the galactocentric trend, or if it can be determined independently from observations or chemical models. In fact,13C chemical fractionation may affect the abundances, and also the 14 N/15N ratio, of nitrile-bearing species. This behaviour is typically not taken into account in chemical models inclusive of 15 N-bearing species. Moreover, the observed 12C/13C abundance ratios listed above are not consistent with the values predicted by chemical models for species like CN, HCN, and HNC. As shown by Roueff et al. (2015), the dilution of 13C for nitriles and isonitriles is at most a factor of 2 if derived from pure gas-phase chemical models with a fixed kinetic temperature of 10 K. However, these models do not include gas-grain interactions and introduce depletion effects by simply varying the elemental abundances of carbon, oxygen and nitrogen. It is thus important to test and refine the predictions of these models by introducing time dependent depletion effects resulting from gas-grain interactions. Roueff et al. (2015) also studied C-fractionation for C, CH, CO, and HCO+, showing that the 12C/13C ratio is highly time-dependent. In fact, since the start of the simulation, 13C+ forms 13CO through reaction (1). For a similar reason, CN is enriched in 13C with similar timescales compared to 13C-enrichment in CO, due to the reaction:
 (6)
(6)
Reaction (2) becomes significant once 13C+ starts to deplete from the gas phase. HCO+ is then enriched in 13C as long as the 13CO remains in excess with respect to 12CO (i.e. until CO/13CO comes back to the initial value of 68). The gas-phase chemical model of Roueff et al. (2015) reached a steady state at about 107 yr for a density of 2 × 104 cm−3. At this time C, CH, HCN, HNC, and CN are depleted in 13C. This is related to reactions (1) and (2) that continue to be important and retain all the 13C in CO and HCO+.
In this work, we report a new detailed analysis of the 12C/13C ratio derived under different fixed physical conditions, and with the introduction of new low-temperature isotopic exchange reactions. We first describe the gas-grain chemical model and the network used (Sect. 2). Then, we present the fiducial model that we have chosen to describe the main characteristics and new results about C-fractionation of this chemical model (Sect. 3.1). Finally, we present and discuss a parameter-space exploration for CN, HCN, and HNC. We show how the C-fractionation in some specific models varies with the density, the temperature and the cosmic-ray ionisation rate. We also describe the link with the 14 N/15N derived towards high-mass star-forming regions with the double-isotope method (Sect. 3.2).
2 Model
2.1 Chemical model
Our chemical code is based on the one described in Sipilä et al. (2015a), recently updated to include several new chemical processes (Sipilä et al. 2019b). In short, the code solves rate equations for gas-phase and grain-surface chemistry, which are connected through adsorption and (non-)thermal desorption. A description of the basic processes including relevant equations can be found in Sipilä et al. (2015a) and are not reproduced here for the sake of brevity.
2.2 Introduction of 13C-fractionation in the chemical model
In this paper, we model the isotopic fractionation of carbon by introducing the isotope 13 C to the KIDA gas-phase network (Wakelam et al. 2015) using a procedure similar to our earlier approach to generating deuterated networks (Sipilä et al. 2013; Sipilä et al. 2015b).
As an example of the fractionation-generation procedure, we consider the reaction
 (7)
(7)
Here, the 13C atom can beintroduced in CCN in two positions that are considered equivalent. From a chemical standpoint, the position of the 13C atom is important and may impact the reactivity of the molecule, but here we make the simplifying assumption that the order of carbon atoms does not need to be tracked. We note, however, that significant differences in abundances have been observed for molecules where the 13C atom can belocated in different positions. For example, Sakai et al. (2010) observed the N = 1–0 lines of CCH and its 13C-isotopic species towards the dark cloud TMC-1 and the star-forming region L1527. They investigated the 13C-species abundances and the possible different formation pathways. They found a C13CH/13CCH ratio of 1.6 ± 0.4 and 1.6 ± 0.1 towards TMC-1 and L1527, respectively. They proposed that the reaction
 (8)
(8)
could make a difference between the formation of the two 13C-isotopic species of C2H. Taniguchi et al. (2019) found similar results towards L1521B and L134N. However, testing this result is beyond the scope of this work.
According to our present approach, the following branches will be generated once 13C is substituted in reaction (7):
where the branching ratio is displayed above the arrow. Essentially, we calculate the probability of a given branch based on the positions that the 13C atom can occupy on the product side of the reaction. The same rule is applied to most reactions, meaning the inherent assumption is that the reactions proceed via full scrambling, which is not universally true (Sipilä et al. 2019a). Notable exceptions to the full-scrambling rule are charge-exchange reactions and proton-donation reactions that involve at least one carbon atom in each reactant and product. For these reactions, we assume that carbon atoms cannot be interchanged in the reaction. Mass and/or energy corrections to the rate coefficients of the reactions due to isotopic effects are expected to be small, below the expected accuracy of the reaction rate coefficients, except for possible isotopic exchange reactions, as discussed in Sect. 2.3. The same fractionation procedure isapplied to our grain-surface network (Sipilä et al. 2019b).
We do not consider fractionation for all carbon-containing reactions included in KIDA, or in our surface network, in order to maintain relative simplicity while still including the chemistry that is essential for the molecules typically observed and used to derive fractionation ratios. First, we discarded all reactions that contain molecules with more than five atoms. So, for example, cyanoacetylene (HC3N) is included in our models, while methanol (CH3OH) is not. In Sect. 3, we discuss the results on diatomic and triatomic molecules, which should not be affected too much by this restriction. Second, we only performed the fractionation procedure for reactions that containmolecules with up to three carbon atoms, and so our final networks do not contain species like  . With these restrictions, our final networks (gas-phase and grain-surface) contain a combined total of ~11 500 reactions. Appendix A.1 describes the possible issues in the building of the isotopic chemistry and compares the present method to that used in Roueff et al. (2015).
2.3 Isotopic exchange reactions
In this work, we examine the behaviour of C-fractionation in a low-temperature environment (Tgas ≤ 50 K). Isotopic exchange reactions are very important in these cold regions and could affect the behaviour of the 12C/13C ratio in different molecules. Roueff et al. (2015) studied the 12C/13C ratio of some molecules, introducing some isotopic exchange reactions. For this work, we updated the list of exchange reactions, as shown in Table 1. These reactions can occur in the absence of potential barriers and when no other exothermic product channel is available.
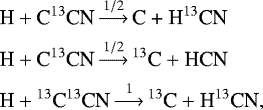
We now discuss the new suggested reactions shown in the bottom panel of Table 1. To quantify the efficiency of these possible exchange reactions, we computed the variation of the involved ZPE, and we assumed that the reactions take place via an intermediate complex.
Since no experimental data is available, we assumed a pre-exponential factor. For ion-neutral reactions, we could use the rate given by theLangevin formula:
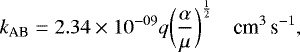 (9)
(9)
where μ is the reduced mass of the reactants in atomic mass units (amu), q is the electronic charge, and α is the polarisability of the neutral species in cubic angstroms. However, since this expression represents an upper limit for the reaction probability, we decided to guess the rate coefficients, setting them to a similar order of magnitude with previously known reaction. Reactions involving the C+ ion and a diatomic molecule (6,7, and 9 of Table 1) are assumed to proceed at the Langevin rate. However, the C+ + C3 reaction could lead to different products, depending on the carbon position. For this, we assumed a rate of 9.5 × 10⁻¹⁰ cm3 s−1, about half of the Langevin rate (1.7 × 10⁻⁹ cm3 s−1). We made this assumption since in this work we consider only one position (13C12C2). Exchange reactions may occur in neutral-neutral reactions. In the absence of more detailed theoretical investigations, for reactions (8) and (10) we assumed the same pre-exponential factor as for reaction (5) in Table 1. Moreover, for the new reactions studied in this work, the factor f is near unity unless C2 (or C3) appears, in which case it is ~2.0 if the symmetric molecule C2 (or C3) is a reactant, and ~0.5 if C2 is a product, according to the symmetry factor term present in the partition function.
The exponential term exp(−ΔE∕T), which is both present in the forward reaction rate coefficients (except for reaction (2)) and in the reverse (endothermic) ones, requires the knowledge of the energy defect (ΔZPE), which is obtained from the difference of the zero-point energies of the products and the reactants. In Table 2, we report the difference in zero-point energies between the more and less abundant isotopologues found in the literature for C2, CS, and C3. The energies involved depend on the position of 13C, as indicated in Table 2. As we did not track the position of 13C, we take the lowest value involved for the energy defect, making it possible to evaluate the importance of this mechanism at its minimum level. 13C-fractionation in C3 could proceed further through reaction of 13C with 13CC2 and other 13C substituents. We carried out some tests that showed that the effect of multiple 13C-fractionation on our results is negligible. We leave the full study for future considerations.
3 Results and discussion
In this section, we discuss the main results obtained with the simulation at different densities and temperatures. The main physical parameters that the chemical code requires are the total number density of H nuclei (nH 1), the dust temperature (Tdust), the gas temperature (Tgas), the cosmic-ray ionisation rate (ζ), the visual extinction (AV), the grain albedo (ω), the grain radius (ag), and the grain material density (ρg). The ratio between the diffuse and the binding energy of a species on dust grains (ɛ), and the dust-to-gas mass ratio (Rg). Apart from densities and temperatures, we fixed all of the other initial parameters as described in Table 3, except in Sect. 3.2.3 where we performed an analysis varying the cosmic-ray ionisation rate.
We assumed that the gas is initially atomic except for hydrogen, which is in molecular form. The adopted initial abundances are presented in Table 4 and are used for all of the models presented in this work, assuming an initial 12C/13C ratio of 68.
Carbon isotopic exchange reactions used in this work.
Values of the ZPEs for molecules related to the isotopic exchange reactions used in our model.
Values of the physical parameters fixed in each model.
3.1 The fiducial model
First of all,we analysed the behaviour of the abundances and 12C/13C ratios of different species for a particular model with a fixed temperature and density. We chose the one with Tgas = 10 K and nH = 2 × 104 cm−3 as our fiducial model. We note that we always assume that the gas and dust are thermally coupled, so that Tgas = Tdust.
 |
Fig. 1 Time evolution of C+, C, CO, CH, and HCO+ (left panel) and of CN, HCN, and HNC (right panel) abundances with respect to H2 for the fiducial model with only gas-phase chemistry at work (solid lines) and with both gas-phase and grain-surface chemistry at work (dashed lines). |
Initial abundances with respect to nH.
3.1.1 Gas-phase model
Figure 1 shows the time-dependence of C+, C, CO, CH, HCO+, CN, HCN, and HNC abundances, for a model with only gas-phase chemistry at work (solid lines). Here, we simulated the formation of H2 in the grain-surface H + H association by constructing a dummy gas-phase reaction. The rate coefficient for this reaction, derived from the grain physical parameters reported in Table 3, is 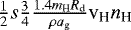 , where s is the hydrogen sticking coefficient, mH is the mass of the hydrogen atom, and vH is the thermal speed of hydrogen (Le Petit et al. 2002). As in model (a) in Roueff et al. (2015), which corresponds to the same temperature, density and cosmic-ray ionisation rate, the steady-state is reached at a few million years. At the beginning, all the carbon is in ionised form, and after 102 yr it is converted into atomic carbon, which is later transformed into CO (in a timescale of ~105 yr). Meanwhile, CH follows the behaviour of atomic carbon, and HCO+ that of CO, as expected. In Fig. 2, the related 12C/13C ratios are shown with solid lines. As already explained in Sect. 1, the 12C/13C ratios of these molecules are mainly governed by the isotopic exchange reactions (1), (2), and (3) shown in Table 1. However, this model already shows differences between the results of Roueff et al. (2015) and this work. In fact, there is a range of time in which the 12C/13C ratios for nitrile-bearing species tend to be similar and lower than 68. These values for HCN and HNC were different and always higher than 68 in previous chemical models that simulated similar physical conditions (e.g. Roueff et al. 2015). As we discuss in Sect. 3.1.3, this behaviour is due to the introduction of the carbon isotopic exchange reaction of C3.
3.1.2 Gas-grain model
The time-dependence of C+, C, CO, CH, HCO+, CN, HCN, and HNC abundances, for the complete model, with both gas-phase and grain-surface reactions, is shown in Fig. 1 with dashed lines. In addition to what happens with a gas-phase-only model, after 2 × 10⁵ yr, CO starts to freeze out on grain surfaces, and the abundance in the gas phase drops. Moreover, when most of the CO is depleted, the abundance of He+, which is produced at a constant rate by cosmic-ray-induced ionisation, increases as CO is one of its main destruction partner. He+ continues to react with the remaining CO in the gas phase, increasing the abundance of C+. Moreover, as depletion occurs, C+ mainly reacts with H2 rather than with O-bearing species. This increases the CH abundance, and as a consequence, the abundance of related molecules such as C2, C3, CN, HCN, and HNC increases as well (Fig. 1 and left panel of Fig. 3). This behaviour was already predicted by Ruffle et al. (1997), and carbon chains such as HC3N can be used as depletion indicators in late-type chemistry (after CO freeze-out).
Dashed lines in Fig. 2 display the time dependence of the 12C/13C ratios of the same molecules discussed above for the gas-phase model. For t < 105 yr, the inclusion of gas-grain interactions does not affect the isotopic ratio of C-bearing molecules. In fact, adsorption rates depend on vi, the thermal speed of species i, which is inversely proportional to its mass. Since typical differences in mass between 12C-containing species and 13C-containing species are less than a few percent, they do not have a significant effect. CO shows a 13C-enhancement until the last million years of the time interval covered by the simulation. The 12C/13C ratios of C, CH, CN, HCN, and HNC peak at around 106 yr. The peak appears because of the interaction between gas and grains. In fact, during the fast early time chemistry most of the atomic carbon is transformed into CO. During this period, most of the 13C is in principally in CO and, to a less extent, in HCO+, and is unavailable for other species. Then, after 106 yr, the 12C/13C ratios of the molecules listed above tend to decrease again because of the CO freeze-out that again drives atomic C to be the main reservoir of gas-phase carbon. Moreover, before 106 yr, there is a short interval of time where the 12C/13C ratios of C, CH, CN, HCN, and HNC tend to decrease, down to values lower than 68 (only for CH, CN and HCN), and after that timescale the ratios tend to increase again. We discuss below why this feature in the time dependence of 12C/13C ratio is present, and its consequences at different densities and temperatures.
In Appendix A.2, we compare the results obtained with our gas-grain chemistry with the ones obtained by Furuya et al. (2011). The results of the two chemical models are in agreement, and the differences are mainly due to the new low-temperature isotopic exchange reactions introduced in this work.
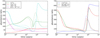 |
Fig. 2 Time evolution of the 12C/13C ratio for C, CO, CH, and HCO+ (left panel), and for CN, HCN, and HNC (right panel) for the fiducial model with only gas-phase chemistry at work (solid lines) and with both gas-phase and grain-surface chemistry at work (dashed lines). In both panels, the black horizontal dashed line represents the initial 12C/13C ratio of 68. |
3.1.3 The importance of the possible C3 isotopic exchange reaction
Observations of atomic carbon, and simple molecules containing more than one carbon atom, are important to put constraints on the processes that form larger molecules. The linear molecule C3 is one of these species. It was observed for the first time in the ISM by Haffner & Meyer (1995), who reported a tentative detection, and then clearly by Maier et al. (2001). Later, Roueff et al. (2002) studied this molecule towards the diffuse molecular cloud HD 210121 where it forms mainly from the recombination of C3 H+ and is destroyed by photodissociation. They found an abundance relative to H2 of 6.75 × 10⁻⁹. Other detections were made later towards stars surrounded by molecular clouds and in translucent sight lines (Galazutdinov et al. 2002; Ádámkovics et al. 2003; Oka et al. 2003). Moreover, Wakelam et al. (2009) pointed out the possible occurrence of radiative association of C3 and C to form C4 and the formation channel of CO through C4 + O. They also pointed out that the reaction C + C5 can be important for producing more C3 and CO. Finally, Mookerjea et al. (2012) and Mookerjea et al. (2014) observed and modelled the abundance of C3 towards envelopes of high-mass star-forming regions. Mookerjea et al. (2012) found an abundance of C3 of (6.3 ± 1.3) × 10−10 in the envelope towards DR1(OH), which they were able to reproduce with a chemical model with  = 5 × 106 cm−3 and a temperature of 30 K. Mookerjea et al. (2014) observed along the line of sight of the UC HII region W51e2, with Herschel, detecting anabsorption feature probably tracing a cold external envelope.
The carbon isotopic exchange reaction involving C3,
 (10)
(10)
was already emphasised in the discussion of the results displayed in Fig. 2. In this section, we investigate the contribution of this species to the 12C/13C ratio of different molecules. For this, we studied in detail the main reactions that form or destroy C3 at two precise times in the fiducial model: 3 × 10⁴ yr and 3 × 10⁵ yr. These two times are earlier and later than the ‘early chemistry time’ (t1), which we define as the time at which the abundance of atomic carbon drops by one order of magnitude while it is transformed into CO. In the fiducial model, t1 = 1.6 × 10⁵ yr, and it is shown in Fig. 3 as the vertical purple line. Figure 3 displays the abundances (left panel) and the 12C/13C ratio (right panel) for CN, C, CO, C2, and C3. We note that the abundance of C3 is two orders of magnitude higher than that of CN until the late-chemistry time, when CO starts to freeze out onto grain surfaces (~2–4 × 10⁵ yr). The main reactions for the two times are summarised in Fig. 4 and are explained below in detail. Moreover, the 12C/13C ratio for some important molecules at the three times (3 × 10⁴ yr, 1.6 × 10⁵ yr, and 3 × 10⁵ yr) are summarised in Table 5.
For t < t1, 13CC2 is enriched in 13C, with respectto C3, thanks to the forward reaction (10). As a consequence, the C3 /13CC2 ratio is lower than the elemental initial value of 68, and the atomic 12C/13C is higher than 68. Even though reaction (6) has a similar exothermicity, reaction (10) is more efficient since C3 /H2 > CN/H2. This means that the C3 /13CC2 ratio is lower than the CN/13CN ratio, and it stays low for a longer time than that of CN (CN/13CN = 68 at t1). Moreover, most of C2 is formed from atomic 12C through the cycle:
 (11)
(11)
Conversely, C13C is mainly formed from 13CC2 through secondary UV photon reactions2. As a consequence, C2 /13CC ≃ 68 since it reaches an equilibrium between the efficient formation of C2 from the very abundant 12C and the main formation of C13C from 13CC2.
For t > t1, the cycle of reactions (11) is not efficient any more since most of the atomic carbon has been transformed into CO. Thus, C2 is mainly formed from C3 reacting with secondary photons. C2 then reacts with the remaining O, releasing atomic carbon. At this time, the cycle of reactions described above is the same for 12C and 13C-containing species (red reactions in the right panel of Fig. 4). Since at this timescale the isotopic exchange reaction of C3 is not efficient any more, the atomic 12C/13C ratio approaches the low values of C3. As a consequence, the 12C/13C ratio of carbon-chain and nitrile-bearing species, which are produced starting from atomic carbon, is low as well. This behaviour remains until the abundance of C3 drops (when CO starts to freeze out on dust grains) and the 12C/13C ratios of the other molecular species rise again. When this happens, the main sink of 13C is CO and, to a small extent, HCO+, and 13C is diluted in all the other molecular species.
We would like to point out that in our chemical network, we did not introduce 13C in reactions containing C4, as explained in Sect. 2.2, and some biases on C-fractionation of C3 could arise because of this assumption. However, we found that the C4 + O reaction is not efficient for the formation of C3 in our chemical network. Moreover, the radiative association of C3 and C giving C4 and the C4 + C reaction forming C3 back, are much less efficient than the isotopic exchange reactions involving C3 with our assumed reaction rate coefficients.
Recently, Giesen et al. (2020) reported the first detection of the 13C-isotopologues of C3, 13CCC and C13CC, towards the massive star-forming region SgrB2(M), near the Galactic Centre. They derived an average 12C/13C abundance ratio of 20.5 ± 4.2, in agreement with the value of 20 as derived from the galactocentric trend by Milam et al. (2005) for CN, CO, and H2 CO, taking into account the three molecules (Eq. (4)). Thus, it seems that no 13C-fractionation for C3 is detected in SgrB2, contrary to our fiducial model predictions. However, this chemical model is not appropriate to model the physical conditions and the chemistry towards this source. Furthermore, other observational studies towards the Galactic Centre are needed to improve the reliability of the 12C/13C estimated from the galactocentric trend. Finally, the authors found a N(13CCC)/N(C13CC) ratio of 1.2 ± 0.1, different from the statistically expected value3 (2). This discrepancy could be explained by a difference of 16 K in zero-point energy between the two species with respect to the main species C3, as shown in Table 2. The different position of the 13C in carbon chains would probably lead to a higher abundance of C13CC with respect to 13CCC for 27 K < T < 43 K because of the reaction C3 + 13C → C13CC + C + 43 K. Another difference is that the symmetry factor f for the reaction C3 + 13C → C13CC + C is 1, while it is 2 for the reaction C3 + 13C → 13CCC + C. We plan to upgrade our chemical network to track the position of 13C in molecules and hence to study the possible roles of the different ZPEs.
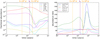 |
Fig. 3 Left panel: time evolution of CN, C, CO, C2, C3, and He+ abundances with respect to H2 for the fiducial model. Right panel: time evolution of the 12C/13C for CN, C, CO, C2, and C3 for the fiducial model. The black horizontal dashed line represents the initial 12C/13C ratio of 68. In both panels, the vertical purple solid line represents the ’early chemistry time’ as defined in the text, while the two vertical orange solid lines represent the two times (3 × 10⁴ yr, and 3 × 10⁵ yr) that we have analysed and discussed in the text. |
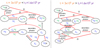 |
Fig. 4 Chemical pathways that distribute the two carbon isotopes in atomic carbon, C2 and C3 at 3 × 10⁴ yr (left panel) and 3 × 10⁵ yr (right panel), for the fiducial model. Main creation and destruction reactions are highlighted in red, 12C is represented in blue and 13C is represented in green. |
12C/13C ratios for different molecules (C3, C2, C, CO, CN, HCN, and HNC) for three different times in the fiducial model: the early chemistry time (second row), t1, as defined in the text, and the times before and after t1 that we have discussed in the text (first and third rows, respectively).
3.2 Parameter-space exploration
In this section, we focus the analysis on the nitrile-bearing species CN, HCN, and HNC in order to evaluate how reliable the estimates of the 14 N/15N ratio based on 12C/13C = 68 (Colzi et al. 2018a,b) are.
We analysed the 12C/13C ratio for different temperatures and densities in three well-defined fixed times: the early chemistry time t1, t2 = 2 × t1, and t3 = 10 × t1. The densities we analysed are between 2 × 103 cm−3 and 2 × 107 cm−3, and the temperatures are 10, 20, 30, 40, and 50 K. Figures 5–7 show the behaviour of HN12C/HN13C, H12CN/H13CN, and 12CN/13CN, respectively, as a function of nH and for different temperatures. In particular, it can be noted that for t1 and t2 and for densities higher than 106 cm−3, the 12C/13C ratios tend to be higher for 10 K with respect to higher temperatures. This is because the forward reaction (2) is efficient until T < 17.4 K, together with the low-temperature isotopic exchange reaction for C3. Then, most of the 13C is in CO, HCO+, and in C3.
It should be noted that this trend is also different depending on the density. This is because of the definition of t1 : for a density of 106 cm−3, t1 is the time just before reaching the dip of carbon isotopic ratios that directly follows C3, while for a density of 105 cm−3, t1 is the time when the dip in 12C/13C is present and follows that of C3. The higher the density, the later the dip of lower 12C/13C with respect to t1 when most of the atomic C is in the form of CO. The most probable explanation, also following what was described in Sect. 3.1.3, is that there is a competition between the O atoms transformed into CO and frozen out on grains, and those that are still available to take part in the reactions shown in the right panel of Fig. 4.
Overall, for densities of ~103–104 cm−3, the 12C/13C ratio is almost always higher than the canonical value of 68. Moreover, for a density ≃105 cm−3, the 12C/13C ratio is consistentwith 68 within a factor two, except for HCN and HNC for temperatures below 20 K at t1 and t3.
We also performed the same parameter-space exploration for CO, HCO+, and H2 CO, to also show the predicted 12C/13C ratios for these molecular species (see Appendix B).
3.2.1 Low-mass star-forming regions
As already discussed in the introduction of this chapter, Daniel et al. (2013) found HNC/HN13C = 20 , HCN/H13CN = 30
 , and CN/13CN = 50
 towards B1b, and Magalhães et al. (2018) obtained a HCN/H13CN ratio of 45 ± 3 towards thepre-stellar core L1498. Daniel et al. (2013) derived a hydrogen density of 6 × 106 cm−3 and a temperature of 17 K towards the centre of the pre-stellar core. Furthermore, Magalhães et al. (2018) found, for the centre of the core, an average hydrogen density of 2 × 105 cm−3 and a temperature of 10 K. Thus, we used these physical properties to study the 12C/13C ratios predicted by our chemical model. The comparison is shown in Figs. 5–7.
For CN, we reproduced the values observed by Daniel et al. (2013) at time t3, while for HCN and HNC, the values we found with our model are slightly higher. We note that the results of Daniel et al. (2013) for HCN and HNC have large error bars because the HCN and HNC lines are heavily saturated. Opacity effects strongly impact the column density derivations and may lead to an underestimation of the main isotope column density, and thus of the 12C/13C ratios. This could explain why we are not able to reproduce the values derived by Daniel et al. (2013). Moreover, we can reproduce the value observed for HCN by Magalhães et al. (2018) at time t2. This behaviour is also shown in Fig. 8, which represents the time evolution of the 12C/13C ratio for the two models corresponding to the two observed low-mass star-forming regions. We note that since the model is not simulating dynamical evolution, the fact that different observations could be reproduced at different times cannot be used to conclude anything about the chemical age of the simulated star-forming region. In addition, we remind the reader that the initial conditions were taken somewhat arbitrarily, so the displayed time dependence is only indicative.
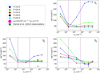 |
Fig. 5 HN12C/HN13C ratio as a function of nH, for different temperatures, at t1 (top right panel), t2 (bottom left panel), and t3 (bottom right panel). The large pink circles in the bottom panels represent the result of the model that simulates the physical conditions in the centre of the pre-stellar core B1b observed by Daniel et al. (2013). The HN12C/HN13C ratio observed by Daniel et al. (2013) is represented by the dark green star. We note that the error bar is within the symbol. In all the panels, the two vertical purple dashed lines represent the range of densities of the sample of high-mass star-forming region described in Sect. 3.2.2, and the black horizontal dashed lines represent the initial 12C/13C ratio of 68. |
3.2.2 High-mass star-forming regions sample
We used our model grid to estimate the 12C/13C ratio for HNC and HCN towards the sample of high-mass star-forming regions observed by Colzi et al. (2018a). In particular, we used the H2 column densities listed in Table 1 by Fontani et al. (2018) to derive the H2 densities towards the region described by the SCUBA or APEX effective beam4. The average nH of the sources ranges from 2 × 104 cm−3 up to 6 × 105 cm−3. The kinetic temperatures, given in Table 3 of Colzi et al. (2018a), are in between 14 and 47 K, and are similar to the range of values used in the grid of models performed earlier in this section. With this information, we can constrain the 12C/13C ratios predicted by our models that could be used to compute N-fractionation from 13C-isotopologue observations. Figures 5 and 6 show the HN12C/HN13C and H12CN/H13CN ratios for the three analysed times, together with the observed volume-density range.
The 12C/13C ratios derived for t1, t2, and t3, and the errors made when the 14 N/15N ratios are measured assuming a fixed local 12C/13C ratio of 68, for HNC and HCN, are listed in Table 6. Taking, for example, one of the sources with the highest H2 number density, 19 410+2336, with nH = 5.8 × 105 cm−3 and Tgas = 21 K, Colzi et al. (2018a) derived a HNC/H15NC ratio of 431 ± 24. For the early chemistry time, we obtain HNC/H15NC ~ 550. For t2 it is ~495, and for t3 the ratio goes down to ~370. This shows that our results are time-dependent, thus care needs to be taken in the comparison with observations, because the chemical times may not correspond to the dynamical age of the star-forming region. So, a more accurate model including also the evolution of physical parameters is necessary to better constrain the timescales. Moreover, the H2 column densities are derived fromregions (15′′ or 22′′) that probably also include the more diffuse gas that surrounds the denser cores in which star formation occurs. As an example, Beuther et al. (2007) derived an H2 column density of ~1023–1024 cm−2 in regions of ~2′′ in size towards the denser cores of the high-mass protocluster IRAS 05358 (see also Colzi et al. 2019). These column densities correspond to H2 number densities of ~106–107 cm−3 that are one or two orders of magnitude higher than those used in this section to compare with the model. Thus, detailed continuum observations and a description of the structures of these regions are needed.
12C/13C ratios predicted for HNC and HCN in the range of temperatures and densities of the high-mass star-forming regions sample observed by Colzi et al. (2018a) (Cols. 2 and 3).
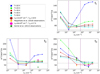 |
Fig. 6 H12CN/H13CN ratio as a function of nH, for different temperatures, at t1 (top right panel), t2 (bottom left panel), and t3 (bottom right panel). The large pink and brown circles in the bottom panels represent the result of the model that simulates the physical conditions in the centre of the pre-stellar cores B1b observed by Daniel et al. (2013) and L1498 observed by Magalhães et al. (2018), respectively. The H12CN/H13CN ratios observed by Daniel et al. (2013) and Magalhães et al. (2018) are represented by the dark green and orange stars, respectively. We note that the error bars are within the symbols. In all panels, the two vertical purple dashed lines represent the range of densities of the sample of high-mass star-forming region described in Sect. 3.2.2, and the black horizontal dashed lines represent the initial 12C/13C ratio of 68. |
3.2.3 Effect of cosmic rays
Finally, we discuss the possible effect of different cosmic-ray ionisation rates (ζ) in the fiducial model. Until now, we used the canonical value of 1.3 × 10⁻¹⁷ s−1 (e.g. Padovani et al. 2009). We analyse here how the main formation and destruction routes (cf. Fig. 4) change when one assumes lower and higher ζ with respect to the standard one: ζlow = 1.3 × 10⁻¹⁸ s−1 and ζhigh = 1.3 × 10⁻¹⁶ s−1, respectively. For example, ζhigh is similar to the value derived in the diffuse cloud in the vicinity of OMC-2 FIR4 by López-Sepulcre et al. (2013) (2.3 × ζhigh), and Caselli et al. (1998) used deuterium fraction measurements of HCO+ to constrain ζ in the range of 10−18–10−16 s−1 towards 24 cloud cores.
In the case of ζlow, the early chemistry time is 1.9 × 10⁵ yr, and in the model with ζhigh it is reduced to 5.8 × 10⁴ yr. Figures 9 and 10 show the behaviour of the abundances and 12C/13C ratios of the same molecules studied for the fiducial model, for ζlow and ζhigh, respectively. For these two models, we studied in detail two time-scales, before and after the early chemistry time. Figures C.1 and C.2 represent the main destruction and formation pathways of various species for ζlow and ζhigh, respectively.
In the case of ζlow, for t < t1, 12C is very abundant, as in the standard case, because of the efficiency of the low-temperature isotopic exchange reactions. However, in this model the C2 /C13C ratio is also higher than 68 and similar to the C-fractionation of atomic carbon. In fact, the secondary photon reactions are less efficient in creating C13C starting from C C. For t > t1, the isotopic exchange reaction involving C3 is still efficient since the destruction reaction of C
 C with secondary photons is not as significant as in the fiducial model. However, the atomic 12C/13C ratio decreases with the depletion of 12C onto grain surfaces. Moreover, the abundances of atomic carbon and related molecules (like C3 and CN) do not increase again in the late chemistry since He+ is not efficiently produced by cosmic-ray reactions, owing to the low ζ. This also affects the decrease of the 12C/13C ratios.
In the case of ζhigh, for t < t1, reactions with secondary photons are the most important ones. Thus, both 12C- and 13C-containing species follow the same chemical pathway (see left panel of Fig. C.2). In this case, C2 inherits the 12C/13C ratio from C3 (which is lower than 68), and the C-fractionation of atomic carbon and C3 is still governed by the very efficient low-temperature isotopic exchange reaction. For t > t1, the behaviour is similar to that of the fiducial model. The main difference is that the isotopic exchange reaction of C3 is still efficient since secondary photons create more atomic 13C (from C2 whose C-fractionation is inherited by C3) than in the fiducial model, maintaining the efficiency of this reaction for longer. As a consequence, the atomic 12C/13C ratio remains higher and there is no decreasing trend towards values lower than 68, not even for the molecules related to atomic carbon (CN, HCN, HNC). In the late chemistry time, atomic carbon and C-chains form very efficiently because of the enhanced abundance of He+ due to the higher cosmic-ray ionisation rate. This effect maintains a higher abundance of atomic carbon, and consequently the atomic 12C/13C ratio is larger.
We also performed a parameter-space exploration for a fixed nH of 2 × 104 cm−3, varying the temperatures from 10 up to 50 K and the cosmic-ray ionisation rate between ζlow and ζhigh. In particular, as already done in Sect. 3.2, we focused the analysis on HNC, HCN, and CN (Figs. 11–13). The main trend is that the 12C/13C ratios are highest for ζhigh. This is related to the fact that secondary photon reactions maintain a high efficiency of low-temperature isotopic exchange reactions that involve C3, and the atomic 12C/13C ratio (and that of related molecules) remains higher than 68 (see also Fig. C.2, right panel).
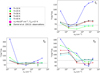 |
Fig. 7 12CN/13CN ratio as a function of nH, for different temperatures, at t1 (top right panel), t2 (bottom left panel), and t3 (bottom right panel). The large pink circles in the bottom panels represent the result of the model that simulates the physical conditions in the centre of the pre-stellar core B1b observed by Daniel et al. (2013). The 12CN/13CN ratio observed by Daniel et al. (2013) is represented by the green star. We note that the error bar is within the symbol. In all panels, the black horizontal dashed line represents the initial 12C/13C ratio of 68. |
4 Conclusions
We developed a new chemical network to study, in detail, how important isotopic exchange reactions are to the chemistry of carbon-containing species in the low temperature (10–50 K) gas in star-forming regions with nH = 2 × 10³–2 × 107 cm−3. In particular, we suggest the occurrence of 13C exchange involving C3 with atomic carbon and study the possible consequences of this reaction. The main results and conclusions of this work are summarised below:
- 1.
We found that reaction (10) is mainly important for Tgas < 27 K (owing to its exothermicity), and leads to 12C/13C < 68 for molecules that form from atomic carbon (e.g. C2, C3, and nitrile-bearing species). This behaviour occurs in the time period between the conversion of atomic carbon into CO, andthe time when CO is almost completely frozen out onto dust grains.
- 2.
We performed a detailed study of the 12C/13C ratios for the nitrile-bearing species HCN, HNC, and CN, as a function of density and for different temperatures. Our model can partially reproduce the carbon isotopic ratios derived by Daniel et al. (2013) and Magalhães et al. (2018) from observations towards low-mass pre-stellar cores.
- 3.
We also used our grid of models to evaluate how far we are from the correct 12C/13C ratio, assumed to be 68 in the local ISM, to derive the 14N/15N ratios in the sample of high-mass star-forming regions analysed by Colzi et al. (2018a). Our chemical model predicts that we are overestimating or underestimating the assumed 12C/13C ratios by factors ~0.8–1.9, even up to ~3.5, depending on the evolutionary time that we choose for the analysis. Considering these factors, the average nitrogen fractionation value of ~330 derived by Colzi et al. (2018a) and Colzi et al. (2018b) for HCN and HNC, could become 260–1150. This range would include both the low values measured in comets (e.g. 250), and the higher values found in low-mass pre-stellar cores (e.g. ~630–770 for N2H+ by Redaelli et al. 2018). This highlights the importance of knowing the precise 12C/13C ratios in studies of nitrogen fractionation with the double-isotope method.
- 4.
Finally, we performed a parameter-space exploration of the 12C/13C ratios for nitrile-bearing species, varying the cosmic-ray ionisation rate (ζ). We found that for ζ higher than the standard value of 1.3 × 10⁻¹⁷ s−1, the 12C/13C ratios are on average higher than in the cases with lower ζ. This result is due to the importance of secondary photon reactions in maintaining the efficiency of the isotopic exchange reactions involving C3, and to cosmic rays, which lead to an efficient production of atomic carbon and C-chains.
In a future work, we will upgrade the chemical network to cover nitrogen fractionation as well. This way, we will be able to better describe the interplay between carbon and nitrogen isotope chemistry. The inclusion of the position of 13C in multiple carbon bearing species is also another challenge left for future work.
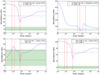 |
Fig. 8 Top-right panel: time evolution of the 12C/13C ratio for HCN for the model that simulates the centre of the pre-stellar core L1498 observed by Magalhães et al. (2018) (nH = 2 × 105 cm−3 and Tgas = 10 K). Top-left panel and bottom panels: time evolution of the 12C/13C ratio for HCN, CN, and HNC for the model that simulates the centre of the pre-stellar core B1b observed by Daniel et al. (2013) (nH = 6 × 106 cm−3 and Tgas = 17 K). In all panels, the green horizontal line indicates the observed ratio, with the associated uncertainty as a green area. The three red vertical lines represent t1, t2, and t3. The black horizontal dashed line represents the initial 12C/13C ratio of 68. |
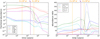 |
Fig. 9 Left panel: time evolution of CN, C, CO, C2, and C3 abundances with respect to H2 for the fiducial model with a cosmic-ray ionisation rate of 1.3 × 10⁻¹⁸ s−1. Right panel: time evolution of the 12C/13C ratio for CN, C, CO, C2, and C3 for the fiducial model with a cosmic-ray ionisation rate of 1.3 × 10⁻¹⁸ s−1. In both panels, the vertical purple solid line represents the early chemistry time as defined in the text, while the two vertical orange solid lines represent the two times (3 × 10⁴ yr, and 4 × 10⁵ yr) that we have analysed and discussed in the text. The trends obtained with the standard ζ of the fiducial model are superimposed with dashed lines. The black horizontal dashed line represents the initial 12C/13C ratio of 68. |
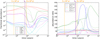 |
Fig. 10 Left panel: same as Fig. 9, but for ζ = 1.3 × 10⁻¹⁶ s−1. In both panels, the vertical purple solid line represents the early chemistry time as defined in the text, while the two vertical orange solid lines represent the two times (5 × 10³ yr, and 8 × 10⁴ yr) that we analyse and discuss in the text. The trends obtained with the standard ζ of the fiducial model are superimposed with dashed lines. The black horizontal dashed line represent the initial 12C/13C ratio of 68. |
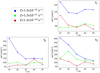 |
Fig. 11 HN12C/HN13C ratio as a function of the temperature, for different cosmic-ray ionisation rates, at t1 (top-right panel), t2 (bottom-left panel), and t3 (bottom-right panel). The black horizontal dashed line represents the initial 12C/13C ratio of 68. |
Acknowledgements
Many thanks to the anonymous referee for the careful reading of the paper and the comments that improved the work. This publication has received funding from the European Union’s Horizon 2020 research and innovation programme under grant agreement No 730562 [RadioNet]. L.C. acknowledges support from the Italian Ministero dell’Istruzione, Università e Ricerca through the grant Progetti Premiali 2012 – iALMA (CUP C52I13000140001). PC acknowledges support from the European Research Council (project PALs 320620). E.R. acknowledges partial support by the “Physique et Chimie du Milieu Interstellaire” (PCMI) of CNRS/INSU with INC/INP co-funded by CEA and CNES. Most of the figures were generated with the PYTHON-based package MATPLOTLIB (Hunter 2007).
Appendix A Comparison with existing fractionation procedure and chemical models
In this appendix, we compare the results of our chemical model with other results already published in the literature. Firstly, in Appendix A.1, we analyse the fractionation procedures in the implementation of the 13C chemistry and compare with the method used in Roueff et al. (2015). Secondly, in Appendix A.2 we compare our results to the 12C/13C ratios predicted by Furuya et al. (2011).
A.1 Comparison with Roueff et al. (2015) fractionation procedure
The settlingof fractionation reactions involving specific isotopic exchange represents the first important step that has to be completed by the fractionation of the various reactions involving carbon containing molecules, as described in Sect. 2.2. Such a procedure is not unequivocal when several carbon atoms are involved in a chemical reaction. We carefully analysed and compared the present method to the study performed by Roueff et al. (2015) for three different initial conditions in order to test the robustness of our findings. In particular, we used the initial conditions of this work (fiducial model with nH = 2 × 104 cm−3 and a temperature of 10 K), and those for model (a) and model (b) described in Table 4 of Roueff et al. (2015) (starless and pre-stellar core conditions, respectively). The results of the comparison are shown in Tables A.1–A.3, for the initial conditions of this work, model (a) and model (b), respectively. The tests are performed on the steady state results of the gas-phase model, as Roueff et al. (2015) did not consider surface reactions. Moreover, they restricted carbon-containing molecules to three carbon atoms, and included up to one 13C in each molecule.
We first ran the chemical network used in Roueff et al. (2015) by suppressing the substituted 15 N nitrogen species but keeping the deuterated components. We realised that reactions involving two carbon-containing molecules, which could lead to two other different carbon-containing molecules, could be fractionated differently, according to the chemical mechanism involved. Let us consider the reaction AC + BC → A′ C + B′ C. The reaction A13C + BC may then lead to A′ 13C + B′C if the reaction proceeds directly, with the same reaction rate coefficient as for the initial reaction. However, if an intermediate complex is occurring, a redistribution of 13C can take place and the reaction may lead to a complete scrambling of the carbon atoms. In this case, an additional channel A′ C + B′ 13C can be open, and then we assume that each channel occurs with the half value of the rate. The fractionation procedure used in Roueff et al. (2015) did not include this possibility. We thus compare (in Cols. 2 and 3 of the Tables in this section) the role of such scrambling possibilities in the 12C/13C ratios of several observed molecules. For example, Table A.1 shows that some ratios are more sensitive than others to this assumption, H2 CO and HNC being particularly sensitive. The introduction of full scrambling leads to a reduction of the 12C/13C ratio when the 13C isotopologue is found to be diluted in the non-scrambling approach. However, the lower ratios (e.g. for CO, HCO+) are not affected by this mechanism.
An additional test was performed by using the same chemical network with the additional assumption that the fractionation of 13C acts only on molecules containing a single carbon. The fourth column reports the results from this model, including systematic scrambling as described previously. The fifth column displays the results obtained with the chemical network used in this work, described in Sect. 2.2, assuming, as above, that the fractionation of 13C acts only on molecules containing a single carbon. We see that the results are in a reasonable agreement, with some small differences. These can be attributed to the additional sampling of the reactions made in the present study where charge exchange reactions are quoted specifically. An additional difference between the two treatments concerns the omission of the reactions between two 13C substituted reactants in the test results reported in Col. 5, whereas these reactions are taken into account in the tests reported in Cols. 2–4. All together, we conclude that the main trends of the isotopic ratios are preserved in the different hypotheses made to build the isotopic chemistry, but we indeed acknowledge the unavoidable remaining uncertainties of any systematic procedure.
A.2 Comparison with the previous model of Furuya et al. (2011)
Furuya et al. (2011) studied the behaviour of 12C/13C for CCH and CCS with a gas-grain chemical model. In particular, their work was based on the study of isotopomer fractionation, that is the abundance ratio between the variants of a given species where the 13C position is allowed to vary. They introduced as isotopic exchange reactions only (1) and (2) of Table 1. Moreover, they did not consider multiple 13C species, contrary to our fractionation procedure, which includes up to three 13C in molecules. Figure A.1 shows the abundances and 12C/13C ratios predicted by the present model for the same molecules studied by Furuya et al. (2011) in their Fig. 1, for the same physical conditions. We did not include HC3N since we cut the chemistry to five atom-containing molecules, and the results for this molecule could be biased by this assumption. The general time-dependence of CO, C, C+, and HCO+ is well reproduced in our model. The small differences are likely to be due to the introduction of new possible isotopic exchange reactions in our model that are efficient at low temperatures (like those for CN, C2, CS, and C3).
Comparison between the fractionation procedure used in this work and the one by Roueff et al. (2015): steady state 12C/13C ratios of different molecular species in a chemical model adopting the initial conditions of the fiducial model of this work.
Same as Table A.1, but adopting the initial conditions of model (a) in Roueff et al. (2015), corresponding to a starless core.
Same as Table A.1, but adopting the initial conditions of model (b) in Roueff et al. (2015), corresponding to a pre-stellar core.
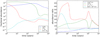 |
Fig. A.1 Abundances (left panel) and 12C/13C ratios (right panel)from our chemical model using a density of 105 cm−3 and temperature of 10 K (same as Furuya et al. 2011). In the right panel, the black horizontal dashed line represents the initial 12C/13C ratio of 68. |
Appendix B Parameter-space exploration of CO, HCO+, H2CO
In this appendix, we show the 12C/13C ratio of CO, HCO+, and H2CO as a function of nH and for different temperatures (Figs. B.1–B.3, respectively). In particular, we perform the same parameter-space exploration as that done for CN, HCN, and HNC in Sect. 3.2.
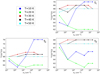 |
Fig. B.1 12CO/13CO ratio as a function of nH, for different temperatures, at t1 (top-right panel), t2 (bottom-left panel), and t3 (bottom-right panel). The black horizontal dashed line represents the initial 12C/13C ratio of 68. |


Appendix C Main formation and destruction pathways for different values of ζ
In this appendix, the main destruction and formation pathways of various species for ζlow and ζhigh are shown (Figs. C.1 and C.2, respectively). The main discussion about the different results obtained assuming a different ζ is given in Sect. 3.2.3.
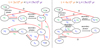 |
Fig. C.1 Chemical pathways that distribute the two carbon isotopes in atomic carbon, C2 and C3 at 3 × 10⁴ yr (left panel) and 4 × 10⁵ yr (right panel), for the fiducial model with a cosmic-ray ionisation rate of 1.3 × 10⁻¹⁸ s−1. Main creation and destruction reactions are highlighted in red, 12C is represented in blue, and 13C is represented in green. In this plot, the dashed black reactions are the less important ones. |
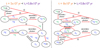 |
Fig. C.2 Chemical pathways that distribute the two carbon isotopes in atomic carbon, C2 and C3 at 5 × 10³ yr (left panel) and 8 × 10⁴ yr (right panel), for the fiducial model with a cosmic-ray ionisation rate of 1.3 × 10⁻¹⁶ s−1. Main creation and destruction reactions are highlighted in red, 12C is represented in blue and 13C is represented in green. |
References
- Ádámkovics,M., Blake, G. A., & McCall, B. J. 2003, ApJ, 595, 235 [NASA ADS] [CrossRef] [Google Scholar]
- Bergeman, T.,& Cossart, D. 1981, J. Mol. Spectr., 87, 119 [NASA ADS] [CrossRef] [Google Scholar]
- Beuther, H., Leurini, S., Schilke, P., et al. 2007, A&A, 466, 1065 [NASA ADS] [CrossRef] [EDP Sciences] [Google Scholar]
- Boehle, A., Ghez, A. M., Schödel, R., et al. 2016, ApJ, 830, 17 [NASA ADS] [CrossRef] [Google Scholar]
- Caselli, P., & Ceccarelli, C. 2012, A&ARv, 20, 56 [NASA ADS] [CrossRef] [MathSciNet] [Google Scholar]
- Caselli, P., Walmsley, C. M., Terzieva, R., & Herbst, E. 1998, ApJ, 499, 234 [NASA ADS] [CrossRef] [Google Scholar]
- Ceccarelli, C., Caselli, P., Bockelée-Morvan, D., et al. 2014, in Protostars and Planets VI, eds. H. Beuther, R. S. Klessen, C. P. Dullemond, & T. Henning (Tucson: University of Arizona Press), 859 [Google Scholar]
- Colzi, L., Fontani, F., Caselli, P., et al. 2018a, A&A, 609, A129 [NASA ADS] [CrossRef] [EDP Sciences] [Google Scholar]
- Colzi, L., Fontani, F., Rivilla, V. M., et al. 2018b, MNRAS, 478, 3693 [NASA ADS] [CrossRef] [Google Scholar]
- Colzi, L., Fontani, F., Caselli, P., et al. 2019, MNRAS, 485, 5543 [CrossRef] [Google Scholar]
- Daniel, F., Gérin, M., Roueff, E., et al. 2013, A&A, 560, A3 [NASA ADS] [CrossRef] [EDP Sciences] [Google Scholar]
- Fontani, F., Caselli, P., Palau, A., Bizzocchi, L., & Ceccarelli, C. 2015, ApJ, 808, L46 [NASA ADS] [CrossRef] [Google Scholar]
- Fontani, F., Vagnoli, A., Padovani, M., et al. 2018, MNRAS, 481, 79 [CrossRef] [Google Scholar]
- Fontani, F., Quaia, G., Ceccarelli, C., et al. 2020, MNRAS, 493, 3412 [CrossRef] [Google Scholar]
- Furuya, K., Aikawa, Y., Sakai, N., & Yamamoto, S. 2011, ApJ, 731, 38 [NASA ADS] [CrossRef] [EDP Sciences] [Google Scholar]
- Galazutdinov, G., Pětlewski, A., Musaev, F., et al. 2002, A&A, 395, 969 [NASA ADS] [CrossRef] [EDP Sciences] [Google Scholar]
- Giesen, T. F., Mookerjea, B., Fuchs, G. W., et al. 2020, A&A, 633, A120 [CrossRef] [EDP Sciences] [Google Scholar]
- Haffner, L. M., & Meyer, D. M. 1995, ApJ, 453, 450 [NASA ADS] [CrossRef] [Google Scholar]
- Hennig, P., Kraemer, W. P., & Diercksen, G. H. F. 1977, A compilation of theoretical spectroscopic constants and rotational-vibrational transition frequencies for the isoelectronic series of linear triatomic molecules HCN, HNC, HCO+, HOC+, HNN+ obtained from ab initio calculated energy hypersurfaces, Internal Report, MPI/PAE Astro 135, Max-Planck Institut, München [Google Scholar]
- Hily-Blant, P., Bonal, L., Faure, A., & Quirico, E. 2013a, Icarus, 223, 582 [Google Scholar]
- Hily-Blant, P., Pineau des Forêts, G., Faure, A., Le Gal, R., & Padovani, M. 2013b, A&A, 557, A65 [NASA ADS] [CrossRef] [EDP Sciences] [Google Scholar]
- Huber, K., & Herzberg, G. 1979, Molecular Spectra and Molecular Structure – IV. Constants of Diatomic Molecules (New York: Van nostrand Reinhold company) [CrossRef] [Google Scholar]
- Hunt, J. A. S., Bovy, J., & Carlberg, R. G. 2016, ApJ, 832, L25 [NASA ADS] [CrossRef] [Google Scholar]
- Hunter, J. D. 2007, Comput. Sci. Eng., 9, 90 [NASA ADS] [CrossRef] [Google Scholar]
- Langer, W. D., & Penzias, A. A. 1990, ApJ, 357, 477 [NASA ADS] [CrossRef] [Google Scholar]
- Langer, W. D., & Penzias, A. A. 1993, ApJ, 408, 539 [NASA ADS] [CrossRef] [Google Scholar]
- Langer, W. D., Wilson, R. W., Henry, P. S., & Guelin, M. 1978, ApJ, 225, L139 [NASA ADS] [CrossRef] [Google Scholar]
- Langer, W. D., Graedel, T. E., Frerking, M. A., & Armentrout, P. B. 1984, ApJ, 277, 581 [NASA ADS] [CrossRef] [Google Scholar]
- Le Petit, F., Roueff, E., & Le Bourlot, J. 2002, A&A, 390, 369 [NASA ADS] [CrossRef] [EDP Sciences] [Google Scholar]
- López-Sepulcre, A., Kama, M., Ceccarelli, C., et al. 2013, A&A, 549, A114 [NASA ADS] [CrossRef] [EDP Sciences] [Google Scholar]
- Magalhães, V. S., Hily-Blant, P., Faure, A., Hernand ez-Vera, M., & Lique, F. 2018, A&A, 615, A52 [NASA ADS] [CrossRef] [EDP Sciences] [Google Scholar]
- Maier, J. P., Lakin, N. M., Walker, G. A. H., & Bohlender, D. A. 2001, ApJ, 553, 267 [NASA ADS] [CrossRef] [MathSciNet] [Google Scholar]
- Milam, S. N., Savage, C., Brewster, M. A., Ziurys, L. M., & Wyckoff, S. 2005, ApJ, 634, 1126 [NASA ADS] [CrossRef] [Google Scholar]
- Mladenović, M., & Roueff, E. 2014, A&A, 566, A144 [NASA ADS] [CrossRef] [EDP Sciences] [Google Scholar]
- Mookerjea, B., Hassel, G. E., Gerin, M., et al. 2012, A&A, 546, A75 [NASA ADS] [CrossRef] [EDP Sciences] [Google Scholar]
- Mookerjea, B., Vastel, C., Hassel, G. E., et al. 2014, A&A, 566, A61 [NASA ADS] [CrossRef] [EDP Sciences] [Google Scholar]
- Oka, T., Thorburn, J. A., McCall, B. J., et al. 2003, ApJ, 582, 823 [NASA ADS] [CrossRef] [Google Scholar]
- Padovani, M., Galli, D., & Glassgold, A. E. 2009, A&A, 501, 619 [NASA ADS] [CrossRef] [EDP Sciences] [Google Scholar]
- Redaelli, E., Bizzocchi, L., Caselli, P., et al. 2018, A&A, 617, A7 [NASA ADS] [CrossRef] [EDP Sciences] [Google Scholar]
- Röllig, M., & Ossenkopf, V. 2013, A&A, 550, A56 [NASA ADS] [CrossRef] [EDP Sciences] [Google Scholar]
- Romano, D., Matteucci, F., Zhang, Z. Y., Papadopoulos, P. P., & Ivison, R. J. 2017, MNRAS, 470, 401 [NASA ADS] [CrossRef] [Google Scholar]
- Roueff, E., Felenbok, P., Black, J. H., & Gry, C. 2002, A&A, 384, 629 [NASA ADS] [CrossRef] [EDP Sciences] [Google Scholar]
- Roueff, E., Loison, J. C., & Hickson, K. M. 2015, A&A, 576, A99 [NASA ADS] [CrossRef] [EDP Sciences] [Google Scholar]
- Ruffle, D. P., Hartquist, T. W., Taylor, S. D., & Williams, D. A. 1997, MNRAS, 291, 235 [NASA ADS] [CrossRef] [Google Scholar]
- Sakai, N., Saruwatari, O., Sakai, T., Takano, S., & Yamamoto, S. 2010, A&A, 512, A31 [NASA ADS] [CrossRef] [EDP Sciences] [Google Scholar]
- Schröder, B., & Sebald, P. 2016, J. Chem. Phys., 144, 044307 [NASA ADS] [CrossRef] [Google Scholar]
- Semenov, D., Hersant, F., Wakelam, V., et al. 2010, A&A, 522, A42 [NASA ADS] [CrossRef] [EDP Sciences] [Google Scholar]
- Sipilä, O., Caselli, P., & Harju, J. 2013, A&A, 554, A92 [NASA ADS] [CrossRef] [EDP Sciences] [Google Scholar]
- Sipilä, O., Caselli, P., & Harju, J. 2015a, A&A, 578, A55 [NASA ADS] [CrossRef] [EDP Sciences] [Google Scholar]
- Sipilä, O., Harju, J., Caselli, P., & Schlemmer, S. 2015b, A&A, 581, A122 [NASA ADS] [CrossRef] [EDP Sciences] [Google Scholar]
- Sipilä, O., Caselli, P., & Harju, J. 2019a, A&A, 631, A63 [CrossRef] [EDP Sciences] [Google Scholar]
- Sipilä, O., Caselli, P., Redaelli, E., Juvela, M., & Bizzocchi, L. 2019b, MNRAS, 487, 1269 [NASA ADS] [CrossRef] [Google Scholar]
- Smith, D., & Adams, N. G. 1980, ApJ, 242, 424 [NASA ADS] [CrossRef] [Google Scholar]
- Taniguchi, K., Herbst, E., Ozeki, H., & Saito, M. 2019, ApJ, 884, 167 [Google Scholar]
- van Dishoeck, E. F., & Black, J. H. 1988, ApJ, 334, 771 [NASA ADS] [CrossRef] [Google Scholar]
- Visser, R., van Dishoeck, E. F., & Black, J. H. 2009, A&A, 503, 323 [NASA ADS] [CrossRef] [EDP Sciences] [Google Scholar]
- Wakelam, V., Loison, J. C., Herbst, E., et al. 2009, A&A, 495, 513 [NASA ADS] [CrossRef] [EDP Sciences] [Google Scholar]
- Wakelam, V., Loison, J. C., Herbst, E., et al. 2015, ApJS, 217, 20 [NASA ADS] [CrossRef] [Google Scholar]
- Wampfler, S. F., Jørgensen, J. K., Bizzarro, M., & Bisschop, S. E. 2014, A&A, 572, A24 [NASA ADS] [CrossRef] [EDP Sciences] [Google Scholar]
- Watson, W. D., Anicich, V. G., & Huntress, W. T., J. 1976, ApJ, 205, L165 [NASA ADS] [CrossRef] [Google Scholar]
- Wilson, T. L., & Rood, R. 1994, ARA&A, 32, 191 [NASA ADS] [CrossRef] [Google Scholar]
- Yan, Y. T., Zhang, J. S., Henkel, C., et al. 2019, ApJ, 877, 154 [NASA ADS] [CrossRef] [Google Scholar]
- Zeng, S., Jiménez-Serra, I., Cosentino, G., et al. 2017, A&A, 603, A22 [NASA ADS] [CrossRef] [EDP Sciences] [Google Scholar]
- Zhang, X.-N., Shi, D.-H., Sun, J.-F., & Zhu, Z.-L. 2011, Chin. Phys. B, 20, 043105 [NASA ADS] [CrossRef] [Google Scholar]
nH = n(H) + 2n(H2) ≃ 2n(H2) in dense molecular clouds like those simulated in this work.
The inner parts of a dense core are shielded from external UV photons, which can, in the inner regions, be created only through cosmic-ray-induced H2 electronic excitation.
Assuming a statistical distribution of 13C in C3, there are two options to place it at the ends of the carbon chain and only one at the centre of the molecule.
The effective beam of the continuum observations is 22′′ for SCUBA and 15′′ for APEX. The instrument used for each source is given in Table 1 of Fontani et al. (2018).
All Tables
Values of the ZPEs for molecules related to the isotopic exchange reactions used in our model.
12C/13C ratios for different molecules (C3, C2, C, CO, CN, HCN, and HNC) for three different times in the fiducial model: the early chemistry time (second row), t1, as defined in the text, and the times before and after t1 that we have discussed in the text (first and third rows, respectively).
12C/13C ratios predicted for HNC and HCN in the range of temperatures and densities of the high-mass star-forming regions sample observed by Colzi et al. (2018a) (Cols. 2 and 3).
Comparison between the fractionation procedure used in this work and the one by Roueff et al. (2015): steady state 12C/13C ratios of different molecular species in a chemical model adopting the initial conditions of the fiducial model of this work.
Same as Table A.1, but adopting the initial conditions of model (a) in Roueff et al. (2015), corresponding to a starless core.
Same as Table A.1, but adopting the initial conditions of model (b) in Roueff et al. (2015), corresponding to a pre-stellar core.
All Figures
|
Fig. 1 Time evolution of C+, C, CO, CH, and HCO+ (left panel) and of CN, HCN, and HNC (right panel) abundances with respect to H2 for the fiducial model with only gas-phase chemistry at work (solid lines) and with both gas-phase and grain-surface chemistry at work (dashed lines). |
| In the text | |
|
Fig. 2 Time evolution of the 12C/13C ratio for C, CO, CH, and HCO+ (left panel), and for CN, HCN, and HNC (right panel) for the fiducial model with only gas-phase chemistry at work (solid lines) and with both gas-phase and grain-surface chemistry at work (dashed lines). In both panels, the black horizontal dashed line represents the initial 12C/13C ratio of 68. |
| In the text | |
|
Fig. 3 Left panel: time evolution of CN, C, CO, C2, C3, and He+ abundances with respect to H2 for the fiducial model. Right panel: time evolution of the 12C/13C for CN, C, CO, C2, and C3 for the fiducial model. The black horizontal dashed line represents the initial 12C/13C ratio of 68. In both panels, the vertical purple solid line represents the ’early chemistry time’ as defined in the text, while the two vertical orange solid lines represent the two times (3 × 10⁴ yr, and 3 × 10⁵ yr) that we have analysed and discussed in the text. |
| In the text | |
|
Fig. 4 Chemical pathways that distribute the two carbon isotopes in atomic carbon, C2 and C3 at 3 × 10⁴ yr (left panel) and 3 × 10⁵ yr (right panel), for the fiducial model. Main creation and destruction reactions are highlighted in red, 12C is represented in blue and 13C is represented in green. |
| In the text | |
|
Fig. 5 HN12C/HN13C ratio as a function of nH, for different temperatures, at t1 (top right panel), t2 (bottom left panel), and t3 (bottom right panel). The large pink circles in the bottom panels represent the result of the model that simulates the physical conditions in the centre of the pre-stellar core B1b observed by Daniel et al. (2013). The HN12C/HN13C ratio observed by Daniel et al. (2013) is represented by the dark green star. We note that the error bar is within the symbol. In all the panels, the two vertical purple dashed lines represent the range of densities of the sample of high-mass star-forming region described in Sect. 3.2.2, and the black horizontal dashed lines represent the initial 12C/13C ratio of 68. |
| In the text | |
|
Fig. 6 H12CN/H13CN ratio as a function of nH, for different temperatures, at t1 (top right panel), t2 (bottom left panel), and t3 (bottom right panel). The large pink and brown circles in the bottom panels represent the result of the model that simulates the physical conditions in the centre of the pre-stellar cores B1b observed by Daniel et al. (2013) and L1498 observed by Magalhães et al. (2018), respectively. The H12CN/H13CN ratios observed by Daniel et al. (2013) and Magalhães et al. (2018) are represented by the dark green and orange stars, respectively. We note that the error bars are within the symbols. In all panels, the two vertical purple dashed lines represent the range of densities of the sample of high-mass star-forming region described in Sect. 3.2.2, and the black horizontal dashed lines represent the initial 12C/13C ratio of 68. |
| In the text | |
|
Fig. 7 12CN/13CN ratio as a function of nH, for different temperatures, at t1 (top right panel), t2 (bottom left panel), and t3 (bottom right panel). The large pink circles in the bottom panels represent the result of the model that simulates the physical conditions in the centre of the pre-stellar core B1b observed by Daniel et al. (2013). The 12CN/13CN ratio observed by Daniel et al. (2013) is represented by the green star. We note that the error bar is within the symbol. In all panels, the black horizontal dashed line represents the initial 12C/13C ratio of 68. |
| In the text | |
|
Fig. 8 Top-right panel: time evolution of the 12C/13C ratio for HCN for the model that simulates the centre of the pre-stellar core L1498 observed by Magalhães et al. (2018) (nH = 2 × 105 cm−3 and Tgas = 10 K). Top-left panel and bottom panels: time evolution of the 12C/13C ratio for HCN, CN, and HNC for the model that simulates the centre of the pre-stellar core B1b observed by Daniel et al. (2013) (nH = 6 × 106 cm−3 and Tgas = 17 K). In all panels, the green horizontal line indicates the observed ratio, with the associated uncertainty as a green area. The three red vertical lines represent t1, t2, and t3. The black horizontal dashed line represents the initial 12C/13C ratio of 68. |
| In the text | |
|
Fig. 9 Left panel: time evolution of CN, C, CO, C2, and C3 abundances with respect to H2 for the fiducial model with a cosmic-ray ionisation rate of 1.3 × 10⁻¹⁸ s−1. Right panel: time evolution of the 12C/13C ratio for CN, C, CO, C2, and C3 for the fiducial model with a cosmic-ray ionisation rate of 1.3 × 10⁻¹⁸ s−1. In both panels, the vertical purple solid line represents the early chemistry time as defined in the text, while the two vertical orange solid lines represent the two times (3 × 10⁴ yr, and 4 × 10⁵ yr) that we have analysed and discussed in the text. The trends obtained with the standard ζ of the fiducial model are superimposed with dashed lines. The black horizontal dashed line represents the initial 12C/13C ratio of 68. |
| In the text | |
|
Fig. 10 Left panel: same as Fig. 9, but for ζ = 1.3 × 10⁻¹⁶ s−1. In both panels, the vertical purple solid line represents the early chemistry time as defined in the text, while the two vertical orange solid lines represent the two times (5 × 10³ yr, and 8 × 10⁴ yr) that we analyse and discuss in the text. The trends obtained with the standard ζ of the fiducial model are superimposed with dashed lines. The black horizontal dashed line represent the initial 12C/13C ratio of 68. |
| In the text | |
|
Fig. 11 HN12C/HN13C ratio as a function of the temperature, for different cosmic-ray ionisation rates, at t1 (top-right panel), t2 (bottom-left panel), and t3 (bottom-right panel). The black horizontal dashed line represents the initial 12C/13C ratio of 68. |
| In the text | |
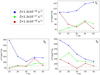 |
Fig. 12 Same as Fig. 11, but for H12CN/H13CN. |
| In the text | |
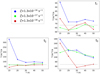 |
Fig. 13 Same as Fig. 11, but for 12CN/13CN. |
| In the text | |
|
Fig. A.1 Abundances (left panel) and 12C/13C ratios (right panel)from our chemical model using a density of 105 cm−3 and temperature of 10 K (same as Furuya et al. 2011). In the right panel, the black horizontal dashed line represents the initial 12C/13C ratio of 68. |
| In the text | |
|
Fig. B.1 12CO/13CO ratio as a function of nH, for different temperatures, at t1 (top-right panel), t2 (bottom-left panel), and t3 (bottom-right panel). The black horizontal dashed line represents the initial 12C/13C ratio of 68. |
| In the text | |
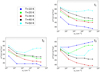 |
Fig. B.2 As Fig. B.1, but for H12CO+/H13CO+. |
| In the text | |
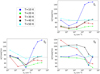 |
Fig. B.3 As Fig. B.1, but for H |
| In the text | |
|
Fig. C.1 Chemical pathways that distribute the two carbon isotopes in atomic carbon, C2 and C3 at 3 × 10⁴ yr (left panel) and 4 × 10⁵ yr (right panel), for the fiducial model with a cosmic-ray ionisation rate of 1.3 × 10⁻¹⁸ s−1. Main creation and destruction reactions are highlighted in red, 12C is represented in blue, and 13C is represented in green. In this plot, the dashed black reactions are the less important ones. |
| In the text | |
|
Fig. C.2 Chemical pathways that distribute the two carbon isotopes in atomic carbon, C2 and C3 at 5 × 10³ yr (left panel) and 8 × 10⁴ yr (right panel), for the fiducial model with a cosmic-ray ionisation rate of 1.3 × 10⁻¹⁶ s−1. Main creation and destruction reactions are highlighted in red, 12C is represented in blue and 13C is represented in green. |
| In the text | |
Current usage metrics show cumulative count of Article Views (full-text article views including HTML views, PDF and ePub downloads, according to the available data) and Abstracts Views on Vision4Press platform.
Data correspond to usage on the plateform after 2015. The current usage metrics is available 48-96 hours after online publication and is updated daily on week days.
Initial download of the metrics may take a while.