Free Access
Fig. A.1
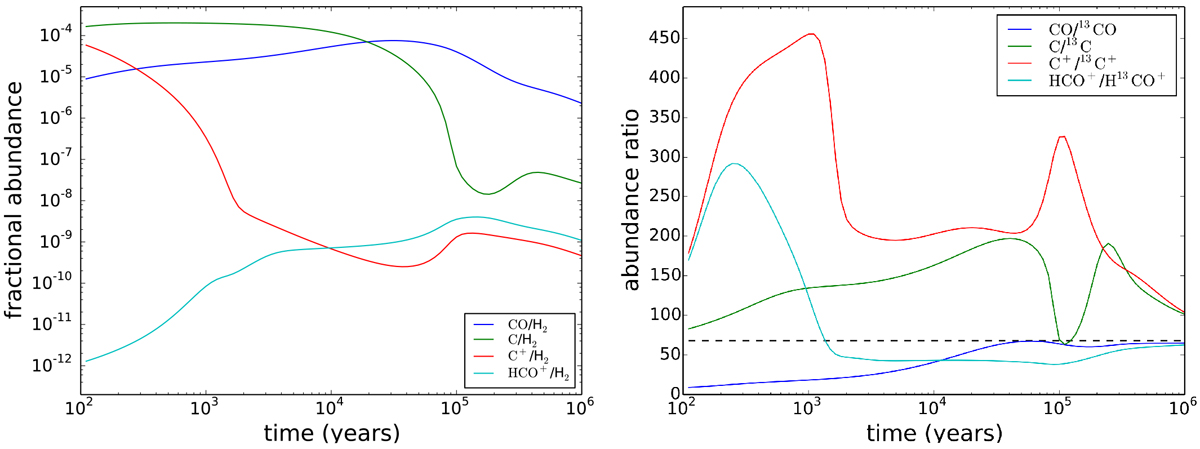
Abundances (left panel) and 12C/13C ratios (right panel)from our chemical model using a density of 105 cm−3 and temperature of 10 K (same as Furuya et al. 2011). In the right panel, the black horizontal dashed line represents the initial 12C/13C ratio of 68.
Current usage metrics show cumulative count of Article Views (full-text article views including HTML views, PDF and ePub downloads, according to the available data) and Abstracts Views on Vision4Press platform.
Data correspond to usage on the plateform after 2015. The current usage metrics is available 48-96 hours after online publication and is updated daily on week days.
Initial download of the metrics may take a while.