Fig. 3
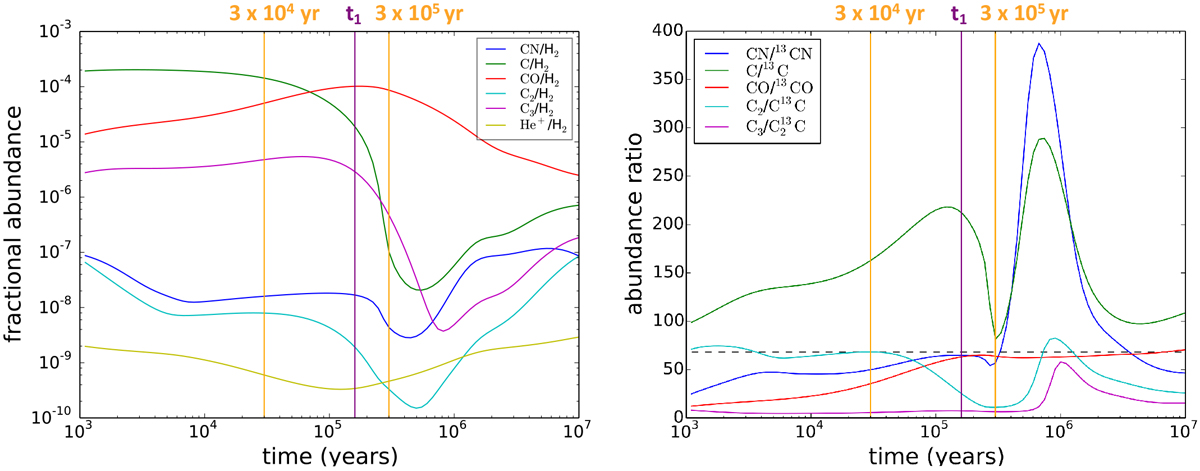
Left panel: time evolution of CN, C, CO, C2, C3, and He+ abundances with respect to H2 for the fiducial model. Right panel: time evolution of the 12C/13C for CN, C, CO, C2, and C3 for the fiducial model. The black horizontal dashed line represents the initial 12C/13C ratio of 68. In both panels, the vertical purple solid line represents the ’early chemistry time’ as defined in the text, while the two vertical orange solid lines represent the two times (3 × 10⁴ yr, and 3 × 10⁵ yr) that we have analysed and discussed in the text.
Current usage metrics show cumulative count of Article Views (full-text article views including HTML views, PDF and ePub downloads, according to the available data) and Abstracts Views on Vision4Press platform.
Data correspond to usage on the plateform after 2015. The current usage metrics is available 48-96 hours after online publication and is updated daily on week days.
Initial download of the metrics may take a while.