Fig. 6
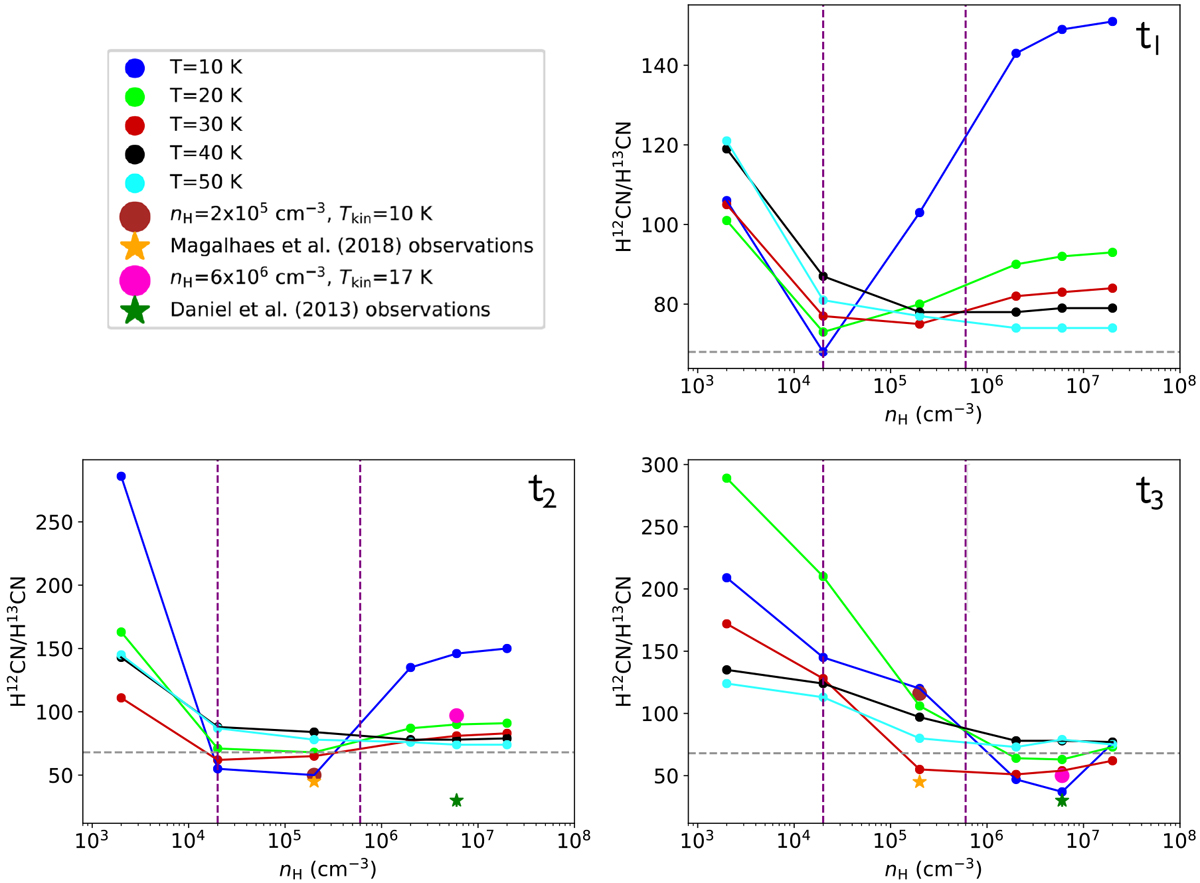
H12CN/H13CN ratio as a function of nH, for different temperatures, at t1 (top right panel), t2 (bottom left panel), and t3 (bottom right panel). The large pink and brown circles in the bottom panels represent the result of the model that simulates the physical conditions in the centre of the pre-stellar cores B1b observed by Daniel et al. (2013) and L1498 observed by Magalhães et al. (2018), respectively. The H12CN/H13CN ratios observed by Daniel et al. (2013) and Magalhães et al. (2018) are represented by the dark green and orange stars, respectively. We note that the error bars are within the symbols. In all panels, the two vertical purple dashed lines represent the range of densities of the sample of high-mass star-forming region described in Sect. 3.2.2, and the black horizontal dashed lines represent the initial 12C/13C ratio of 68.
Current usage metrics show cumulative count of Article Views (full-text article views including HTML views, PDF and ePub downloads, according to the available data) and Abstracts Views on Vision4Press platform.
Data correspond to usage on the plateform after 2015. The current usage metrics is available 48-96 hours after online publication and is updated daily on week days.
Initial download of the metrics may take a while.