Fig. 10
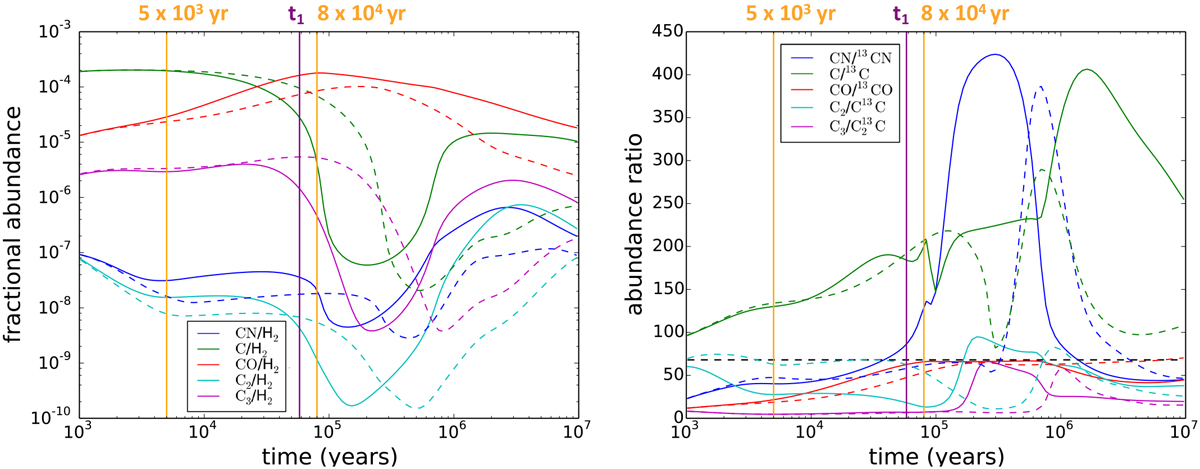
Left panel: same as Fig. 9, but for ζ = 1.3 × 10⁻¹⁶ s−1. In both panels, the vertical purple solid line represents the early chemistry time as defined in the text, while the two vertical orange solid lines represent the two times (5 × 10³ yr, and 8 × 10⁴ yr) that we analyse and discuss in the text. The trends obtained with the standard ζ of the fiducial model are superimposed with dashed lines. The black horizontal dashed line represent the initial 12C/13C ratio of 68.
Current usage metrics show cumulative count of Article Views (full-text article views including HTML views, PDF and ePub downloads, according to the available data) and Abstracts Views on Vision4Press platform.
Data correspond to usage on the plateform after 2015. The current usage metrics is available 48-96 hours after online publication and is updated daily on week days.
Initial download of the metrics may take a while.