| Issue |
A&A
Volume 639, July 2020
|
|
|---|---|---|
| Article Number | A43 | |
| Number of page(s) | 17 | |
| Section | Extragalactic astronomy | |
| DOI | https://doi.org/10.1051/0004-6361/202037642 | |
| Published online | 07 July 2020 | |
Cold molecular gas and PAH emission in the nuclear and circumnuclear regions of Seyfert galaxies
1
Centro de Astrobiología (CAB, CSIC-INTA), ESAC Campus, Villanueva de la Cañada, 28692 Madrid, Spain
e-mail: This email address is being protected from spambots. You need JavaScript enabled to view it.
2
Centro de Astrobiología (CAB, CSIC-INTA), Carretera de Torrejón a Ajalvir, Torrejón de Ardoz, 28880 Madrid, Spain
3
Department of Physics, University of Oxford, Keble Road, Oxford OX1 3RH, UK
4
Observatorio de Madrid, OAN-IGN, Alfonso XII, 3, 28014 Madrid, Spain
5
LERMA, Obs. de Paris, PSL Research Univ., Collège de France, CNRS, Sorbonne Univ., UPMC, Paris, France
6
Max Planck Institut fuer extraterrestrische Physik Postfach 1312, 85741 Garching bei München, Germany
7
Núcleo de Astronomía, Facultad de Ingeniería y Ciencias, Universidad Diego Portales, Ejército Libertador 441, Santiago 8320000, Chile
8
Chinese Academy of Sciences South America Center for Astronomy, National Astronomical Observatories, CAS, Beijing 100101, China
9
Instituto de Radioastronomía y Astrofísica (IRyA-UNAM), 3-72 (Xangari), 8701 Morelia, Mexico
10
Centro de Estudios de Física del Cosmos de Aragón, Unidad Asociada al CSIC, Plaza San Juan 1, 44001 Teruel, Spain
11
Department of Physics & Astronomy, University of Alaska Anchorage 99508-4664, USA
12
Department of Physics & Astronomy, University of Southampton, Hampshire, SO17 1BJ Southampton, UK
13
Space Telescope Science Institute, 3700 San Martin Drive, Baltimore, MD 21218, USA
14
Instituto de Astrofísica de Canarias, Calle vía Láctea, s/n, 38205 La Laguna, Tenerife, Spain
15
Departamento de Astrofísica, Universidad de La Laguna, 38205 La Laguna, Tenerife, Spain
16
Centre for Extragalactic Astronomy, Durham University, South Road, Durham DH1 3LE, UK
Received:
3
February
2020
Accepted:
5
May
2020
Abstract
We investigate the relation between the detection of the 11.3 μm polycyclic aromatic hydrocarbon (PAH) feature in the nuclear (∼24−230 pc) regions of 22 nearby Seyfert galaxies and the properties of the cold molecular gas. For the former we use ground-based (0.3−0.6″ resolution) mid-infrared (mid-IR) spectroscopy. The cold molecular gas is traced by ALMA and NOEMA high (0.2−1.1″) angular resolution observations of the CO(2–1) transition. Galaxies with a nuclear detection of the 11.3 μm PAH feature contain more cold molecular gas (median 1.6 × 10⁷ M⊙) and have higher column densities (N(H2) = 2 × 1023 cm−2) over the regions sampled by the mid-IR slits than those without a detection. This suggests that molecular gas plays a role in shielding the PAH molecules in the harsh environments of Seyfert nuclei. Choosing the PAH molecule naphthalene as an illustration, we compute its half-life in the nuclear regions of our sample when exposed to 2.5 keV hard X-ray photons. We estimate shorter half-lives for naphthalene in nuclei without a 11.3 μm PAH detection than in those with a detection. The Spitzer/IRS PAH ratios on circumnuclear scales (∼4″ ∼ 0.25−1.3 kpc) are in between model predictions for neutral and partly ionized PAHs. However, Seyfert galaxies in our sample with the highest nuclear H2 column densities are not generally closer to the neutral PAH tracks. This is because in the majority of our sample galaxies, the CO(2–1) emission in the inner ∼4″ is not centrally peaked and in some galaxies traces circumnuclear sites of strong star formation activity. Spatially resolved observations with the MIRI medium-resolution spectrograph on the James Webb Space Telescope will be able to distinguish the effects of an active galactic nucleus (AGN) and star formation on the PAH emission in nearby AGN.
Key words: galaxies: Seyfert / galaxies: nuclei / galaxies: ISM / radio lines: galaxies
© ESO 2020
1. Introduction
The balance between gas inflows and outflows in the nuclear regions of active galaxies is fundamental for understanding both the growth of supermassive black holes (see the review by Alexander & Hickox 2012) and the maintenance of the obscuring molecular dusty torus (Elitzur & Shlosman 2006; Ramos Almeida & Ricci 2017; Hönig 2019). Moreover, theoretical models and numerical simulations predict that the accumulation of molecular gas due to the inflow process will also trigger star formation (SF) activity in the nuclear or circumnuclear regions of active galaxies (see, e.g., Kawakatu & Wada 2008; Vollmer et al. 2008; Hopkins & Quataert 2010). Understanding the SF properties, including the timescales for gas consumption and SF-driven feedback, has important implications for the final amount of gas available for fuelling the active galactic nucleus (AGN) and perhaps for contributing to momentum loss in the nuclear regions (see, e.g., Izumi et al. 2016, and references therein). However, measuring the SF properties in the nuclear regions of active galaxies is particularly challenging because many of the traditional SF indicators are contaminated by emission from the AGN.
The emission from polycyclic aromatic hydrocarbon (PAH) features has been proposed as a good indicator of the star formation rate (SFR) over timescales of up to a few hundred million years (Peeters et al. 2004; Shipley et al. 2016; Xie & Ho 2019). The majority of nearby Seyfert galaxies show PAH emission especially on kiloparsec scales, generally with smaller equivalent widths (EW) than star-forming galaxies (see, e.g., Roche et al. 1991; Clavel et al. 2000; Wu et al. 2009; Gallimore et al. 2010; Diamond-Stanic & Rieke 2012). On nuclear scales (tens to hundreds of parsecs), the 11.3 μm PAH feature is detected in a significant number of Seyfert galaxies, but with even smaller EW (Hönig et al. 2010; González-Martín et al. 2013; Alonso-Herrero et al. 2014, 2016; Ramos Almeida et al. 2014; Jensen et al. 2017; Esparza-Arredondo et al. 2018). It is not clear whether the reduced EW are due to destruction of PAH molecules, increased continuum contribution from the AGN, and/or changes in PAH excitation conditions. In local Seyfert galaxies, the 11.3 μm PAH emission is well correlated with the [Ne II]12.8 μm emission, indicating that it may potentially be a good SFR indicator for AGN (Diamond-Stanic & Rieke 2010, 2012; Esquej et al. 2014). On the other hand, Jensen et al. (2017) proposed that PAH molecules might also be excited by AGN photons, making it necessary to evaluate this component before using the PAH emission as an SFR indicator.
Theoretical works argued that the PAH molecules may be destroyed in the immediate vicinity of the AGN due to dust evaporation by X-ray irradiation (Voit 1991; Siebenmorgen et al. 2004). However, Voit (1992) postulated that when PAH emission is detected in the nuclear or circumnuclear regions of AGN, the PAH molecules must be shielded by high column densities of X-ray absorbing gas. Recently, Monfredini et al. (2019) presented experimental work to evaluate the photoionization and photodissociation properties of some simple (number of carbon atoms between 10 and 16) PAH molecules when exposed to X-ray photons. They demonstrated that this process results in dissociation of the molecules and enrichment of multiply charged ions caused by X-ray photoselection. They also estimated relatively short half-lives for these PAH molecules in a few AGN when compared to the PAH injection times in the interstellar medium (ISM) by evolved stars.
The main goal of this paper is to investigate the role of cold molecular gas in shielding PAH molecules from the AGN radiation field. To do so, we study a sample of nearby Seyfert galaxies. The sample (see Table 1) is based on AGN with previously published ground-based mid-infrared (mid-IR) spectra that would cover the 11.3 μm PAH feature. We focus on observations obtained with 8–10 m class telescopes, so that the slit widths (0.3−0.7″, see Table 2) cover the nuclear regions on physical scales between 22 and 230 pc. We also use archival Spitzer observations to study the PAH emission from the circumnuclear regions. To trace the cold molecular gas, we use high (≃0.2−1.1″) angular resolution observations of the CO(2–1) transition taken with both the NOrthern Extended Millimeter Array (NOEMA) in the northern hemisphere and the Atacama Large Millimeter Array (ALMA) in the southern hemisphere. The high angular resolutions provided by ALMA and NOEMA allow us to probe the molecular gas properties on nuclear and circumnuclear scales in Seyfert galaxies.
Properties of the sample.
Ground-based mid-IR spectroscopic observations.
The paper is organized as follows. Section 2 presents the observations and data reduction. Section 3 describes the analysis of the CO(2–1) observations. In Sect. 4 we investigate the dependence of the nuclear 11.3 μm PAH detection with the molecular gas and AGN. In Sect. 5 we analyze the circumnuclear PAH emission in our sample of Seyfert galaxies. Section 6 summarizes the main results and briefly discusses future prospects with the James Webb Space Telescope (JWST).
2. Observations and data reduction
2.1. CO(2–1) and continuum 1.3 mm observations
The NOEMA observations and data reduction for the galaxies in our sample (see Table 3) are described in detail in Domínguez-Fernández et al. (2020). The majority of the ALMA observations used in this work are either from our own programs or are taken from the ALMA archive. Of the remaining galaxies in our sample, NGC 1068 and NGC 2110 have published ALMA CO(2–1) observations (see García-Burillo et al. 2019; Rosario et al. 2019, respectively). For NGC 1320 and NGC 2992, which belong to the 12 μm ALMA program (PI: M. Malkan), the nuclear CO(2–1) fluxes were provided to us prior to publication (see Sect. 3).
ALMA and NOEMA CO(2–1) observations.
We downloaded the band 6 CO(2–1) and adjacent continuum raw data from the ALMA archive. For galaxies observed by multiple programs, we selected the observations with the highest angular resolution. The raw data were then calibrated using the standard pipeline calibration within the Common Astronomy Software Applications (CASA) v5.1 (McMullin et al. 2007). This calibration includes the flagging of the data, system temperature calibration, bandpass calibration, and phase and amplitude calibrations. Then, we subtracted the continuum using the line-free channels in the uv visibility data and used the CASA CLEAN task to generate the CO(2–1) data cubes. We used a Briggs weighting (Briggs 1995), with a robustness parameter of b = 0.5. For the continuum images, we combined the line-free channels in all the observed spectral windows of each observation. We applied a primary beam correction, although the effect on the regions covered by the nuclear slits is negligible. For simplicity, we refer to the wavelength of the band 6 continuum images as 1.3 mm. We list the resulting synthesized beam sizes and position angles (PAbeam) for the CO(2–1) and 1.3 mm continuum maps in Tables 3 and A.1, respectively.
From the fully reduced ALMA datacubes, we produced maps of the integrated CO(2–1) intensity as the zeroth-order moment using pixels at all frequencies with detections > 4σ. For galaxies with fainter emission (NGC 1365, NGC 3081, and NGC 7213), we also generated CO(2–1) maps with a lower detection threshold (2σ), which we used for the aperture photometry (see Sect. 3). We used the NOEMA CO(2–1) maps generated for detections > 3σ from Domínguez-Fernández et al. (2020). Figure 1 shows the maps of the integrated CO(2–1) line emission for the galaxies analyzed in this work (see Sect. 3). We chose a field of view (FoV) of 4″×4″ to show the approximate region covered by the extracted the InfraRed Spectrograph (IRS, Houck et al. 2004) short-low (SL) spectra where the brightest mid-IR PAH features are (see Sect. 2.3).
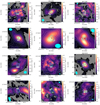 |
Fig. 1. Maps of the integrated CO(2–1) emission (in a linear scale in units of Jy km s−1 beam−1 marked with the color bar on the right-hand side of each panel) showing the central 4″×4″ regions that are approximately covered by the Spitzer/IRS SL observations. We do not plot the actual orientation of the IRS slits. The NOEMA CO(2–1) maps (Mrk 1066, NGC 2273, NGC 4253, NGC 4388, and NGC 7465) were constructed using a 3σ detection threshold (see Domínguez-Fernández et al. 2020), whereas the ALMA CO(2–1) maps with 4σ, and 2σ detection thresholds (see text for details). The pixels with no detected CO(2–1) emission below the defined thresholds are shown in gray. The contours are also shown on a linear scale. The filled star marks the location of the 1.3 mm continuum peak assumed to be the AGN location (see Sect. 3.1 and Table A.1 for full details). The filled cyan ellipses display the synthesized beam (size and PA) of the observations for each galaxy (see Table 3). For each galaxy, the cyan square is the aperture used to extract the nuclear CO(2–1) fluxes and simulates the mid-IR nuclear slit. The distance from the AGN value rAGN is computed as half of the ground-based slit width. The size of the latter is also indicated in parsecs for each galaxy. For NGC 5135 and NGC 7582, the dashed lines are the slit orientation to indicate the direction of the surface brightness profile extraction. |
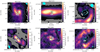 |
Fig. 1. continued. |
2.2. Ground-based mid-IR spectroscopy
All the ground-based mid-IR spectroscopic observations used in this work have been published previously, and the corresponding references are given in the last column of Table 2. The majority of the mid-IR spectroscopic observations were taken close to the diffraction limit at 8.7 μm with angular resolutions in the range 0.3−0.6″ (full width at half-maximum, FWHM, see, e.g., Hönig et al. 2010; González-Martín et al. 2013; Alonso-Herrero et al. 2016). We also indicate whether the 11.3 μm PAH feature was detected on the nuclear scales defined by the slit width. Of the 22 Seyfert galaxies in our sample, this feature is detected in 12 nuclei. The nuclear regions probed by the ground-based mid-IR spectra are determined by the slit width. On nuclear scales, the maximum distance from the AGN where the 11.3 μm PAH feature is detected (or not detected) is therefore given by half of the mid-IR slit width. We refer it to as the distance from the AGN, rAGN (see Table 2 for the value for each galaxy and Sect. 4.3 for a discussion). The range of rAGN is quite varied, from 12 to 115 pc. However, the circumnuclear rings, when present in our sample galaxies (see Fig. 1 and Table 3) and in other galaxies (Comerón et al. 2010), are well beyond the radius defined by the nuclear mid-IR apertures.
2.3. Spitzer/IRS observations
To study the PAH emission on circumnuclear scales we use archival Spitzer observations taken with IRS covering the SL and long-low (LL) spectral ranges of 5−15 μm and 15−40 μm, respectively, with spectral resolutions R ∼ 60−120. All the galaxies in our sample, except for NGC 1320 and NGC 4253, were observed in the staring mode. We downloaded the fully calibrated spectra from the Cornell Atlas of Spitzer/IRS Sources (CASSIS, version LR7, Lebouteiller et al. 2011) or the Spitzer archive. Only NGC 7465 was not observed with IRS. For the galaxies in this work, the optimal CASSIS extraction was equivalent to a point-source extraction. The slit width of the SL observations is 3.7″. Taking the SL module as the basis, we applied a small offset to stitch together the SL and LL spectra. NGC 1320 and NGC 4253 were observed in spectral mapping mode. We used CUBISM (Smith et al. 2007a) to fully reduce the observations and extract the circumnuclear spectra. We chose apertures of 5.9″ × 5.9″ and 17.3″ × 17.3″ for the SL and LL modules, respectively. To recover the nuclear flux at each wavelength, we applied an aperture correction using a standard star.
The IRS PAH feature fluxes of the majority of the galaxies in our sample are published in other works (see, e.g., Wu et al. 2009; Gallimore et al. 2010; Diamond-Stanic & Rieke 2010; Pereira-Santaella et al. 2010) but using different methods and extraction apertures. For consistency, we obtained our own measurements. Given the complicated nature of the mid-IR continuum and the different contributions from the AGN and star forming regions, instead of using a local continuum we chose to perform a full fit of the 5−40 μm spectral range.
We used a modified version of the PAHFIT code (Smith et al. 2007b) to obtain the fluxes of different PAH features. This version fits the mid-IR spectrum with a continuum, PAH emission, and the 10 μm silicate feature in emission or absorption. For the feature in emission, the code uses the Ossenkopf et al. (1992) cold dust model where the silicate feature peaks at ∼10.1 μm (see Gallimore et al. 2010, for more details). There are seven type 1 Seyfert galaxies in our sample with evidence of having the silicate feature in emission or nearly flat. NGC 2110 and NGC 7213 clearly show the silicate feature in emission, both in the Spitzer/IRS and in the nuclear ground-based spectra (see Mason et al. 2009; Hönig et al. 2010; Esquej et al. 2014). For these, we allowed for the silicate feature peak to vary. The best fits were at 10.6 μm for NGC 7213 and 10.7 μm for NGC 2110. For the other type 1 Seyfert galaxies in our sample (NGC 1365, NGC 3081, NGC 3227, NGC 4253, and NGC 7469), the 10 μm silicate feature is nearly flat or slightly in emission, as can be seen in the nuclear spectra (see Hönig et al. 2010; González-Martín et al. 2013; Esquej et al. 2014). Because the feature is not as prominent as in the other two galaxies, we did not vary the emission peak wavelength when we fit the spectra with PAHFIT. We are only interested in the brightest PAH features, specifically, in the ratios between the 11.3 μm PAH complex (11.23 μm and 11.33 μm features) and the 7.7 μm PAH complex (7.42 μm, 7.60 μm, and 7.85 μm features) and between the 6.2 μm PAH and the 7.7 μm PAH complex. We list the fluxes (or upper limits) and corresponding errors in Table 4.
Measurements with PAHFIT using the Spitzer/IRS spectra.
We finally discuss an additional source of uncertainty related to the continuum fit when the fluxes of the different PAH features are obtained. When the 10 μm silicate feature in emission is included, the f(11.3 μm)/f(7.7 μm) and f(6.2 μm)/ f(7.7 μm) PAH ratios tend to decrease, as does the continuum level in the 6−13 μm region. We illustrate this in Fig. 2 for NGC 7469. When we did not use this additional component for the silicate feature in emission, we obtained PAH ratios of f(11.3 μm)/f(7.7 μm) = 0.39 and f(6.2 μm)/f(7.7 μm) = 0.27, whereas we obtained f(11.3 μm)/f(7.7 μm) = 0.21 and f(6.2 μm)/f(7.7 μm) = 0.16 when it was included.
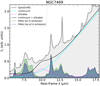 |
Fig. 2. Observed Spitzer/IRS spectrum (in gray) of NGC 7469. We show the continuum (dashed cyan line) and silicate feature in emission (dotted magenta line) and their sum (black line), as well as the PAH feature spectra (green curve) fit with PAHFIT. We also show the fit PAH feature spectrum (blue and purple curve) when PAHFIT fit was run without the silicate feature in emission. Both the f(11.3 μm)/f(7.7 μm) and f(6.2 μm)/f(7.7 μm) PAH ratios are noticeably lower when the fit includes a component with the silicate feature in emission. |
3. Analysis of the ALMA and NOEMA observations
Figure 1 shows the variety of the nuclear and circumnuclear CO(2–1) morphologies of the galaxies in our sample over the selected FoV of 4″ × 4″. A small fraction of the galaxies show centrally peaked emission with associated nuclear mini-spirals (e.g., NGC 1808, NGC 5643, and NGC 7130). Many also show CO(2–1) circumnuclear rings that are probably associated with the inner Lindblad resonance due to the presence of a large-scale bar (e.g., NGC 1365, NGC 7469, and NGC 7582, see morphological types in Table 1). Nevertheless, the vast majority show complicated CO(2–1) morphologies with several emitting regions where the AGN might not be easily identified. In this section we first determine the AGN position before we perform the aperture photometry. We then describe the method with which we measured the nuclear CO(2–1) fluxes. We also extract the CO(2–1) surface brightness profiles for two galaxies with extended 11.3 μm PAH emission (see Esparza-Arredondo et al. 2018), circumnuclear rings of SF, and ionization cones. These galaxies are NGC 5135 and NGC 7582.
3.1. Identification of the AGN position
A number of works have shown that the continuum emission at 1.3 mm in Seyfert galaxies is mostly produced by synchrotron emission with varying contributions from cold dust emission and free-free emission (Pasetto et al. 2019; Alonso-Herrero et al. 2019; García-Burillo et al. 2019). We therefore assumed that the peak of the 1.3 mm can be used to locate the position of the AGN (see also Appendix A).
Of the galaxies analyzed in this work, only six show one 1.3 mm continuum peak in the ALMA maps. The remaining seven (NGC 1365, NGC 1808, NGC 3081, NGC 5135, NGC 7130, NGC 7469, and NGC 7582) present several bright 1.3 mm emitting sources over the ALMA FoV. In Sect. A we describe in detail for each source the source that we identified as the AGN. To derive the coordinates, we obtained the centroid of the source at 1.3 mm in the plane of the sky and converted the pixel position into the International Coordinate Reference System (ICRS) using the WCS header information and ASTROPY routines (Price-Whelan et al. 2018). The 1.3 mm continuum peaks are marked as a filled star in Fig. 1 and the ICRS coordinates are listed in Table A.1. We refer to Domínguez-Fernández et al. (2020) for the analysis of the 1.3 mm NOEMA maps.
3.2. CO(2–1) aperture photometry
We defined rectangular apertures to simulate the nuclear extraction aperture of the mid-IR spectra. One of the aperture sides is well defined by the mid-IR slit width (see Table 2). The majority of the ALMA and NOEMA observations have beam sizes smaller than the slit width, except in the case of NGC 1808 and NGC 1386 (see Table 3). In these two cases, the rectangular extraction apertures (see Table 5) were chosen to be close to the beam size. The other side of the rectangular aperture can be defined in principle as the angular resolution FWHM of the mid-IR observations, assuming that the mid-IR emitting continuum source was unresolved. When possible, we used square apertures, except in the cases where the slit width was larger than the angular resolution. We also defined the aperture sizes to contain entire pixels on the CO(2–1) integrated intensity maps and rotated them to the orientation of the mid-IR slits, unless they were close to PAslit = 0deg or PAslit = 90deg. The sizes of the square or rectangular apertures used for each galaxy are listed in Table 5 and are overlaid on the CO(2–1) maps in Fig. 1.
Nuclear molecular gas properties.
We performed the photometry with these square or rectangular apertures on the CO(2–1) integrated intensity maps. The CO(2–1) fluxes are listed in Table 5. The errors in these fluxes are dominated by the photometric calibration uncertainty of ALMA and NOEMA, which in band 6 is typically 10−15%.
For NGC 1068 we took the nuclear CO(2–1) flux inside the area defined by the FWHM size of the Gaussian disk (deconvolved size 0.22″ × 0.09″) derived by García-Burillo et al. (2019). Given the limited angular resolution of the ALMA CO(2–1) observations of NGC 2110 (see Rosario et al. 2019, for full details), we extracted the nuclear fluxes with a 1″ × 1″ aperture. The nuclear CO(2–1) fluxes for NGC 1320 and NGC 2992 within 0.5″ × 0.5″ apertures were provided by J. A. Fernández Ontiveros (priv. comm.).
For the CO(2–1) surface brightness profiles of NGC 5135 and NGC 7582, we followed a similar procedure as for the nuclear apertures. We extracted aperture photometry in rectangular apertures placed along the length of the mid-IR slit (plotted in the corresponding panels in Fig. 1), that is, at the PAslit value listed in Table 2. The areas used to compute the surface brightnesses are the projected areas of the simulated slits. The angular resolution of the ALMA CO(2–1) observations of NGC 7582 (0.17″ × 0.16″, see Table 3) is higher than that of the mid-IR spectroscopy and slit width. We thus smoothed the ALMA CO(2–1) image to an approximately angular resolution of 0.4–0.5″ to match that of the mid-IR observations. The synthesized beam of the ALMA observations of NGC 5135 (0.31″ × 0.22″) is relatively close to the angular resolution of the mid-IR spectroscopy (Díaz-Santos et al. 2010), and thus we did not smooth the image. In Sect. 5.2 we discuss the CO(2–1) and 11.3 μm PAH surface brightness profiles of these two galaxies.
3.3. Nuclear molecular gas masses
We used the CO(2–1) transition fluxes to estimate the bulk of the molecular gas mass in the nuclear regions of our galaxies. In using the CO(2–1) transition, which is sensitive to gas temperatures of a few tens of Kelvin and densities ∼103 cm−3, and based on our choice of the 2–1/1–0 temperature ratio (see below), we implicitly assumed that the contribution from highly excited molecular gas is small. To derive the molecular gas masses, we used the following expression derived by Sakamoto et al. (1999):
 (1)
(1)
where DL is the luminosity distance in units of Mpc, SCO(1 − −0) is the CO(1–0) transition flux in units of Jy km s−1, and XCO is the CO-to-H2 conversion factor in units of 3 × 1020 cm−2 (K km s−1)−1. We first estimated the CO(1–0) flux from our observations. We took an r21 = CO(2–1)/CO(1–0) brightness temperature ratio of one, assuming a thermally excited and optically thick gas (Braine & Combes 1992). However, we note that this ratio is rather uncertain. For instance, Papadopoulos & Seaquist (1998) found for a sample of Seyfert 1 and Seyfert 2 galaxies (typical beam sizes 32–55″) an average value of r21 = 0.7, which is lower than the typical values measured for starburst and spiral galaxies. However, these authors also pointed out that r21 is likely to become smaller for larger beam sizes because warmer gas may be more confined in the nuclear regions, including those of Seyfert galaxies (see also Rigopoulou et al. 2002; Lambrides et al. 2019). Israel (2020) compiled r21 values in the inner 22″ for a large sample of galaxies that includes seven of our targets. The r12 values range from 0.6 (NGC 5135) to 1.7 (NGC 3227), with an average value of 1.1. Therefore, the assumed value of r21 = 1 for the nuclear or circumnuclear regions of Seyfert galaxies might be a lower limit (see also Viti et al. 2014) and the estimated masses accordingly upper limits.
For the CO-to-H2 conversion factor we used the Galactic value of XCO = 2 × 1020 cm−2(K km s−1)−1 (Bolatto et al. 2013). However, we note that hydrodynamical simulations coupled with radiation transfer for clumpy torus models predict a large scatter of this factor on the nuclear scales of AGN (Wada et al. 2018), adding another source of uncertainty to the molecular mass calculation.
We list in Table 5 the molecular gas masses within the regions covered by the mid-IR slits. The molecular gas masses measured in the nuclear regions probed by the mid-IR slits in our sample span a broad range from 3 × 10⁴ M⊙ for NGC 7213 to 2 × 10⁸ M⊙ for NGC 7130. However, most have nuclear molecular gas masses in the range 106 − 108 M⊙. These values are higher than the typical values measured for tori and nuclear disks in Seyfert galaxies and low-luminosity AGN (García-Burillo et al. 2016, 2019; Alonso-Herrero et al. 2018, 2019; Combes et al. 2019). This is because the mid-IR slits cover regions a factor of a few larger than the torus diameters (10–50 pc).
4. Detection of nuclear 11.3 μm PAH emission
4.1. Dependence on molecular gas
Figure 3 (top panel) shows the distribution of molecular gas masses within the nuclear regions covered by the mid-IR slits for the full sample and for those with a nuclear detection of the 11.3 μm PAH feature.
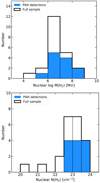 |
Fig. 3. Distributions of the nuclear molecular gas mass (top panel) and the column density averaged over the nuclear region covered by the CO(2–1) aperture photometry (bottom panel). The thick line histograms are the full sample, and the filled blue histograms show nuclei with a detection of the 11.3 μm PAH feature. |
While the ranges of molecular gas masses are similar for the two samples, the median values for galaxies with nuclear detections of the 11.3 μm PAH feature are higher (1.6 × 10⁷ M⊙) than for those without detections (2 × 10⁶ M⊙). Thus, the molecular gas mass in the nuclear regions of our sample of Seyfert galaxies does appear to have an effect on the detection of the nuclear PAH emission. A Kolmogorov-Smirnov (K-S) test indicates that there is a probability of 2% that the two distributions of cold molecular gas are drawn from the same parent population.
The nuclear mid-IR slits cover a range of physical regions from tens to hundreds of parsecs. A more appropriate quantity therefore is the molecular gas surface density, Σ H2 averaged over the nuclear region. We calculated it by dividing the molecular gas mass by the (projected) slit area for each galaxy. In none of the Seyfert galaxies in our sample with low surface densities Σ H2 < 103 M⊙ pc−2 is the 11.3 μm PAH detected in the nuclear region. On the other hand, Seyfert nuclei with a nuclear detection of the 11.3 μm PAH feature have Σ H2 > 103 M⊙ pc−2, although the reverse is not always true. The galaxies in our sample with the highest nuclear values of the H2 surface density Σ H2 ≥ 5 × 10³ M⊙ pc−2, which are Mrk 1066, NGC 1808, NGC 5643, NGC 7130, and NGC 7469, are also known to show recent (more recent than a few hundred million years) SF activity in their nuclear regions (Storchi-Bergmann et al. 2000; González Delgado et al. 2001; Davies et al. 2007). This means that the detection of the nuclear 11.3 μm PAH emission is also likely associated with this recent SF activity.
The molecular hydrogen column densities (see Fig. 3 and Table 5) range from N(H2) = 3 × 1020 cm−2 for NGC 7213 to N(H2) = 5 × 1023 cm−2 for NGC 5643, NGC 7130, and NGC 7469. We emphasize that the N(H2) values are averaged over the nuclear region. For instance, in NGC 1808 Combes et al. (2019) measured an N(H2) ten times higher from high angular resolution CO(3–2) observations. The average value for our sample is N(H2) = 2 × 1023 cm−2. This is compatible with the average values of N(H) estimated from the H2 2.12 μm line by Hicks et al. (2009). The galaxies with a nuclear 11.3 μm PAH feature have a median of N(H2) = 2 × 1023 cm−2, compared to a median of N(H2) = 4 × 1022 cm−2 for those without a detection. A K-S test indicates that there is a probability of 0.8% that the two N(H2) distributions are drawn from the same parent population. We therefore confirm previous inferences (Esquej et al. 2014; Alonso-Herrero et al. 2014) that high molecular gas column densities might play a role in protecting the PAH molecules in the nuclear regions of Seyfert galaxies.
4.2. Dependence on AGN luminosity and distance from the AGN
We investigated whether an additional dependency of the detection of nuclear PAH emission on the AGN luminosity and the distance from the AGN might be established (see also Esquej et al. 2014; Alonso-Herrero et al. 2014). Following Monfredini et al. (2019), at a given distance from the AGN (rAGN), the X-ray photon flux on a PAH molecule for a given photon energy is
 (2)
(2)
where LX is the AGN luminosity and τX is the X-ray optical depth. As discussed in Monfredini et al. (2019), we only considered the molecular gas contribution to the X-ray absorption1. This is because in the nuclear regions of AGN, the molecular gas is expected to be mostly in the plane of the nuclear disk or torus, where we assume the PAH molecules to be located as well. We show in Fig. 4 the values of the distance from the AGN as given by the ground-based mid-IR observations against the nuclear column density averaged on this region. The symbols are color-coded according to the intrinsic 2−10 keV AGN luminosity. There is little dependence of the detection of nuclear 11.3 μm PAH emission on either AGN luminosity or distance from the AGN. The median values are similar, rAGN = 32 pc and log L(2−10 keV) = 42.7 erg s−1 for the nuclei with 11.3 μm PAH detections, and rAGN = 41 pc and log L(2−10 keV) = 42.5 erg s−1 for those without detections. It thus appears that the nuclear column density plays a dominant role, although having a high column density does not imply that PAH emission is detected in the nuclear region.
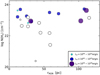 |
Fig. 4. Distance from the AGN vs. the molecular hydrogen column density for nuclear detections (filled circles) and nondetections (open circles) of the 11.3 μm PAH feature. The symbol sizes increase for increasing intrinsic AGN luminosities. |
4.3. Half-life of PAH molecules in the nuclear regions of Seyfert galaxies
In the ISM of galaxies, there is evidence that the PAH spectra are produced mostly by large molecules (see, e.g., Draine & Li 2001, and also Sect. 5.1). However, photodissociation cross-sections at hard X-ray energies have been measured only for molecules with a number of carbons 10 and 16 (Monfredini et al. 2019). Monfredini and collaborators proposed to use half-life of a particular PAH molecule as an estimate of the survival time against dissociation due to the incidence of X-ray photons,
 (3)
(3)
where σph − d is the photodissociation cross-section for a given energy E. The half-life includes the dependencies we investigated in Sect. 4.2. In other words, the half-life of a particular PAH molecule is longer at larger distances from the AGN and at higher protecting column densities, and shorter for more luminous AGN and PAHs with larger photodissociation cross-sections (Eqs. (2) and (3)). Therefore, we can test whether t1/2 is related to the nuclear detection of the 11.3 μm PAH feature. However, we note that from this experimental work, the prediction would be that in regions with little protection from molecular material most of the emission should arise from multiply ionized PAHs. Models of emission from ionized PAH molecules predict that the 11.3 μm feature is decreased relative to the emission of the 7.7 μm PAH feature, but it is not absent (Draine & Li 2001).
We chose the naphthalene molecule (C10H8) as an illustrative example to compute the half-lives of PAHs in the nuclear regions of our Seyfert galaxies. This PAH molecule among those studied by Monfredini et al. (2019) has the smallest photodissociation cross-section when exposed to hard X-ray photons at E = 2.5 keV. Thus, naphthalene provides upper limits to the half-lives (see Eq. (3)) expected in the environments of active nuclei, where the larger molecules might be common. In addition to the photodissociation cross-section of naphthalene, we used the nuclear H2 column densities (Table 5), 2−10 keV intrinsic luminosities, and distances from the AGN. The main difference with similar calculations reported by Monfredini et al. (2019) is that in our case, the column densities are measured over the same region as is probed by the ground-based mid-IR slit.
The PAH half-lives for the nuclear regions in our sample of Seyfert galaxies span a broad range (Fig. 5). Galaxies with short nuclear PAH half-lives of less than approximately 1000 yr include low-luminosity AGN with low column densities (e.g., NGC 7213) as well as luminous Seyfert galaxies without enough protecting material in their nuclear regions (NGC 7582). The longest estimated half-lives (> 106 yr) are for the low-luminosity AGN NGC 1808 (see also Monfredini et al. 2019), as well as NGC 5643, NGC 7130, and NGC 7469. These four nuclei also show the highest nuclear N(H2) values. For comparison we show the values of the PAH injection time by AGB stars into the ISM from Jones et al. (1994) and the lifetime of ∼108 yr of PAHs in the diffuse ISM (see Tielens 2013, and references therein). We note, however, that the estimated PAH lifetimes in different environments with hot gas that are exposed to X-rays can be as short as those calculated for our sample of Seyfert nuclei (Micelotta et al. 2010). However, PAH emission is detected in them, indicating that the PAH molecules are not completely destroyed.
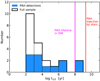 |
Fig. 5. Computed half-lives for the illustrative PAH molecule naphthalene in the nuclear regions of our Seyfert galaxies. The thick line histogram is the full sample, and the filled histogram are the galaxies with a nuclear detection of the 11.3 μm PAH feature. We indicate the typical lifetimes of PAHs in the diffuse ISM (see Tielens 2013) and the timescale for PAH injection into the ISM by evolved stars (Jones et al. 1994). |
In Seyfert nuclei without a nuclear detection of the 11.3 μm PAH feature the half-lives for the naphthalene molecule tend to be shorter than in those with nuclear detections (Fig. 5). We remark that these half-lives are only indicative of the general behavior. Observationally, they are affected by large uncertainties, especially those coming from the determination of mass of molecular hydrogen and thus the nuclear H2 column densities (Sect. 4.1). Moreover, we also used the values of N(H2) averaged over the nuclear regions. However, the nuclear regions of some galaxies contain clumps with higher column densities. We also ignored the effects of dehydrogenation of PAH molecules when exposed to X-rays2. Finally, we emphasize that we only computed the half-lives for the small PAH molecule naphthalene. We cannot rule out, however, that larger PAH molecules may behave differently upon absorption of a hard X-ray photon (see Rigopoulou et al., in prep.).
To summarize, in the majority of the nuclear regions we studied, the computed half-lives of the PAH molecule naphthalene are short compared to their formation or re-formation times, even in cases of nuclear detections of the 11.3 μm PAH feature. On the other hand, the experimental work of Monfredini et al. (2019) also showed that ionized and multiply ionized PAHs are formed when PAH molecules are exposed to hard X-ray photons. Ionized PAHs tend to show reduced but not completely absent,11.3 μm PAH emission when compared to the 7.7 μm PAH complex (see, e.g., Allamandola et al. 1999; Draine & Li 2001). Thus, even in the harsh environments of these active nuclei, the PAH molecules are not completely destroyed, and it is likely that unless the column densities are extremely high, most of the emission might be dominated by ionized PAHs.
5. Circumnuclear PAH and CO(2–1) emission
5.1. Spitzer/IRS PAH emission
In the previous section we argued that in the nuclear regions of our sample of Seyfert galaxies the PAH emission may originate preferentially from small and/or ionized PAH molecules. The exception would be nuclei with high H2 column densities, where a higher fraction of the emission would come from neutral PAHs. The f(11.3 μm)/f(7.7 μm) versus f(6.2 μm)/f(7.7 μm) PAH ratio diagram has been used to investigate the fraction of neutral and ionized PAH emission in galaxies (see, e.g., Galliano et al. 2008; Lambrides et al. 2019), including nearby Seyfert galaxies (Diamond-Stanic & Rieke 2010) and Galactic sources, by comparing with theoretical predictions for PAH molecules (see, e.g., Draine & Li 2001).
The Spitzer/IRS PAH ratios (Fig. 6) are for the central 4″ × 4″ regions (except for NGC 4253, see Sect. 2.3), which cover physical regions between ∼270 pc × 270 pc for NGC 1808 and 1.3 kpc × 1.3 kpc for IC 4518W. We excluded from this figure highly inclined galaxies (NGC 1320, NGC 1386, NGC 2992, NGC 4388, and NGC 7172) because their PAH ratios may be contaminated by emission from line-of-sight regions in their disks. For reference, galaxies not dominated by AGN emission generally exhibit PAH ratios f(6.2 μm)/f(7.7 μm) ⪆0.4 to ∼0.7 and f(11.3 μm)/f(7.7 μm)⪆0.25 to ∼0.4 (Lambrides et al. 2019). We also show PAH model tracks Rigopoulou et al., in prep.) for an interstellar radiation field (ISRF) similar to that of our Galaxy and an intense ISRF. For the Galaxy-like ISRF, we show one track for neutral PAHs and another track with a 40% fraction of ionized PAHs. The observed Spitzer/IRS PAH ratios for the majority of our sample are close to this last track and would indicate a larger fraction of the emission coming from ionized PAHs and/or a different ISRF than in purely star-forming galaxies.
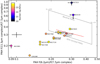 |
Fig. 6. Spitzer/IRS PAH ratios for the circumnuclear regions of the Seyfert galaxies in our sample (circles) except for those in highly inclined hosts (see text). For NGC 3081 and NGC 7213, we only obtained an upper limit for the 11.23 μm PAH. We assumed that its flux is approximately 1/4 of that of the 11.33 μm PAH, as in other type 1 Seyfert galaxies. The symbols are color-coded with the nuclear H2 column density. The plotted error bar in each direction represents the effect of a 10% uncertainty in the 7.7 μm PAH complex flux on the measured PAH ratios. The lines are PAH model tracks (Rigopoulou et al., in prep.) for molecules in a Galaxy-like ISRF (solid gray lines), an intense ISRF equivalent to ×10 000 the Galaxy (dashed red line), and numbers of carbon atoms from NC = 20 to NC = 400. For the Galaxy-like ISRF, the top line is for neutral PAHs and the bottom line for a 40% fraction of ionized PAHs. The number of carbon atoms for the PAH molecules increases from right to left. |
There is no clear dependence of the Spitzer/IRS PAH ratios on the nuclear column density (see Fig. 6). In most galaxies in our sample, the CO(2–1) and presumably the PAH emissions are not centrally peaked. Thus, the nuclear N(H2) is not representative of the column densities in the circumnuclear regions. NGC 5643 is the galaxy with the highest Spitzer/IRS PAH ratios in our sample, which would indicate a higher contribution from neutral PAHs. For this galaxy in the central 4″ × 4″, most of the CO(2–1) emission comes from the nuclear region (see Fig. 1). At the peak of the CO(2–1) emission, which is 0.2″ from the AGN position, the H2 column density is even higher (N(H2)∼7 × 1023 cm−2, see Alonso-Herrero et al. 2018) than the average value over the nuclear region. IC 4518W shows the lowest Spitzer/IRS PAH ratios. The CO(2–1) (see Fig. 1), mid-IR, and Paα morphologies over the central 4″ × 4″ of IC 4518W are complicated, showing in addition to the Sy 2 nucleus, a number of circumnuclear regions with ongoing or recent SF activity (Alonso-Herrero et al. 2006; Díaz-Santos et al. 2008; Esparza-Arredondo et al. 2018). Because the 11.3 μm PAH is not detected in the nuclear spectrum, most of the PAH emission in the Spitzer/IRS spectrum originates in the circumnuclear regions where the radiation field is thought to be intense, so that most of the emission appears to be dominated by ionized PAHs.
NGC 2110, NGC 3081, and NGC 7213 present the lowest values of the nuclear N(H2) as well as the faintest PAH emission in the Spitzer/IRS spectra (see Table 4). Figure 7 shows that NGC 2110 and NGC 7213 have similar fitted PAH spectra with faint emission from the 7.7 μm PAH complex with respect to that of the 11.3 μm PAH complex, thus suggesting some large contribution from neutral PAH. Neither galaxy appears to have strong (circum-) nuclear SF activity (Schnorr-Müller et al. 2014b,a). The CO(2–1) emitting regions are 1−2″ away from the AGN position (see Fig. 1 and Rosario et al. 2019), where the PAH molecules would be more protected from the AGN radiation. NGC 3081, on the other hand, shows a fitted PAH spectrum with a stronger 7.7 μm PAH complex compared to the 6.2 and 11.3 μm PAH, suggesting a larger contribution from ionized molecules. The CO(2–1) emitting region at ∼2″ southeast of the AGN has optical line emission excited by SF (Schnorr-Müller et al. 2016), and thus it is possible that the PAH emission is mostly originating from this region. In Fig. 6, NGC 3081 appears to be far from the PAH model tracks. However, Zhen et al. (2017, 2018) showed experimentally that singly and doubly ionized large PAH molecules show a mid-IR spectra with faint or even absent 6.2 and 11.3 μm PAH emission with respect to the 7.7 μm PAH complex.
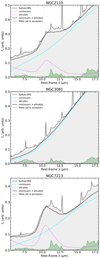 |
Fig. 7. Spitzer/IRS spectra (gray) of the three galaxies with the lowest nuclear N(H2). We show the continuum (dashed cyan lines) and silicate feature in emission (dotted magenta lines), and their sum (black line) as well as the PAH feature spectra (green curves) fitted with PAHFIT. |
5.2. Surface brightness profiles
Observationally, there appears to be a spatial correspondence between cold molecular gas as traced by CO transitions and the PAH emission based on the observed radial distributions on large scales (hundreds of parsec) in nearby disk galaxies (Regan et al. 2006; Bendo et al. 2010) and the galaxy-integrated emission of infrared luminous galaxies (Cortzen et al. 2019). Even in the powerful SF-driven outflow of M82, the PAH emission is observed to be spatially correlated with that of the CO(2–1) emission (Leroy et al. 2015).
For the two selected galaxies with extended PAH emission from ground-based observations (Sect. 3.2), we show in Fig. 8 the surface brightness profiles of the CO(2–1) emission extracted along the orientation of the mid-IR slit, that is, PAslit = 30deg for NGC 5135 and PAslit = 0deg for NGC 7582. The 11.3 μm PAH surface brightness profiles (Esparza-Arredondo et al. 2018) are also shown in arbitrary units and scaled approximately at the location of the SF rings. In these regions we expect the CO(2–1) and PAH emission to trace each other through the SF laws. For both galaxies, the CO(2–1) and 11.3 μm PAH surface brightnesses appear to be spatially correlated at projected radial distances r ⪆ 100 pc out to r ∼ 500 pc for NGC 7582 and r ⪆ 600 pc out to r ≃ 1 kpc for NGC 5135. These scales are approximately coincident with the location of the circumnuclear rings of SF, as traced by hydrogen recombination lines (see Riffel et al. 2009; Ricci et al. 2018; Alonso-Herrero et al. 2006; Bedregal et al. 2009, and also Sect. 3.1).
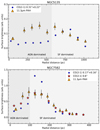 |
Fig. 8. Radial surface brightness profiles (arbitrary units) of the CO(2–1) emission (circles for the original ALMA resolution and stars for the Gaussian-smoothed image of NGC 7582) and 11.3 μm PAH emission (orange triangles, from Esparza-Arredondo et al. 2018) for NGC 5135 (top panel) and NGC 7582 (bottom panel, converted into the assumed distance in this work). The CO(2–1) radial profiles were extracted at the orientation of the mid-IR slits (see Fig. 1, Table 2, and Sect. 3.2). The large triangles indicate the nuclear 11.3 μm PAH emission measurement (see Esparza-Arredondo et al. 2018, for further details). We also show the approximate separation between AGN- and SF-dominated regions (see text for more details). |
At smaller radial distances closer to the AGN, some significant differences start to appear. The mid-IR slit of NGC 5135 was placed exactly at the orientation of the ionization cone, which extends for approximately 2″ ∼ 570 pc from the AGN mostly to the northeast (Bedregal et al. 2009). Along this direction, both the observed morphology (see Fig. 1) and the surface brightness profile compared to that of the PAH feature are suggestive of a CO(2–1) emission deficit, especially in the central 3″ ≃ 900 pc. However, the emission from the H2 2.12 μm line, high-excitation lines, and the hard X-rays peaks at the AGN position and is extended over similar physical scales in this direction (Bedregal et al. 2009; Díaz-Santos et al. 2010; Colina et al. 2012; Esparza-Arredondo et al. 2018). At projected radial distances between r ≃ 1″ ∼ 290 pc and r ≃ 2″ ≃ 580 pc, the 11.3 μm PAH emission is bright. If this region is an X-ray dominated region (XDR), then we would expect that most of the CO emission would originate from higher-J transitions (see, e.g., van der Werf et al. 2010) rather than from the CO(2–1) transition. Another possibility is that the PAH emission might additionally be excited by AGN-produced UV photons, although these regions are far from the area of influence of the AGN (Jensen et al. 2017). UV photons from nonionizing stars detected in the central ∼2″ of this galaxy (Storchi-Bergmann et al. 2000; González Delgado et al. 2001) could excite the PAH molecules but would not produce Paα emission.
The orientation of the mid-IR slit of NGC 7582 was north-south. This means that the slit was not placed along the axis of the ionization cone of this galaxy (∼225deg), although the cone is wide angled. Out to projected radial distances of r ≃ 100 pc there is an excess of 11.3 μm PAH emission when compared to that of CO(2–1), although not as pronounced as in NGC 5135. In this region of NGC 7582, the optical line ratios (Ricci et al. 2018) indicate a significant contribution from the AGN radiation field. This could explain the decreased CO(2–1) emission in this region. In the circumnuclear ring of SF, the individual regions have higher CO(2–1) fluxes and thus higher N(H2). However, the PAH molecules there are likely exposed to SF-produced UV photons, and therefore the PAH emission would have a strong component from ionized molecules, as is apparent from the Spitzer/IRS PAH ratios (see Fig. 6).
Finally, in NGC 1808, the 8.6 μm PAH emission relative to the 11.3 μm PAH emission increases at larger radial distances (r ∼ 75 pc) where there is also X-ray emission (Sales et al. 2013). While our CO(2–1) data have only moderate angular resolution, the ALMA CO(3–2) observations (Combes et al. 2019) resolved the central region in a nuclear spiral with high H2 column density at the AGN position. This would provide the molecules with sufficient shielding, resulting in photodissociation half-lives for the PAH comparable to the timescales for PAH injection into the ISM. At larger radial distances, the decreasing H2 column density would explain the observed increased fraction of emission produced by ionized PAHs.
6. Summary and prospects for JWST
We analyzed the properties of the cold molecular gas and PAH emission in the nuclear (∼24−230 pc) and circumnuclear (∼250 pc to ∼1.3 kpc scales) regions in a sample of 22 nearby Seyfert galaxies. We used ALMA and NOEMA high angular resolution observations of the CO(2–1) transition to trace the cold molecular gas, and ground-based and Spitzer/IRS mid-IR spectroscopy for the PAH emission. Out of the 22 galaxies in our sample, the 11.3 μm PAH feature was detected in the nuclear regions of 12, while PAH emission is always detected within the ∼4″ IRS apertures.
The majority of galaxies in our sample have molecular gas masses in the range 106 − 108 M⊙ over the nuclear region sampled by the ground-based mid-IR slits. These masses are higher than the typical values for nuclear disks and tori of Seyfert galaxies (Alonso-Herrero et al. 2018, 2019; Combes et al. 2019; García-Burillo et al. 2019). However, this is explained by the fact that our nuclear apertures, which were dictated by the ground-based mid-IR slits, are a factor of a few larger than the Seyfert tori. In Seyfert galaxies with a nuclear detection of the 11.3 μm PAH feature, the median values of the molecular gas masses (1.6 × 10⁷ M⊙) and H2 column densities (N(H2) = 2 × 1023 cm−2) are higher than in those without a detection. This might indicate that the molecular gas plays a role in protecting PAH molecules in these regions. Additionally, nuclei with the largest H2 surface brightnesses also host recent SF activity, which in turn might be responsible for the detection of the 11.3 μm PAH emission. Nevertheless, the nuclear column density N(H2) appears to be the dominant factor for this PAH detection when compared to the molecular gas mass, the distance from the AGN rAGN (given by half the mid-IR slit width), and the AGN luminosity.
Using the small PAH molecule naphthalene as an illustrative case, we computed its half-live when exposed to 2.5 keV hard X-ray photons in the nuclear regions of our sample. The flux of X-ray photons in turn is a function of the protecting column density N(H2), as well as rAGN and LX(AGN). Except in the cases of high column densities and/or low-luminosity AGN, the computed half-lives for naphthalene are considerably shorter than the PAH injection timescales in the ISM (∼109 yr), even for nuclei with detections of the 11.3 μm PAH feature. However, in nuclei without a 11.3 μm PAH detection, the computed half-lives are shorter than in those with a detection.
On circumnuclear scales, the observed Spitzer/IRS PAH ratios of most of the galaxies in our sample (excluding those in highly inclined galaxies) indicate a significant contribution from ionized PAHs. In general, we do not find that nuclei with the highest H2 column densities are closer to neutral PAH model tracks. The reason for this is that the majority of galaxies we studied does not show centrally peaked CO(2–1) emission, and in some of them, the brighest CO(2–1) emission traces circumnuclear sites of strong SF activity. Thus, with the Spitzer/IRS apertures we cannot easily distinguish between AGN and SF-formation dominated regions for our sample of Seyfert galaxies.
We also analyzed in detail the surface brightness profiles of the ground-based 11.3 μm PAH emission and CO(2–1) for two galaxies (NGC 5135 and NGC 7582) in our sample with circumnuclear rings of SF and ionization cones. In the rings of SF, the CO(2–1) and 11.3 μm PAH emissions trace each other spatially, as expected from SF laws. In the AGN-dominated regions of these galaxies, we detected not only emission from the 11.3 μm PAH, but also an excess with respect to that of the CO(2–1) emission. This could be due to additional excitation of the PAH molecules by AGN-produced UV photons or, more likely, to a deficit of CO(2–1) emission in these XDR.
The medium-resolution spectrograph (MRS) of the JWST Mid-Infrared Instrument (MIRI, Rieke et al. 2015; Wright et al. 2015) will provide high-sensitivity observations at angular resolutions (FWHM ∼ 0.3″ at 8 μm) similar to those of the ground-based mid-IR spectroscopic observations used in this work. Moreover, the MIRI-MRS ∼5−28 μm spectral range covers a large number of PAH features, fine-structure lines, and molecular hydrogen lines. The improved spatial resolution with respect to Spitzer/IRS (a factor of ten) will allow a better estimate of the AGN continuum, for instance, by comparing the nuclear emission with predictions from clumpy torus models. Moreover, using different combinations of fine-structure lines observed with MIRI-MRS, it will be possible to separate AGN-dominated and SF-dominated regions in nearby Seyfert galaxies. In AGN-dominated regions with low H2 column densities it should be possible to detect a decreasing ionized PAH fraction at increasing distances from the AGN. Spatially resolved MIRI-MRS observations can be used to determine differences in the ionized PAH spectra in AGN and star-forming regions. In nuclear regions with high column densities and/or low-luminosity AGN, we predict an increased fraction of emission from neutral PAHs (e.g., the nuclei of NGC 1808 and NGC 5643). The mid-IR rotational H2 lines will provide independent estimates of the masses and column densities of the warm molecular gas and avoid the uncertainties of the CO-to-H2 conversion factors near AGN.
Then it can be expressed in terms of the X-ray photoabsorption cross-section σH(E) and the H2 column density as τX = 2 σH(E) N(H2).
Although these effects have not been studied observationally in AGN, predictions from density functional theory calculations indicate that the most noticeable changes would be around the 3.3 μm PAH region and the 20−30 μm region (Buragohain et al. 2018).
Acknowledgments
We thank an anonymous referee for providing comments that helped improve the paper. We are grateful to J. A. Fernández Ontiveros for providing us with ALMA measurements for two galaxies in our sample prior to publication. AA-H and SG-B acknowledge support through grant PGC2018-094671-B-I00 (MCIU/AEI/FEDER,UE). AA-H and MP-S work was done under project No. MDM-2017-0737 Unidad de Excelencia “María de Maeztu”- Centro de Astrobiología (INTA-CSIC). MPS acknowledges support from the Comunidad de Madrid, Spain, through Atracción de Talento Investigador Grant 2018-T1/TIC-11035. DRi acknowledges support from the University of Oxford John Fell Fund. DRi and IGB acknowledge support from STFC through grant ST/S000488/1. CRA and SGB acknowledge support from grant AYA2016-76682-C3-2-P (MCIU/AEI/FEDER,UE). TDS acknowledges support from the CASSACA and CONICYT fund CAS-CONICYT Call 2018. DE-A acknowledges support from a CONACYT scholarship. DE-A and OG-M acknowledge support from UNAM PAPIIT project IA103118. OG-M acknowledge financial support of the UNAM PAPIIT project IN105720. SFH was supported by the EU Horizon 2020 framework program via the ERC Starting Grant DUST-IN-THE-WIND (ERC-2015-StG-677117). CRA also acknowledges support from the Spanish Ministry of Science, Innovation and Universities under grant with reference RYC-2014-15779. DRo acknowledges the support of the UK Science and Technology Facilities Council (STFC) through grant ST/L00075X/1. This paper makes use of the following ALMA data: listed in Table 3. ALMA is a partnership of ESO (representing its member states), NSF (USA) and NINS (Japan), together with NRC (Canada), MOST and ASIAA (Taiwan), and KASI (Republic of Korea), in cooperation with the Republic of Chile. The Joint ALMA Observatory is operated by ESO, AUI/NRAO and NAOJ. This work is based on observations carried out under project numbers listed in Table 3 with the IRAM NOEMA Interferometer. IRAM is supported by INSU/CNRS (France), MPG (Germany) and IGN (Spain). This work is based [in part] on archival data obtained with the Spitzer Space Telescope, which is operated by the Jet Propulsion Laboratory, California Institute of Technology under a contract with NASA. Support for this work was provided by NASA. This research has made use of the NASA/IPAC Extragalactic Database (NED), which is operated by the Jet Propulsion Laboratory, California Institute of Technology, under contract with the National Aeronautics and Space Administration.
References
- Alexander, D. M., & Hickox, R. C. 2012, New Astron. Rev., 56, 93 [NASA ADS] [CrossRef] [Google Scholar]
- Allamandola, L. J., Hudgins, D. M., & Sandford, S. A. 1999, ApJ, 511, L115 [NASA ADS] [CrossRef] [PubMed] [Google Scholar]
- Alonso-Herrero, A., Rieke, G. H., Rieke, M. J., et al. 2006, ApJ, 650, 835 [NASA ADS] [CrossRef] [Google Scholar]
- Alonso-Herrero, A., Sánchez-Portal, M., Ramos Almeida, C., et al. 2012, MNRAS, 425, 311 [NASA ADS] [CrossRef] [Google Scholar]
- Alonso-Herrero, A., Ramos Almeida, C., Esquej, P., et al. 2014, MNRAS, 443, 2766 [NASA ADS] [CrossRef] [Google Scholar]
- Alonso-Herrero, A., Esquej, P., Roche, P. F., et al. 2016, MNRAS, 455, 563 [NASA ADS] [CrossRef] [Google Scholar]
- Alonso-Herrero, A., Pereira-Santaella, M., García-Burillo, S., et al. 2018, ApJ, 859, 144 [Google Scholar]
- Alonso-Herrero, A., García-Burillo, S., Pereira-Santaella, M., et al. 2019, A&A, 628, A65 [NASA ADS] [CrossRef] [EDP Sciences] [Google Scholar]
- Bedregal, A. G., Colina, L., Alonso-Herrero, A., & Arribas, S. 2009, ApJ, 698, 1852 [NASA ADS] [CrossRef] [Google Scholar]
- Bendo, G. J., Wilson, C. D., Warren, B. E., et al. 2010, MNRAS, 402, 1409 [NASA ADS] [CrossRef] [Google Scholar]
- Bolatto, A. D., Wolfire, M., & Leroy, A. K. 2013, ARA&A, 51, 207 [Google Scholar]
- Braine, J., & Combes, F. 1992, A&A, 264, 433 [NASA ADS] [Google Scholar]
- Bransford, M. A., Appleton, P. N., Heisler, C. A., Norris, R. P., & Marston, A. P. 1998, ApJ, 497, 133 [NASA ADS] [CrossRef] [Google Scholar]
- Briggs, S. J. 1995, PhD thesis, New Mexico Institute of Mining and Technology [Google Scholar]
- Brightman, M., & Nandra, K. 2011, MNRAS, 413, 1206 [CrossRef] [Google Scholar]
- Buragohain, M., Pathak, A., Sarre, P., & Gour, N. K. 2018, MNRAS, 474, 4594 [CrossRef] [Google Scholar]
- Clavel, J., Schulz, B., Altieri, B., et al. 2000, A&A, 357, 839 [NASA ADS] [Google Scholar]
- Colina, L., Alberdi, A., Torrelles, J. M., Panagia, N., & Wilson, A. S. 2001, ApJ, 553, L19 [NASA ADS] [CrossRef] [Google Scholar]
- Colina, L., Pereira-Santaella, M., Alonso-Herrero, A., Bedregal, A. G., & Arribas, S. 2012, ApJ, 749, 116 [Google Scholar]
- Combes, F., García-Burillo, S., Audibert, A., et al. 2019, A&A, 623, A79 [NASA ADS] [CrossRef] [EDP Sciences] [Google Scholar]
- Comerón, S., Knapen, J. H., Beckman, J. E., et al. 2010, MNRAS, 402, 2462 [NASA ADS] [CrossRef] [Google Scholar]
- Condon, J. J., Helou, G., Sanders, D. B., & Soifer, B. T. 1996, ApJS, 103, 81 [NASA ADS] [CrossRef] [Google Scholar]
- Cortzen, I., Garrett, J., Magdis, G., et al. 2019, MNRAS, 482, 1618 [CrossRef] [Google Scholar]
- Davies, R. I., Müller Sánchez, F., Genzel, R., et al. 2007, ApJ, 671, 1388 [NASA ADS] [CrossRef] [Google Scholar]
- de Vaucouleurs, G., de Vaucouleurs, A., Corwin, Jr., H. G., et al. 1991, Third Reference Catalogue of Bright Galaxies [Google Scholar]
- Diamond-Stanic, A. M., & Rieke, G. H. 2010, ApJ, 724, 140 [NASA ADS] [CrossRef] [Google Scholar]
- Diamond-Stanic, A. M., & Rieke, G. H. 2012, ApJ, 746, 168 [Google Scholar]
- Díaz-Santos, T., Alonso-Herrero, A., Colina, L., Ryder, S. D., & Knapen, J. H. 2007, ApJ, 661, 149 [NASA ADS] [CrossRef] [Google Scholar]
- Díaz-Santos, T., Alonso-Herrero, A., Colina, L., et al. 2008, ApJ, 685, 211 [NASA ADS] [CrossRef] [Google Scholar]
- Díaz-Santos, T., Alonso-Herrero, A., Colina, L., et al. 2010, ApJ, 711, 328 [NASA ADS] [CrossRef] [Google Scholar]
- Domínguez-Fernández, A. J., Alonso-Herrero, A., García-Burillo, S., et al. 2020, A&A, accepted https://doi.org/10.1051/0004-6361/201936961 [Google Scholar]
- Draine, B. T., & Li, A. 2001, ApJ, 551, 807 [NASA ADS] [CrossRef] [Google Scholar]
- Elitzur, M., & Shlosman, I. 2006, ApJ, 648, L101 [NASA ADS] [CrossRef] [Google Scholar]
- Esparza-Arredondo, D., González-Martín, O., Dultzin, D., et al. 2018, ApJ, 859, 124 [CrossRef] [Google Scholar]
- Esquej, P., Alonso-Herrero, A., González-Martín, O., et al. 2014, ApJ, 780, 86 [Google Scholar]
- Galliano, E., Alloin, D., Pantin, E., Lagage, P. O., & Marco, O. 2005, A&A, 438, 803 [NASA ADS] [CrossRef] [EDP Sciences] [Google Scholar]
- Galliano, F., Madden, S. C., Tielens, A. G. G. M., Peeters, E., & Jones, A. P. 2008, ApJ, 679, 310 [NASA ADS] [CrossRef] [Google Scholar]
- Gallimore, J. F., Yzaguirre, A., Jakoboski, J., et al. 2010, ApJS, 187, 172 [NASA ADS] [CrossRef] [Google Scholar]
- García-Bernete, I., Ramos Almeida, C., Acosta-Pulido, J. A., et al. 2015, MNRAS, 449, 1309 [CrossRef] [Google Scholar]
- García-Burillo, S., Combes, F., Ramos Almeida, C., et al. 2016, ApJ, 823, L12 [NASA ADS] [CrossRef] [Google Scholar]
- García-Burillo, S., Combes, F., Ramos Almeida, C., et al. 2019, A&A, 632, A61 [CrossRef] [EDP Sciences] [Google Scholar]
- González Delgado, R. M., Heckman, T., Leitherer, C., et al. 1998, ApJ, 505, 174 [NASA ADS] [CrossRef] [Google Scholar]
- González Delgado, R. M., Heckman, T., & Leitherer, C. 2001, ApJ, 546, 845 [NASA ADS] [CrossRef] [Google Scholar]
- González-Martín, O., Rodríguez-Espinosa, J. M., Díaz-Santos, T., et al. 2013, A&A, 553, A35 [NASA ADS] [CrossRef] [EDP Sciences] [Google Scholar]
- Hicks, E. K. S., Davies, R. I., Malkan, M. A., et al. 2009, ApJ, 696, 448 [NASA ADS] [CrossRef] [Google Scholar]
- Hönig, S. F. 2019, ApJ, 884, 171 [NASA ADS] [CrossRef] [Google Scholar]
- Hönig, S. F., Kishimoto, M., Gandhi, P., et al. 2010, A&A, 515, A23 [NASA ADS] [CrossRef] [EDP Sciences] [Google Scholar]
- Hopkins, P. F., & Quataert, E. 2010, MNRAS, 407, 1529 [NASA ADS] [CrossRef] [Google Scholar]
- Houck, J. R., Roellig, T. L., van Cleve, J., et al. 2004, ApJS, 154, 18 [NASA ADS] [CrossRef] [Google Scholar]
- Israel, F. P. 2020, A&A, 635, A131 [CrossRef] [EDP Sciences] [Google Scholar]
- Izumi, T., Kawakatu, N., & Kohno, K. 2016, ApJ, 827, 81 [NASA ADS] [CrossRef] [Google Scholar]
- Jensen, J. J., Hönig, S. F., Rakshit, S., et al. 2017, MNRAS, 470, 3071 [CrossRef] [Google Scholar]
- Jones, A. P., Tielens, A. G. G. M., Hollenbach, D. J., & McKee, C. F. 1994, ApJ, 433, 797 [NASA ADS] [CrossRef] [Google Scholar]
- Kawakatu, N., & Wada, K. 2008, ApJ, 681, 73 [NASA ADS] [CrossRef] [Google Scholar]
- Koss, M., Trakhtenbrot, B., Ricci, C., et al. 2017, ApJ, 850, 74 [NASA ADS] [CrossRef] [Google Scholar]
- Lambrides, E. L., Petric, A. O., Tchernyshyov, K., Zakamska, N. L., & Watts, D. J. 2019, MNRAS, 487, 1823 [CrossRef] [Google Scholar]
- Lebouteiller, V., Barry, D. J., Spoon, H. W. W., et al. 2011, ApJS, 196, 8 [NASA ADS] [CrossRef] [Google Scholar]
- Leroy, A. K., Walter, F., Martini, P., et al. 2015, ApJ, 814, 83 [NASA ADS] [CrossRef] [Google Scholar]
- Marinucci, A., Bianchi, S., Nicastro, F., Matt, G., & Goulding, A. D. 2012, ApJ, 748, 130 [NASA ADS] [CrossRef] [Google Scholar]
- Mason, R. E., Geballe, T. R., Packham, C., et al. 2006, ApJ, 640, 612 [NASA ADS] [CrossRef] [Google Scholar]
- Mason, R. E., Levenson, N. A., Shi, Y., et al. 2009, ApJ, 693, L136 [NASA ADS] [CrossRef] [Google Scholar]
- McMullin, J. P., Waters, B., Schiebel, D., Young, W., & Golap, K. 2007, in Astronomical Data Analysis Software and Systems XVI, eds. R. A. Shaw, F. Hill, & D. J. Bell, ASP Conf. Ser., 376, 127 [Google Scholar]
- Micelotta, E. R., Jones, A. P., & Tielens, A. G. G. M. 2010, A&A, 510, A37 [NASA ADS] [CrossRef] [EDP Sciences] [Google Scholar]
- Monfredini, T., Quitián-Lara, H. M., Fantuzzi, F., et al. 2019, MNRAS, 488, 451 [CrossRef] [Google Scholar]
- Mundell, C. G., Ferruit, P., Nagar, N., & Wilson, A. S. 2009, ApJ, 703, 802 [NASA ADS] [CrossRef] [Google Scholar]
- Ossenkopf, V., Henning, T., & Mathis, J. S. 1992, A&A, 261, 567 [NASA ADS] [Google Scholar]
- Papadopoulos, P. P., & Seaquist, E. R. 1998, ApJ, 492, 521 [NASA ADS] [CrossRef] [Google Scholar]
- Pasetto, A., González-Martín, O., Esparza-Arredondo, D., et al. 2019, ApJ, 872, 69 [NASA ADS] [CrossRef] [Google Scholar]
- Peeters, E., Spoon, H. W. W., & Tielens, A. G. G. M. 2004, ApJ, 613, 986 [NASA ADS] [CrossRef] [Google Scholar]
- Pereira-Santaella, M., Alonso-Herrero, A., Rieke, G. H., et al. 2010, ApJS, 188, 447 [NASA ADS] [CrossRef] [Google Scholar]
- Pereira-Santaella, M., Alonso-Herrero, A., Santos-Lleo, M., et al. 2011, A&A, 535, A93 [NASA ADS] [CrossRef] [EDP Sciences] [Google Scholar]
- Phillips, M. M. 1979, ApJ, 227, L121 [NASA ADS] [CrossRef] [Google Scholar]
- Phillips, M. M., Charles, P. A., & Baldwin, J. A. 1983, ApJ, 266, 485 [NASA ADS] [CrossRef] [Google Scholar]
- Price-Whelan, A. M., Sipocz, B. M., Günther, H. M., et al. 2018, AJ, 156, 123 [NASA ADS] [CrossRef] [Google Scholar]
- Ramakrishnan, V., Nagar, N. M., Finlez, C., et al. 2019, MNRAS, 487, 444 [NASA ADS] [CrossRef] [Google Scholar]
- Ramos Almeida, C., & Ricci, C. 2017, Nat. Astron., 1, 679 [NASA ADS] [CrossRef] [Google Scholar]
- Ramos Almeida, C., Alonso-Herrero, A., Esquej, P., et al. 2014, MNRAS, 445, 1130 [NASA ADS] [CrossRef] [Google Scholar]
- Regan, M. W., Thornley, M. D., Vogel, S. N., et al. 2006, ApJ, 652, 1112 [NASA ADS] [CrossRef] [Google Scholar]
- Ricci, C., Trakhtenbrot, B., Koss, M. J., et al. 2017, ApJS, 233, 17 [NASA ADS] [CrossRef] [Google Scholar]
- Ricci, T. V., Steiner, J. E., May, D., Garcia-Rissmann, A., & Menezes, R. B. 2018, MNRAS, 473, 5334 [CrossRef] [Google Scholar]
- Rieke, G. H., Wright, G. S., Böker, T., et al. 2015, PASP, 127, 584 [NASA ADS] [CrossRef] [Google Scholar]
- Riffel, R. A., Storchi-Bergmann, T., Dors, O. L., & Winge, C. 2009, MNRAS, 393, 783 [NASA ADS] [CrossRef] [Google Scholar]
- Rigopoulou, D., Kunze, D., Lutz, D., Genzel, R., & Moorwood, A. F. M. 2002, A&A, 389, 374 [NASA ADS] [CrossRef] [EDP Sciences] [Google Scholar]
- Roche, P. F., Aitken, D. K., Smith, C. H., & Ward, M. J. 1991, MNRAS, 248, 606 [NASA ADS] [CrossRef] [Google Scholar]
- Rosario, D. J., Togi, A., Burtscher, L., et al. 2019, ApJ, 875, L8 [Google Scholar]
- Sabatini, G., Gruppioni, C., Massardi, M., et al. 2018, MNRAS, 476, 5417 [CrossRef] [Google Scholar]
- Sakamoto, K., Okumura, S. K., Ishizuki, S., & Scoville, N. Z. 1999, ApJS, 124, 403 [NASA ADS] [CrossRef] [Google Scholar]
- Salak, D., Nakai, N., Hatakeyama, T., & Miyamoto, Y. 2016, ApJ, 823, 68 [NASA ADS] [CrossRef] [Google Scholar]
- Sales, D. A., Pastoriza, M. G., Riffel, R., & Winge, C. 2013, MNRAS, 429, 2634 [CrossRef] [Google Scholar]
- Schnorr-Müller, A., Storchi-Bergmann, T., Nagar, N. M., et al. 2014a, MNRAS, 437, 1708 [NASA ADS] [CrossRef] [Google Scholar]
- Schnorr-Müller, A., Storchi-Bergmann, T., Nagar, N. M., & Ferrari, F. 2014b, MNRAS, 438, 3322 [NASA ADS] [CrossRef] [Google Scholar]
- Schnorr-Müller, A., Storchi-Bergmann, T., Robinson, A., Lena, D., & Nagar, N. M. 2016, MNRAS, 457, 972 [NASA ADS] [CrossRef] [Google Scholar]
- Shipley, H. V., Papovich, C., Rieke, G. H., Brown, M. J. I., & Moustakas, J. 2016, ApJ, 818, 60 [NASA ADS] [CrossRef] [Google Scholar]
- Siebenmorgen, R., Krügel, E., & Spoon, H. W. W. 2004, A&A, 414, 123 [NASA ADS] [CrossRef] [EDP Sciences] [Google Scholar]
- Smith, J. D. T., Armus, L., Dale, D. A., et al. 2007a, PASP, 119, 1133 [NASA ADS] [CrossRef] [Google Scholar]
- Smith, J. D. T., Draine, B. T., Dale, D. A., et al. 2007b, ApJ, 656, 770 [NASA ADS] [CrossRef] [Google Scholar]
- Storchi-Bergmann, T., Raimann, D., Bica, E. L. D., & Fraquelli, H. A. 2000, ApJ, 544, 747 [NASA ADS] [CrossRef] [Google Scholar]
- Thean, A., Pedlar, A., Kukula, M. J., Baum, S. A., & O’Dea, C. P. 2000, MNRAS, 314, 573 [Google Scholar]
- Tielens, A. G. G. M. 2013, Rev. Mod. Phys., 85, 1021 [NASA ADS] [CrossRef] [Google Scholar]
- van der Werf, P. P., Isaak, K. G., Meijerink, R., et al. 2010, A&A, 518, L42 [NASA ADS] [CrossRef] [EDP Sciences] [Google Scholar]
- Veron-Cetty, M. P., & Veron, P. 1985, A&A, 145, 425 [Google Scholar]
- Véron-Cetty, M. P., & Véron, P. 2006, A&A, 455, 773 [NASA ADS] [CrossRef] [EDP Sciences] [Google Scholar]
- Viti, S., García-Burillo, S., Fuente, A., et al. 2014, A&A, 570, A28 [NASA ADS] [CrossRef] [EDP Sciences] [Google Scholar]
- Voit, G. M. 1991, ApJ, 379, 122 [NASA ADS] [CrossRef] [Google Scholar]
- Voit, G. M. 1992, MNRAS, 258, 841 [NASA ADS] [CrossRef] [Google Scholar]
- Vollmer, B., Beckert, T., & Davies, R. I. 2008, A&A, 491, 441 [NASA ADS] [CrossRef] [EDP Sciences] [Google Scholar]
- Wada, K., Fukushige, R., Izumi, T., & Tomisaka, K. 2018, ApJ, 852, 88 [NASA ADS] [CrossRef] [Google Scholar]
- Wold, M., & Galliano, E. 2006, MNRAS, 369, L47 [NASA ADS] [Google Scholar]
- Wright, G. S., Wright, D., Goodson, G. B., et al. 2015, PASP, 127, 595 [NASA ADS] [CrossRef] [Google Scholar]
- Wu, Y., Charmandaris, V., Huang, J., Spinoglio, L., & Tommasin, S. 2009, ApJ, 701, 658 [NASA ADS] [CrossRef] [Google Scholar]
- Xie, Y., & Ho, L. C. 2019, ApJ, 884, 136 [CrossRef] [Google Scholar]
- Zhao, Y., Lu, N., Xu, C. K., et al. 2016, ApJ, 820, 118 [Google Scholar]
- Zhen, J., Castellanos, P., Bouwman, J., Linnartz, H., & Tielens, A. G. G. M. 2017, ApJ, 836, 28 [NASA ADS] [CrossRef] [Google Scholar]
- Zhen, J., Candian, A., Castellanos, P., et al. 2018, ApJ, 854, 27 [NASA ADS] [CrossRef] [Google Scholar]
Appendix A: ALMA 1.3 mm continuum of individual sources
As explained in Sect. 3.1, we used the ALMA 1.3 mm continuum peaks (see Table A.1) to identify the AGN positions. Six galaxies have only one peak in the field of view, and the peak coordinates agree well with the radio peaks listed in the literature as follows: IC 4518W in Condon et al. (1996), NGC 1386 and NGC 7172 in Thean et al. (2000), and NGC 7213 in Bransford et al. (1998). NGC 3227 and NGC 5643 are discussed in detail in Alonso-Herrero et al. (2019) and Alonso-Herrero et al. (2018), respectively. The remaining seven show several peaks in the ALMA 1.3 mm continuum maps and are discussed below.
ALMA 1.3 mm continuum observations.
NGC 1365 – This Seyfert 1.8 galaxy has a bright circumnuclear ring of SF in the central 20″ (≃2 kpc). Figure A.1 shows the 1.3 mm continuum map with a field of view of 25″ × 25″ where several sources are identified with mid-IR sources (Galliano et al. 2005; Alonso-Herrero et al. 2012). However, at the AGN location, which is located approximately 0.4″ west and 7.1″ south of the M4 source (Alonso-Herrero et al. 2012), the 1.3 mm emission is faint. The coordinates of the 1.3 mm continuum peak (see Table A.1) agree with those measured from the ALMA 850 μm continuum peak (Combes et al. 2019). In the central 4″ × 4″ ≃ 400 pc × 400 pc there is faint 1.3 mm emission at the AGN position, although it does not coincide with any of the central peaks detected in the CO(2–1) integrated emission map.
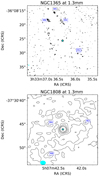 |
Fig. A.1. Large-scale ALMA 1.3 mm continuum emission maps of NGC 1365 with a field of view of 25″×25″ (upper panel) and NGC 1808 with a field of view of 15″×15″ (lower panel). The contours are shown in a linear scale. The filled cyan ellipses represent the synthesized beam sizes and orientations. We show the tentative identification of some mid-IR emitting sources detected by Galliano et al. (2005). |
NGC 1808 – This galaxy is a hot-spot galaxy (see, e.g., Galliano et al. 2005) classified as a low-luminosity Seyfert galaxy. The 1.3 mm continuum continuum sources in the central 15″ ≃ 1 kpc (see Fig. A.1) are associated with the AGN and other hot-spot sources detected in the ALMA 100–115 GHz continuum map (Salak et al. 2016) and in the mid-IR (Galliano et al. 2005). The brightest 1.3 mm source corresponds to the AGN position. In the central 4″ × 4″ ≃ 270 pc × 270 pc region (see Fig. A.2), the only 1.3 mm source is the AGN, and its coordinates (Table A.1) agree well with those derived by Combes et al. (2019). The peak of the 1.3 mm continuum does not coincide with the peak of the CO(2–1) emission at the resolution we worked with.
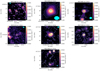 |
Fig. A.2. ALMA maps of the 1.3 mm continuum emission with a field of view of 4″×4″ as in Fig. 1 for the targets with several continuum sources that are discussed in this Appendix. The contours are shown in a linear scale. The filled star marks the AGN position, and the cyan filled ellipses are the synthesized beams. |
NGC 3081 – The 1.3 mm continuum map shows two bright peaks of similar flux (see Fig. A.2) in the central 4″ × 4″ ≃ 715 pc × 715 pc. The coordinates of the northern source (Table A.1) are approximately coincident with the 8.4 GHz radio continuum source (Mundell et al. 2009) and the kinematical center of the CO(2–1) velocity field (see Ramakrishnan et al. 2019). Thus, we assume that it corresponds to the AGN. The 1.3 mm southern source is located approximately 2″ from the AGN. None of the two 1.3 mm peaks coincides with the CO(2–1) peaks in the central 4″ × 4″ (Figs. 1 and A.2).
NGC 5135 – This Seyfert 2 galaxy is also classified as a luminous infrared galaxy (LIRG) and shows strong SF activity in the central 10″ ≃ 2.9 kpc. There is a bright unresolved source, which is identified as the AGN position, surrounded by several star clusters (Alonso-Herrero et al. 2006). The ALMA band 6 observations used in this work were discussed in detail by Sabatini et al. (2018). The authors identified source A (see coordinates in Table A.1) as the AGN position. In the CO(2–1) map the AGN location does not coincide with any of the bright peaks.
NGC 7130 – This is a Seyfert 2 galaxy classified as a LIRG with a nuclear (inner 1−2″ ≃ 300−600 pc) starburst (González Delgado et al. 1998; Alonso-Herrero et al. 2006; Díaz-Santos et al. 2010). At 1.3 mm and 434 μm (see Zhao et al. 2016) there are two sources separated by approximately 0.4″ (120 pc). The northwestern source is the brightest. However, neither coincides with the radio emission peak at 2.3 GHz. The radio peak is closer to the southeastern source (see Table A.1). We therefore assume that it coincides approximately with the AGN position.
NGC 7469 – This galaxy is classified as a Seyfert 1.5 and also shows a bright circumnuclear SF ring in the central 4″ × 4″ ≃ 1180 pc × 1180 pc. The 1.3 mm continuum map shows a bright nuclear source associated with the AGN as well as several sources (see Fig. A.2) associated with the SF ring (Colina et al. 2001; Díaz-Santos et al. 2007). The continuum peak does not coincide with the nuclear CO(2–1) regions that appear to have the morphology of a mini-spiral (see Fig. 1).
NGC 7582 – This Seyfert galaxy shows broad lines in near-infrared hydrogen recombination lines. It presents a circumnuclear ring of SF with an approximate radius of 2″ with bright emitting regions (Wold & Galliano 2006; Riffel et al. 2009). The AGN is detected at 1.3 mm. Over the central 4″ × 4″ ∼ 350 pc × 350 pc, the continuum and CO(2–1) regions in the ring are bright (see Fig. A.2). At the AGN location, we do not detect a compact CO(2–1) emitting region, although there is significant emission there (see Sect. 3.2).
All Tables
All Figures
|
Fig. 1. Maps of the integrated CO(2–1) emission (in a linear scale in units of Jy km s−1 beam−1 marked with the color bar on the right-hand side of each panel) showing the central 4″×4″ regions that are approximately covered by the Spitzer/IRS SL observations. We do not plot the actual orientation of the IRS slits. The NOEMA CO(2–1) maps (Mrk 1066, NGC 2273, NGC 4253, NGC 4388, and NGC 7465) were constructed using a 3σ detection threshold (see Domínguez-Fernández et al. 2020), whereas the ALMA CO(2–1) maps with 4σ, and 2σ detection thresholds (see text for details). The pixels with no detected CO(2–1) emission below the defined thresholds are shown in gray. The contours are also shown on a linear scale. The filled star marks the location of the 1.3 mm continuum peak assumed to be the AGN location (see Sect. 3.1 and Table A.1 for full details). The filled cyan ellipses display the synthesized beam (size and PA) of the observations for each galaxy (see Table 3). For each galaxy, the cyan square is the aperture used to extract the nuclear CO(2–1) fluxes and simulates the mid-IR nuclear slit. The distance from the AGN value rAGN is computed as half of the ground-based slit width. The size of the latter is also indicated in parsecs for each galaxy. For NGC 5135 and NGC 7582, the dashed lines are the slit orientation to indicate the direction of the surface brightness profile extraction. |
| In the text | |
|
Fig. 1. continued. |
| In the text | |
|
Fig. 2. Observed Spitzer/IRS spectrum (in gray) of NGC 7469. We show the continuum (dashed cyan line) and silicate feature in emission (dotted magenta line) and their sum (black line), as well as the PAH feature spectra (green curve) fit with PAHFIT. We also show the fit PAH feature spectrum (blue and purple curve) when PAHFIT fit was run without the silicate feature in emission. Both the f(11.3 μm)/f(7.7 μm) and f(6.2 μm)/f(7.7 μm) PAH ratios are noticeably lower when the fit includes a component with the silicate feature in emission. |
| In the text | |
|
Fig. 3. Distributions of the nuclear molecular gas mass (top panel) and the column density averaged over the nuclear region covered by the CO(2–1) aperture photometry (bottom panel). The thick line histograms are the full sample, and the filled blue histograms show nuclei with a detection of the 11.3 μm PAH feature. |
| In the text | |
|
Fig. 4. Distance from the AGN vs. the molecular hydrogen column density for nuclear detections (filled circles) and nondetections (open circles) of the 11.3 μm PAH feature. The symbol sizes increase for increasing intrinsic AGN luminosities. |
| In the text | |
|
Fig. 5. Computed half-lives for the illustrative PAH molecule naphthalene in the nuclear regions of our Seyfert galaxies. The thick line histogram is the full sample, and the filled histogram are the galaxies with a nuclear detection of the 11.3 μm PAH feature. We indicate the typical lifetimes of PAHs in the diffuse ISM (see Tielens 2013) and the timescale for PAH injection into the ISM by evolved stars (Jones et al. 1994). |
| In the text | |
|
Fig. 6. Spitzer/IRS PAH ratios for the circumnuclear regions of the Seyfert galaxies in our sample (circles) except for those in highly inclined hosts (see text). For NGC 3081 and NGC 7213, we only obtained an upper limit for the 11.23 μm PAH. We assumed that its flux is approximately 1/4 of that of the 11.33 μm PAH, as in other type 1 Seyfert galaxies. The symbols are color-coded with the nuclear H2 column density. The plotted error bar in each direction represents the effect of a 10% uncertainty in the 7.7 μm PAH complex flux on the measured PAH ratios. The lines are PAH model tracks (Rigopoulou et al., in prep.) for molecules in a Galaxy-like ISRF (solid gray lines), an intense ISRF equivalent to ×10 000 the Galaxy (dashed red line), and numbers of carbon atoms from NC = 20 to NC = 400. For the Galaxy-like ISRF, the top line is for neutral PAHs and the bottom line for a 40% fraction of ionized PAHs. The number of carbon atoms for the PAH molecules increases from right to left. |
| In the text | |
|
Fig. 7. Spitzer/IRS spectra (gray) of the three galaxies with the lowest nuclear N(H2). We show the continuum (dashed cyan lines) and silicate feature in emission (dotted magenta lines), and their sum (black line) as well as the PAH feature spectra (green curves) fitted with PAHFIT. |
| In the text | |
|
Fig. 8. Radial surface brightness profiles (arbitrary units) of the CO(2–1) emission (circles for the original ALMA resolution and stars for the Gaussian-smoothed image of NGC 7582) and 11.3 μm PAH emission (orange triangles, from Esparza-Arredondo et al. 2018) for NGC 5135 (top panel) and NGC 7582 (bottom panel, converted into the assumed distance in this work). The CO(2–1) radial profiles were extracted at the orientation of the mid-IR slits (see Fig. 1, Table 2, and Sect. 3.2). The large triangles indicate the nuclear 11.3 μm PAH emission measurement (see Esparza-Arredondo et al. 2018, for further details). We also show the approximate separation between AGN- and SF-dominated regions (see text for more details). |
| In the text | |
|
Fig. A.1. Large-scale ALMA 1.3 mm continuum emission maps of NGC 1365 with a field of view of 25″×25″ (upper panel) and NGC 1808 with a field of view of 15″×15″ (lower panel). The contours are shown in a linear scale. The filled cyan ellipses represent the synthesized beam sizes and orientations. We show the tentative identification of some mid-IR emitting sources detected by Galliano et al. (2005). |
| In the text | |
|
Fig. A.2. ALMA maps of the 1.3 mm continuum emission with a field of view of 4″×4″ as in Fig. 1 for the targets with several continuum sources that are discussed in this Appendix. The contours are shown in a linear scale. The filled star marks the AGN position, and the cyan filled ellipses are the synthesized beams. |
| In the text | |
Current usage metrics show cumulative count of Article Views (full-text article views including HTML views, PDF and ePub downloads, according to the available data) and Abstracts Views on Vision4Press platform.
Data correspond to usage on the plateform after 2015. The current usage metrics is available 48-96 hours after online publication and is updated daily on week days.
Initial download of the metrics may take a while.