Free Access
Fig. 7.
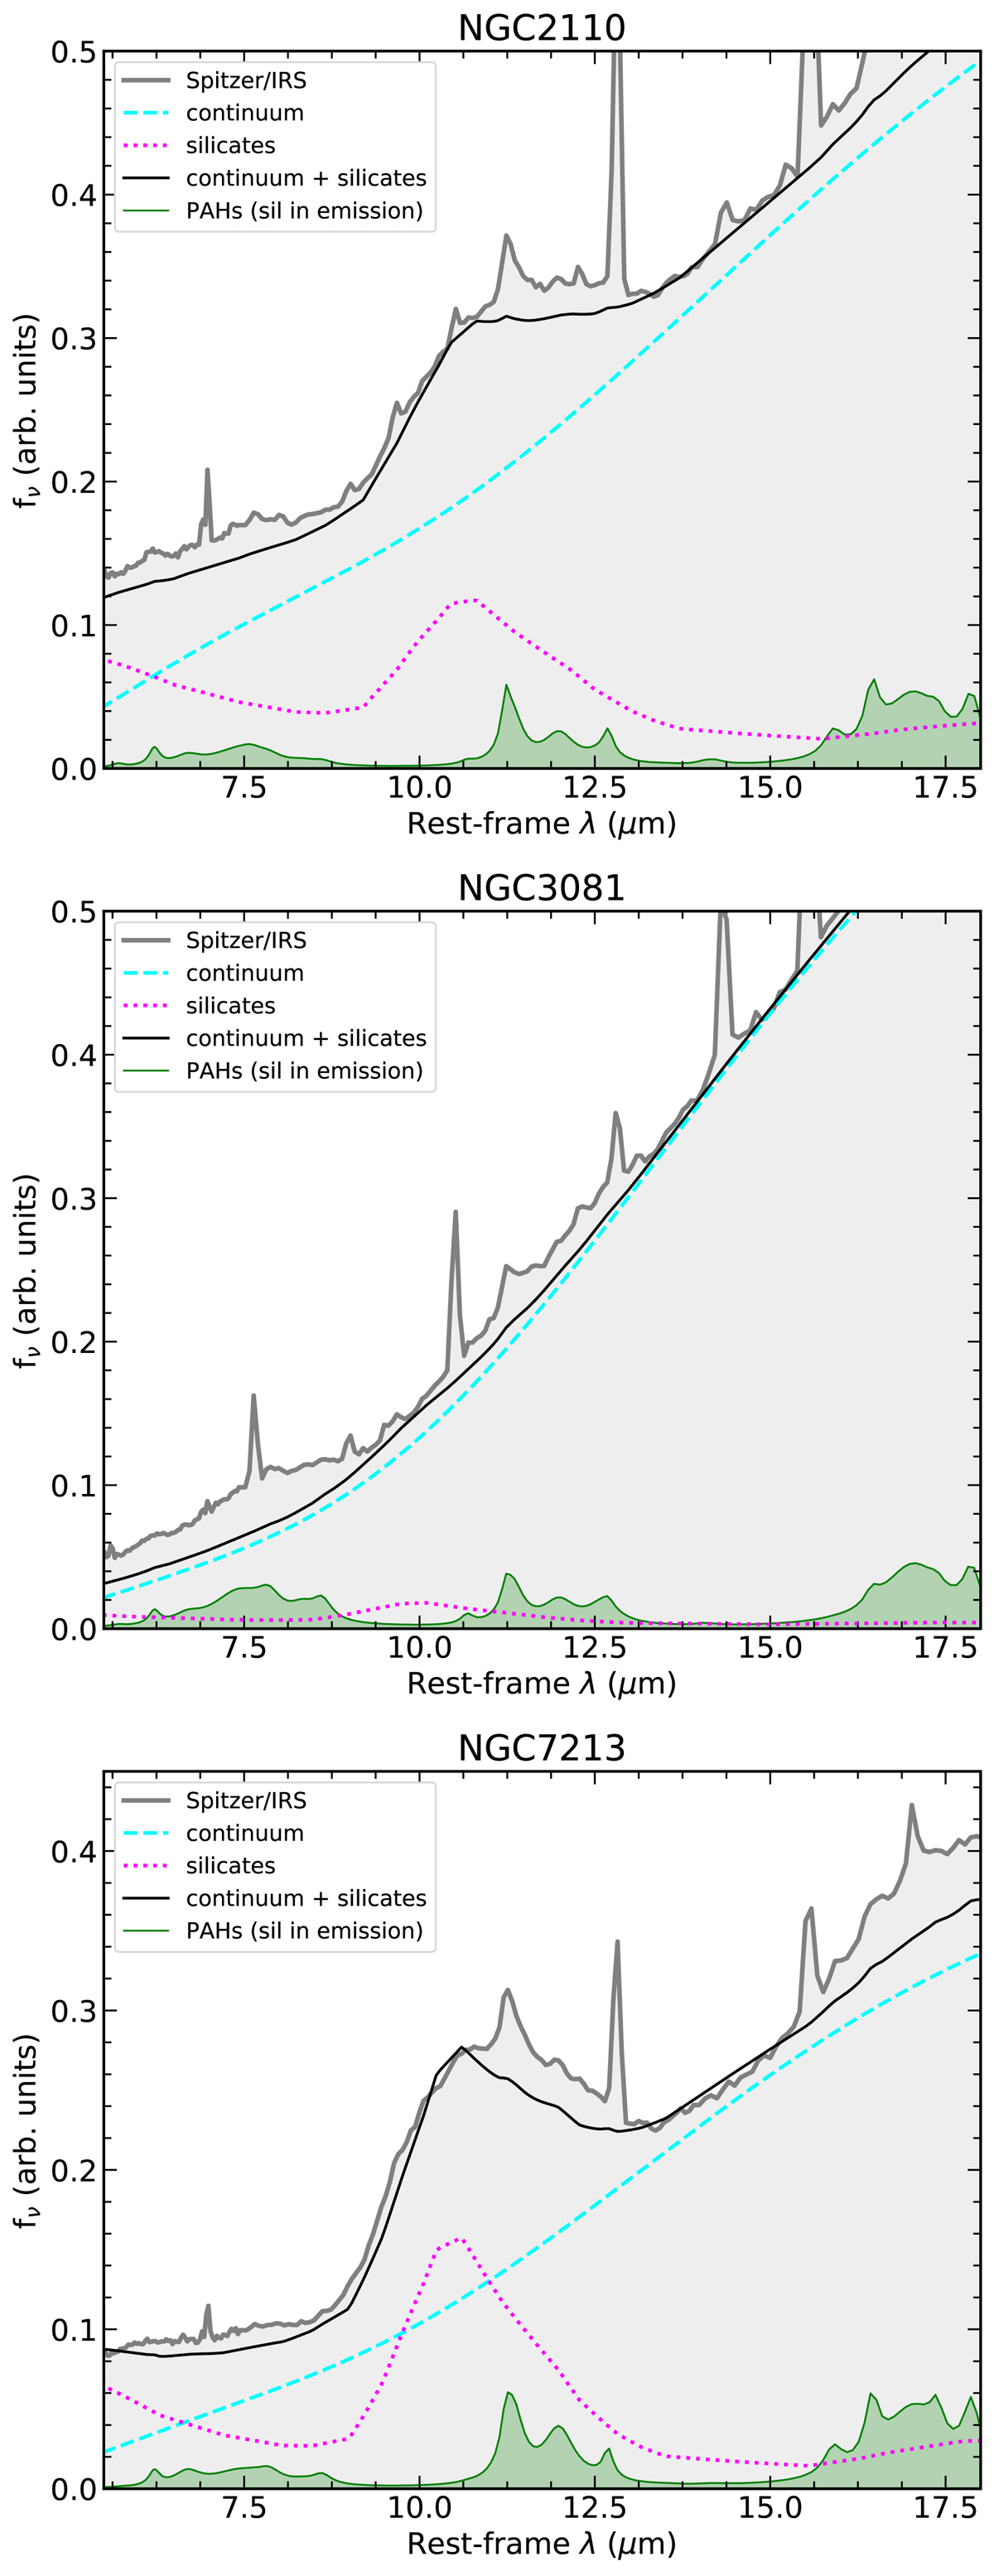
Spitzer/IRS spectra (gray) of the three galaxies with the lowest nuclear N(H2). We show the continuum (dashed cyan lines) and silicate feature in emission (dotted magenta lines), and their sum (black line) as well as the PAH feature spectra (green curves) fitted with PAHFIT.
Current usage metrics show cumulative count of Article Views (full-text article views including HTML views, PDF and ePub downloads, according to the available data) and Abstracts Views on Vision4Press platform.
Data correspond to usage on the plateform after 2015. The current usage metrics is available 48-96 hours after online publication and is updated daily on week days.
Initial download of the metrics may take a while.