Free Access
Fig. 3.
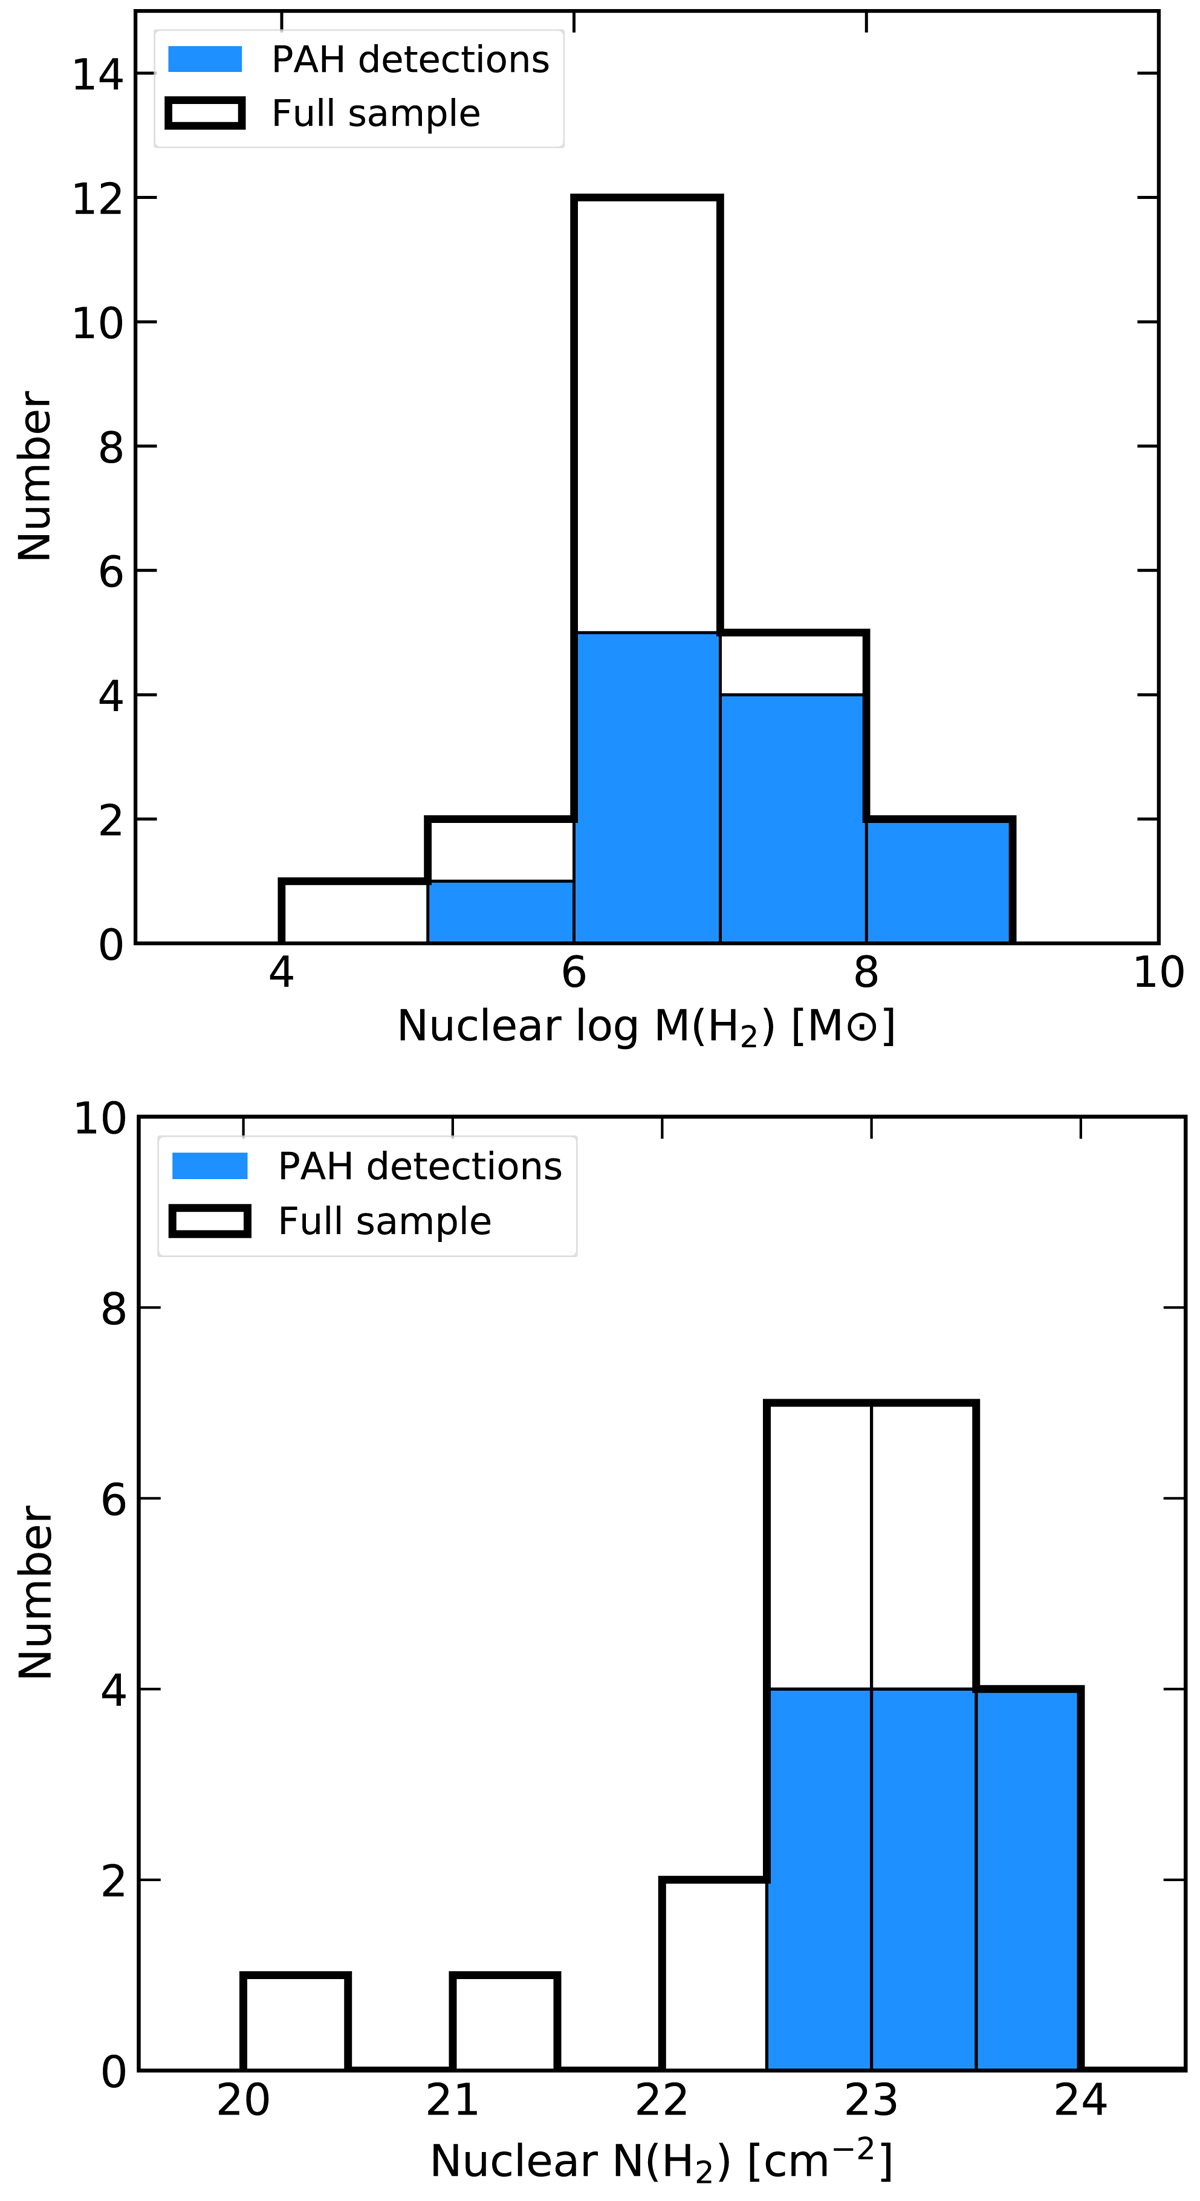
Distributions of the nuclear molecular gas mass (top panel) and the column density averaged over the nuclear region covered by the CO(2–1) aperture photometry (bottom panel). The thick line histograms are the full sample, and the filled blue histograms show nuclei with a detection of the 11.3 μm PAH feature.
Current usage metrics show cumulative count of Article Views (full-text article views including HTML views, PDF and ePub downloads, according to the available data) and Abstracts Views on Vision4Press platform.
Data correspond to usage on the plateform after 2015. The current usage metrics is available 48-96 hours after online publication and is updated daily on week days.
Initial download of the metrics may take a while.