Fig. 8.
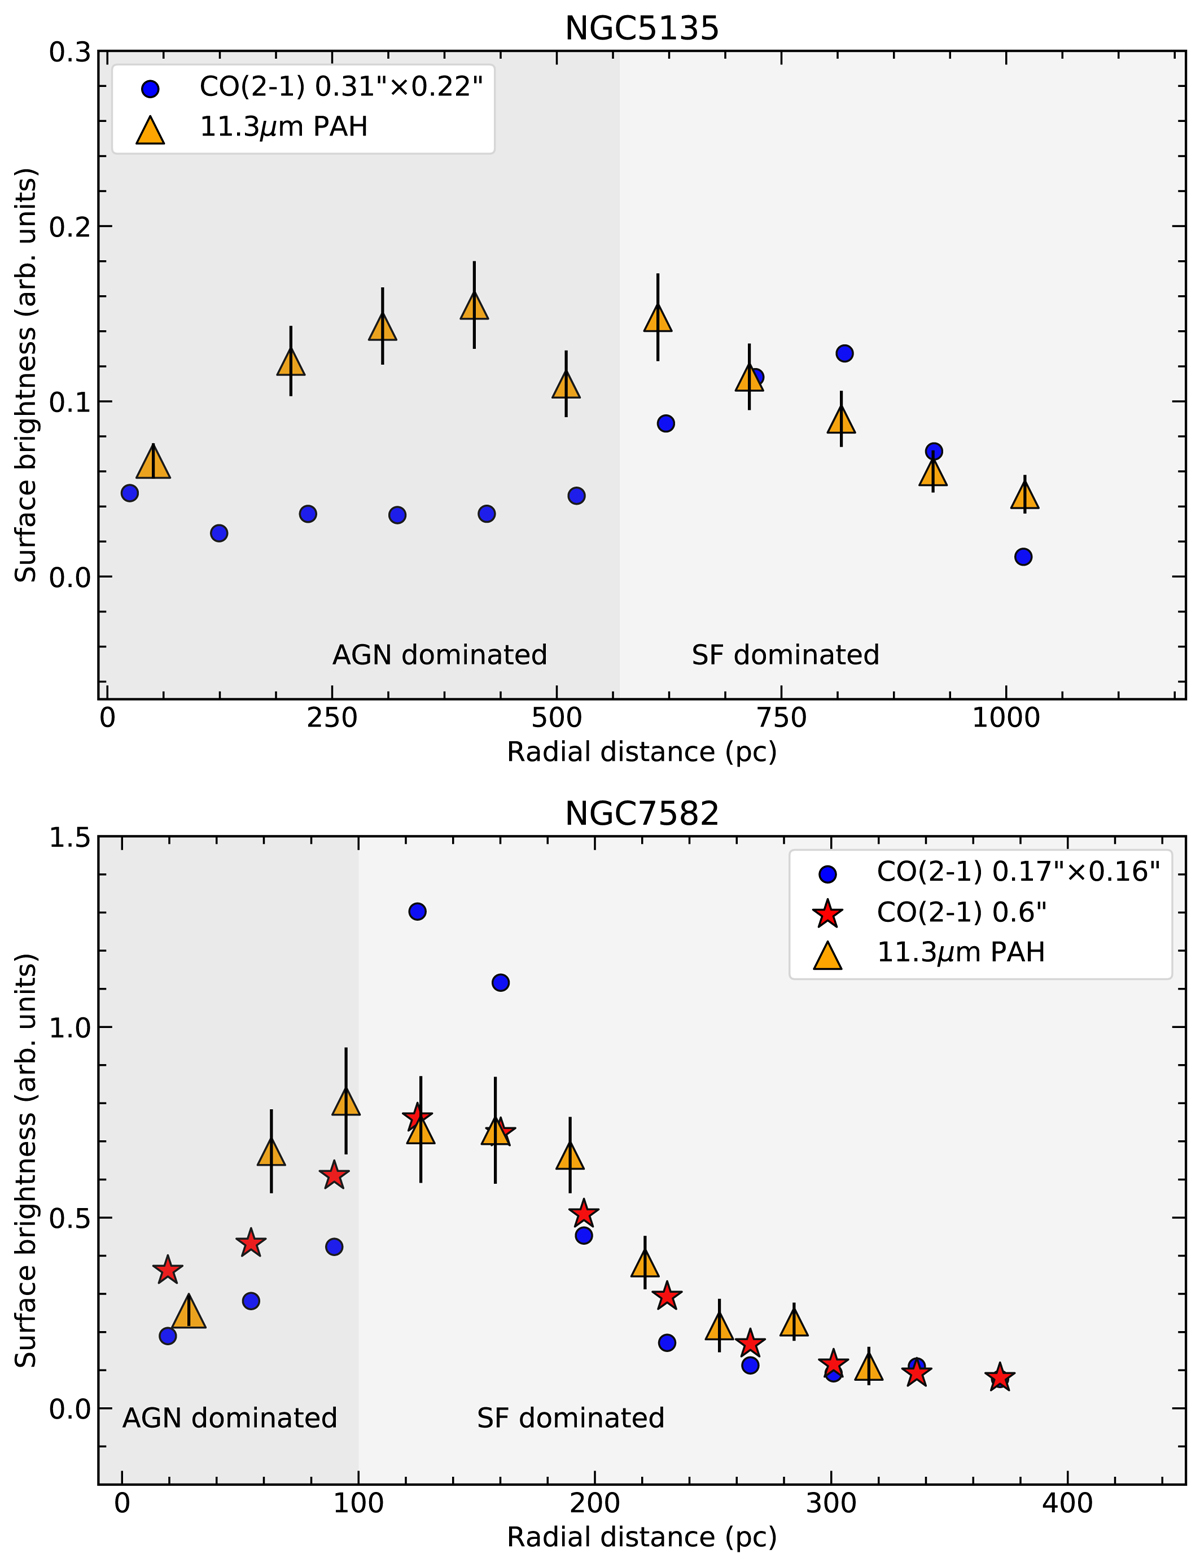
Radial surface brightness profiles (arbitrary units) of the CO(2–1) emission (circles for the original ALMA resolution and stars for the Gaussian-smoothed image of NGC 7582) and 11.3 μm PAH emission (orange triangles, from Esparza-Arredondo et al. 2018) for NGC 5135 (top panel) and NGC 7582 (bottom panel, converted into the assumed distance in this work). The CO(2–1) radial profiles were extracted at the orientation of the mid-IR slits (see Fig. 1, Table 2, and Sect. 3.2). The large triangles indicate the nuclear 11.3 μm PAH emission measurement (see Esparza-Arredondo et al. 2018, for further details). We also show the approximate separation between AGN- and SF-dominated regions (see text for more details).
Current usage metrics show cumulative count of Article Views (full-text article views including HTML views, PDF and ePub downloads, according to the available data) and Abstracts Views on Vision4Press platform.
Data correspond to usage on the plateform after 2015. The current usage metrics is available 48-96 hours after online publication and is updated daily on week days.
Initial download of the metrics may take a while.