Fig. 1.
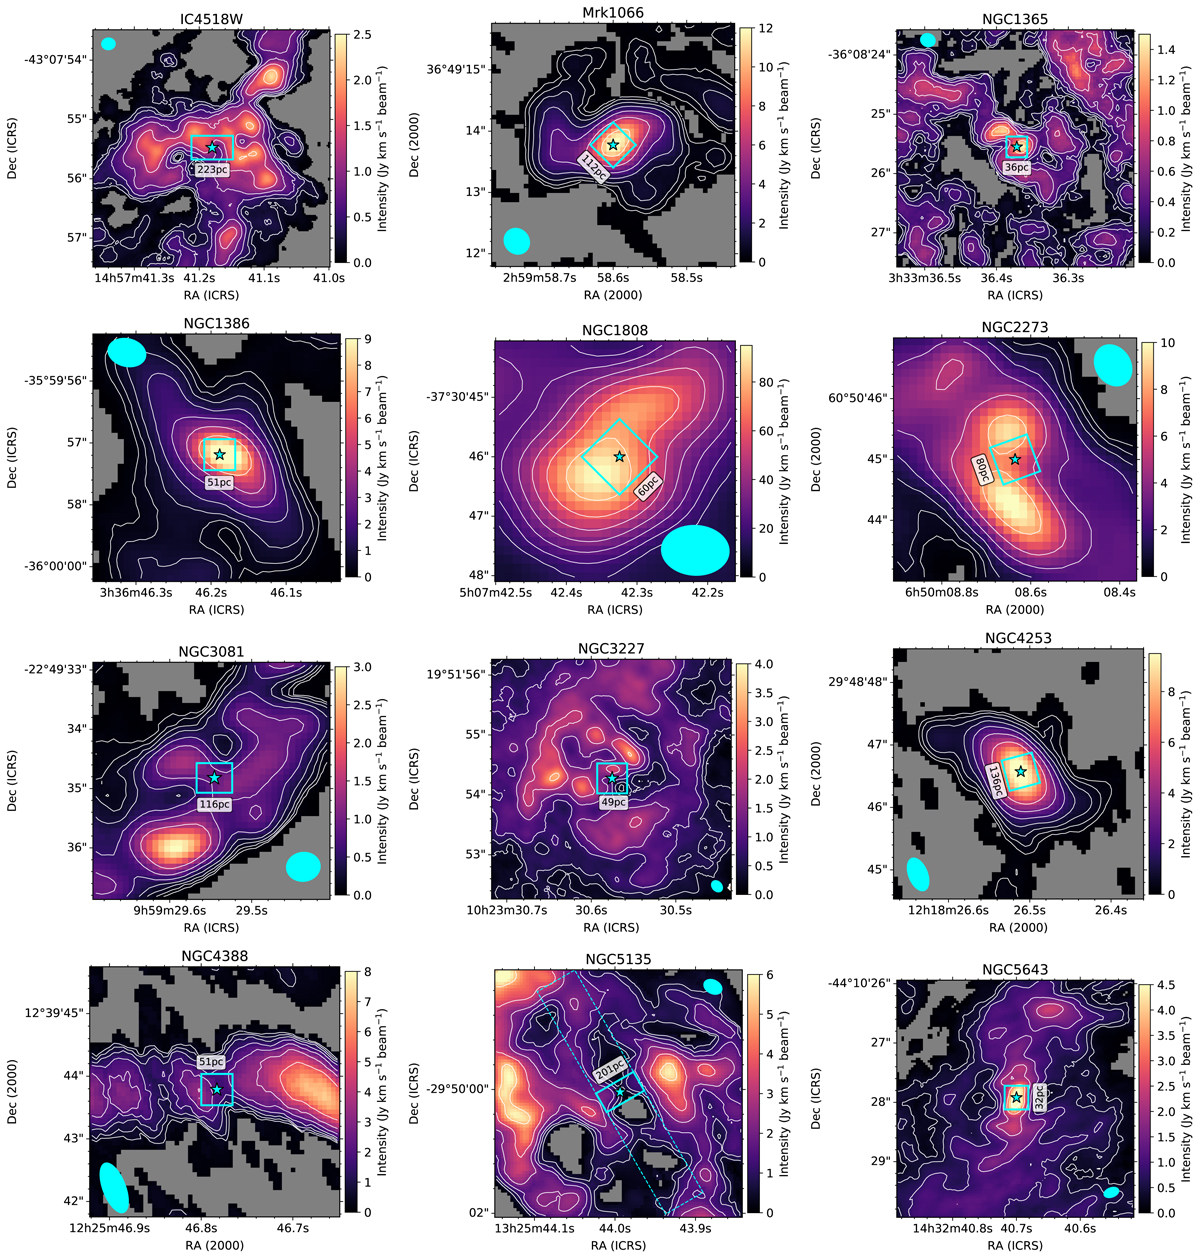
Maps of the integrated CO(2–1) emission (in a linear scale in units of Jy km s−1 beam−1 marked with the color bar on the right-hand side of each panel) showing the central 4″×4″ regions that are approximately covered by the Spitzer/IRS SL observations. We do not plot the actual orientation of the IRS slits. The NOEMA CO(2–1) maps (Mrk 1066, NGC 2273, NGC 4253, NGC 4388, and NGC 7465) were constructed using a 3σ detection threshold (see Domínguez-Fernández et al. 2020), whereas the ALMA CO(2–1) maps with 4σ, and 2σ detection thresholds (see text for details). The pixels with no detected CO(2–1) emission below the defined thresholds are shown in gray. The contours are also shown on a linear scale. The filled star marks the location of the 1.3 mm continuum peak assumed to be the AGN location (see Sect. 3.1 and Table A.1 for full details). The filled cyan ellipses display the synthesized beam (size and PA) of the observations for each galaxy (see Table 3). For each galaxy, the cyan square is the aperture used to extract the nuclear CO(2–1) fluxes and simulates the mid-IR nuclear slit. The distance from the AGN value rAGN is computed as half of the ground-based slit width. The size of the latter is also indicated in parsecs for each galaxy. For NGC 5135 and NGC 7582, the dashed lines are the slit orientation to indicate the direction of the surface brightness profile extraction.
Current usage metrics show cumulative count of Article Views (full-text article views including HTML views, PDF and ePub downloads, according to the available data) and Abstracts Views on Vision4Press platform.
Data correspond to usage on the plateform after 2015. The current usage metrics is available 48-96 hours after online publication and is updated daily on week days.
Initial download of the metrics may take a while.