Free Access
Fig. A.2.
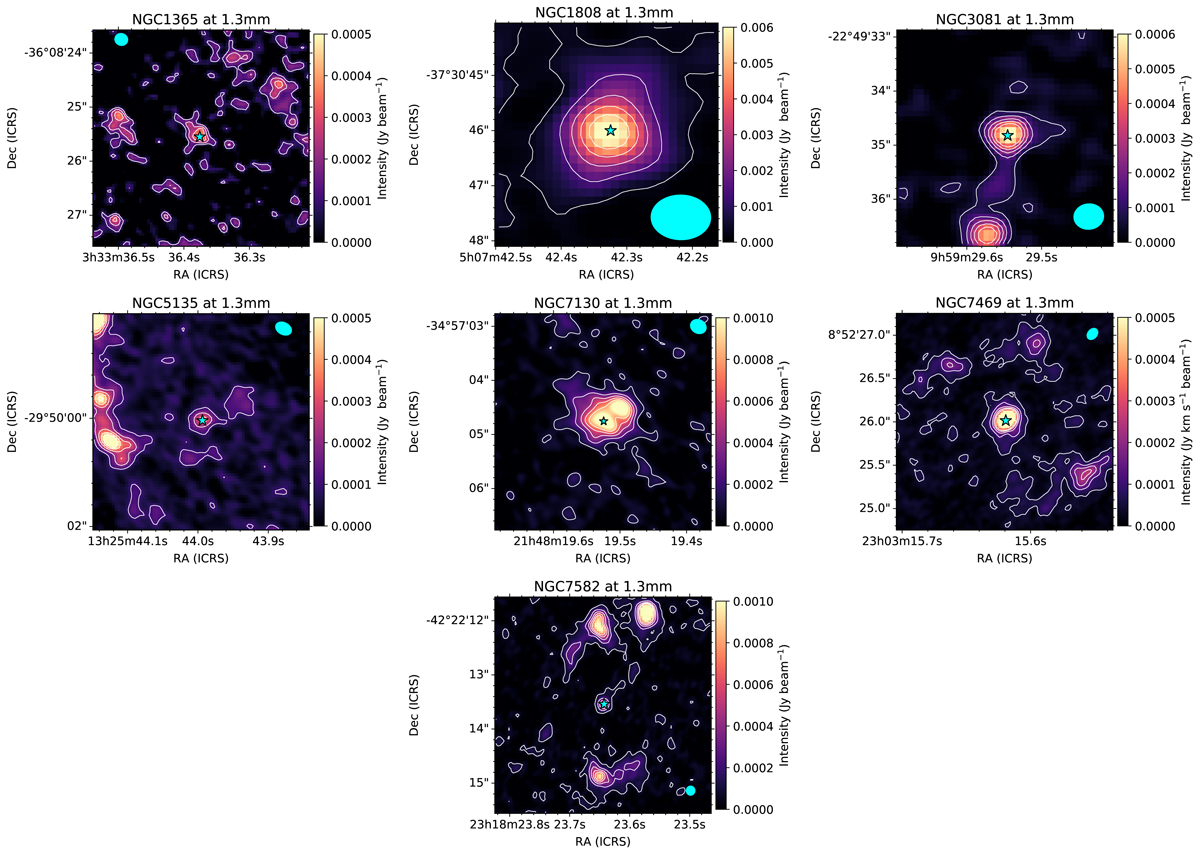
ALMA maps of the 1.3 mm continuum emission with a field of view of 4″×4″ as in Fig. 1 for the targets with several continuum sources that are discussed in this Appendix. The contours are shown in a linear scale. The filled star marks the AGN position, and the cyan filled ellipses are the synthesized beams.
Current usage metrics show cumulative count of Article Views (full-text article views including HTML views, PDF and ePub downloads, according to the available data) and Abstracts Views on Vision4Press platform.
Data correspond to usage on the plateform after 2015. The current usage metrics is available 48-96 hours after online publication and is updated daily on week days.
Initial download of the metrics may take a while.