Fig. 2.
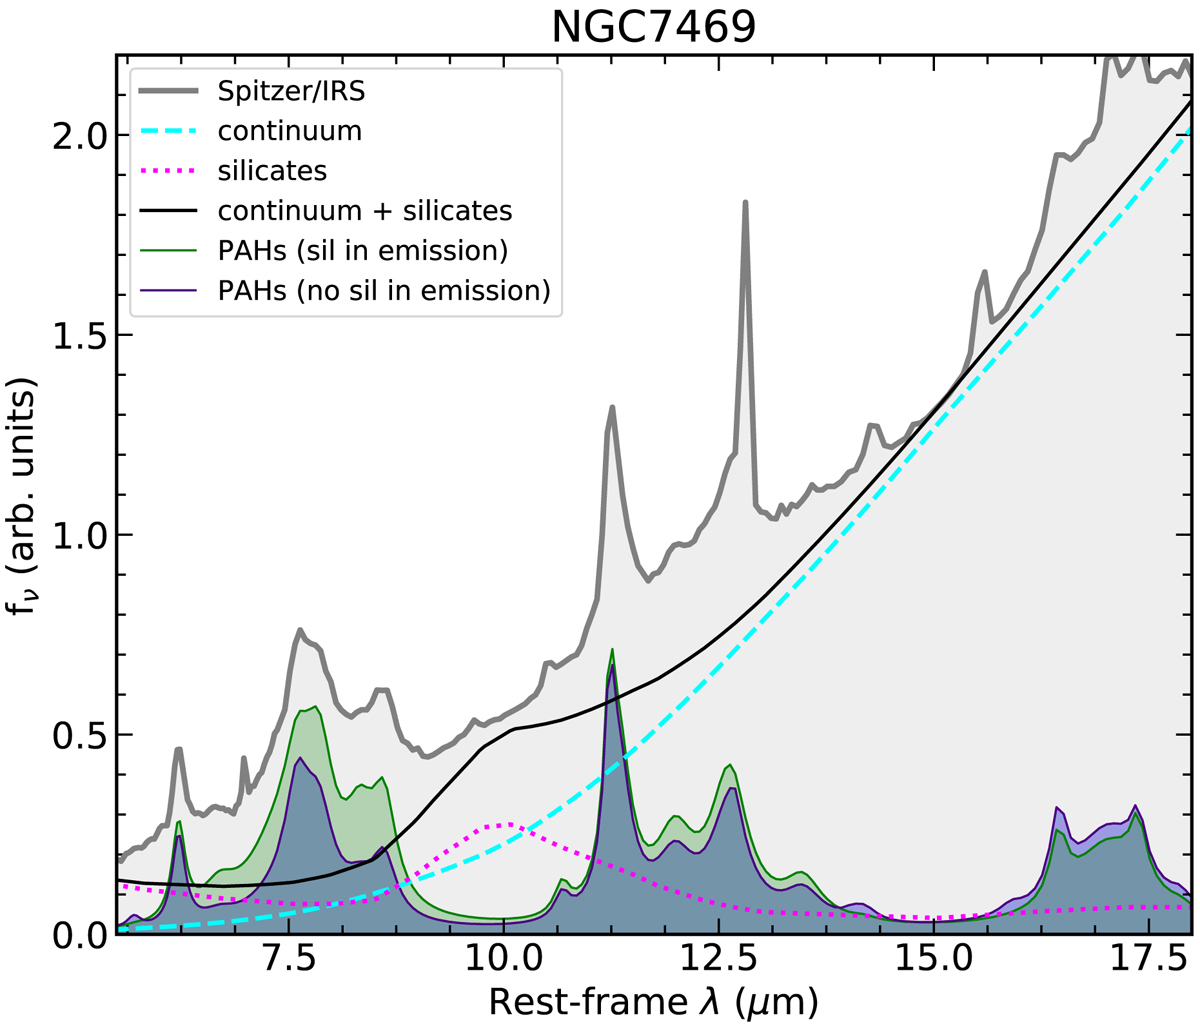
Observed Spitzer/IRS spectrum (in gray) of NGC 7469. We show the continuum (dashed cyan line) and silicate feature in emission (dotted magenta line) and their sum (black line), as well as the PAH feature spectra (green curve) fit with PAHFIT. We also show the fit PAH feature spectrum (blue and purple curve) when PAHFIT fit was run without the silicate feature in emission. Both the f(11.3 μm)/f(7.7 μm) and f(6.2 μm)/f(7.7 μm) PAH ratios are noticeably lower when the fit includes a component with the silicate feature in emission.
Current usage metrics show cumulative count of Article Views (full-text article views including HTML views, PDF and ePub downloads, according to the available data) and Abstracts Views on Vision4Press platform.
Data correspond to usage on the plateform after 2015. The current usage metrics is available 48-96 hours after online publication and is updated daily on week days.
Initial download of the metrics may take a while.