| Issue |
A&A
Volume 638, June 2020
|
|
|---|---|---|
| Article Number | A64 | |
| Number of page(s) | 16 | |
| Section | Galactic structure, stellar clusters and populations | |
| DOI | https://doi.org/10.1051/0004-6361/202037689 | |
| Published online | 11 June 2020 | |
Trans-iron Ge, As, Se, and heavier elements in the dwarf metal-poor stars HD 19445, HD 84937, HD 94028, HD 140283, and HD 160617⋆
1
SETI Institute, 189 Bernardo Ave. Suite 200, Mountain View, CA 94043, USA
e-mail: This email address is being protected from spambots. You need JavaScript enabled to view it.
2
Universidade de São Paulo, IAG, Rua do Matão 1226, Cidade Universitária, 05508-900 São Paulo, Brazil
3
GEPI, Observatoire de Paris, PSL Research University, CNRS, Place Jules Janssen, 92190 Meudon, France
Received:
7
February
2020
Accepted:
2
March
2020
Abstract
Context. The spectra of unevolved metal-poor halo stars uniquely reflect the elemental abundances incorporated during the earliest Galactic epoch. Their heavy-element content is well understood as the products of neutron capture on iron-peak elements. However, for the lightest trans-iron elements with atomic number 30 < Z < 52, they show striking abundance patterns that defy model predictions. Understanding their sources may illuminate the diverse halo, thick disk, or extragalactic origins of metal-poor stars.
Aims. The primary goal is the derivation of halo dwarf abundances and their uncertainties for six trans-iron elements from UV spectra, plus optical abundances for four additional trans-Fe elements and two well-understood heavier elements.
Methods. For five metal-poor dwarfs, we analyzed high-resolution UV spectra from the Hubble Space Telescope Imaging Spectrograph, supplemented by archival optical echelle spectra. Two independent analyses adopted different programs, models, and line lists, clarifying systematic errors.
Results. The results from the separate UV analyses are in good agreement. The largest source of discrepancy is the placement of the UV continuum. Once rectified, the separate results agree to 0.2 dex for moderately unblended, moderately strong lines. Similar agreement is found with previous works, except where new data and line selection become important, notably our exclusion of trans-Fe lines blended by newly identifed Fe I lines.
Conclusions. Improved line lists lead to low As/Ge ratios that no longer require an early arsenic enhancement. All five stars exhibit a high Mo/Ge abundance ratio, independent of Mo/Fe. The trans-Fe elements show an odd-even effect: an odd-Z element abundance is depressed relative to those of adjacent even-Z elements. Its suggested metallicity dependence is supported by previous studies of Sr-Y-Zr. Some theoretical yields show a metallicity-dependent odd-even effect, but none have predicted a constant Mo/Ge abundance ratio. Our work thus highlights the complexity of predicting the production of light trans-Fe elements in metal-poor stars.
Key words: stars: abundances / stars: Population II / nuclear reactions / nucleosynthesis / abundances / Galaxy: abundances / Galaxy: halo
Based on observational programs listed in the Acknowledgements.
© R. C. Peterson et al. 2020
 Open Access article, published by EDP Sciences, under the terms of the Creative Commons Attribution License (https://creativecommons.org/licenses/by/4.0), which permits unrestricted use, distribution, and reproduction in any medium, provided the original work is properly cited.
1. Introduction
The assembly sequence of our Galactic halo is encoded in spectra of its surviving low-metallicity turnoff stars, the unevolved stellar survivors from the earliest epochs whose elemental abundance ratios reflect the nucleosynthesis processes and the nature of the stars creating them. As reviewed by Sneden et al. (2008), most halo dwarfs whose iron abundances Fe/H1 are 1/30 to 1/1000 that of the Sun (−3.0 ≤ [Fe/H] ≤ −1.5) show modest abundance enhancements of light-alpha elements. This overabundance suggests that these elements originate in supernovae evolving from one or more massive stars (e.g., Woosley & Weaver 1995), exploding shortly after the Big Bang. The rare stars with even greater iron deficiencies often have extreme overabundances of carbon, nitrogen, and oxygen, and generally magnesium as well; these carbon-enhanced metal-poor (CEMP) stars undoubtedly require either additional internal processing or the products of a second massive-star explosion (e.g., Limongi et al. 2003).
The production of the elements heavier than the iron peak, in both metal-poor and more metal-rich stars, is also well understood as being due to the s-process and the r-process, the slow and rapid capture of neutrons by iron-peak elements. As first noted by Truran (1981), unevolved moderately metal-poor stars generally lack the s-process contribution; their entire heavy-element content is better explained by the r-process, possibly in a single prior event. As more results for such stars became available, the overall r-process content was found to vary among them by several orders of magnitude (see e.g., François et al. 2007). Kratz et al. (2007) and Sneden et al. (2008) emphasize and illustrate that regardless of the overall level of r-process abundances, the relative proportion of the heaviest r-process elements always remains the same and matches that of the Solar System, especially among those elements of the second peak between Ba at Z = 56 and Pt at Z = 78. This remains true even among CEMP stars, most of which are giants; many also have sizable levels of r-process or s-process enhancement. Likewise, in extremely metal-poor giants with more normal CNO abundance levels, the ratio Eu/Ba remains constant whatever the abundance level of the r-process elements (e.g., Mashonkina et al. 2019; Spite et al. 2018). However, as Kratz et al. (2007) note, the lighter elements just past the iron peak are not so well behaved, and lead to suggestions for “a second distinct (weak) r-process site” for these elements. Extensive attempts to pinpoint such a process or processes (e.g., Wanajo 2007, 2013) have yet to definitively reveal a solution.
The great age of very metal-poor stars (as indicated by their space motions and nuclear chronometers) implies that the r-process has operated at the earliest times of Galactic history, as expected if it arises in massive-star explosions. In contrast, the s-process is believed to occur only in evolved stars, especially those on the asymptotic giant branch (AGB). Thus s-process production is delayed by the time it takes stars to evolve from the main sequence, which rapidly increases as mass decreases. Understanding these time scales could establish the sequence of events leading to the appearance of s-process contributions, which in turn might shed light on the diverse halo, thick disk, or extragalactic origins of the metal-poor stars in our Galaxy.
However, separating the s-process and r-process contributions in any given star is difficult. Only for the s-process are synthesis yields predicted with reasonable reliability, as they can be derived from neutron-capture cross sections. This is best done for the Sun and solar system abundances, where isotopic abundances are available (e.g., Lodders 2010). The r-process contribution to the solar abundances is often derived empirically by calculating and subtracting the expected s-process contribution for each isotope (e.g., Simmerer et al. 2004). But at the solar age of a few billion years, there is no guarantee that all heavy elements were formed exclusively by a single common r-process, nor in a single event. At much earlier times, different environments and processes may have dominated.
Their discernment might come from abundance proportions of elements with intermediate atomic number 30 < Z < 52, the trans-Fe elements just beyond iron. As noted above, their production is not nearly as well understood, and the various scenarios proposed have widely varying time scales. Examples are an i-process with intermediate neutron flux (e.g., Cowan & Rose 1977; Roederer et al. 2016), a Light Element Primary Process (LEPP; Travaglio et al. 2004), the low-entropy domain of the neutrino-driven winds above the core of a collapsing Type II supernovae (Farouqi et al. 2009a,b; Arcones & Montes 2011) or a “weak” r-process in the wind above the core of electron-capture supernovae (Wanajo 2013; Niu et al. 2015), pulsating evolved AGB stars (Bisterzo et al. 2014), or fast-rotating main-sequence stars (Frischknecht et al. 2016).
The calculations required for reliable yield predictions for trans-Fe and heavier elements are very complex. Only recently have trans-Fe yields become available for stars over the range of low metallicities that characterize the Galactic halo. For example, Banerjee et al. (2017) provided yield patterns from Ge (Z = 32) to Pb (Z = 83) that result from various degrees of ingestion of surface hydrogen into a helium-burning shell of an evolved massive star of 25 M⊙, over metallicities ranging from one-tenth to 1/10 000 solar. Ritter et al. (2018) have extended their NuGrid model predictions to the metallicities of halo stars near the main-sequence turnoff, providing stellar overproduction factors for virtually all elements synthesized in stars with initial masses 1−25 M⊙ as they evolve, and incorporating the neutron addition processes from the neutron fluxes as they arise.
Observational constraints for trans-Fe elements are also increasing, but were originally confined to metal-poor giants. Lines of trans-Fe elements are typically weak in the spectra of metal-poor stars, due to their modest abundances, and are generally detectable only in the crowded ultraviolet spectral region. Notable exceptions are the well-observed trans-Fe elements strontium (Z = 38), yttrium (Z = 39), and zirconium (Z = 40), which have many optical lines. Germanium (Z = 32) and molybdenum (Z = 42) each have a single line potentially detectable from the ground, but only in cooler metal-poor stars.
With the advent of the Space Telescope Imaging Spectrograph (STIS) on the Hubble Space Telescope (HST), panchromatic high-resolution UV spectra have become feasible for the brightest metal-poor stars. Such spectra enabled the unanticipated Peterson (2011) discovery that in several halo turnoff metal-poor stars, all with r-process enhancements of less than a factor of four, the molybdenum-to-iron abundance ratio is six to ten times that of the Sun. As Peterson (2011) noted, this contradicts previous results for metal-poor giants, where the single available optical line indicates a near-solar Mo/Fe abundance ratio for all halo and globular cluster giants except those with more extreme r-process enhancements.
Further UV work on metal-poor stars has revealed that many exhibit remarkable star-to-star variations among the relative abundances of several of these trans-Fe elements, in contrast to the internal conformity of the heavier elements within both the s-process and the r-process. Peterson (2011, 2013) and Roederer et al. (2016) saw striking variations among metal-poor turnoff stars, as did Siqueira Mello et al. (2013) among metal-poor giants. Addressing this again using spectra redward of 3500 Å, Spite et al. (2018) uncovered trans-Fe abundance variations among a dozen giants (including one CEMP star) with iron abundances < 1/300 solar, whose r-process enhancements ranged from solar to ten times solar.
The aim of the present work is to address a single group of low-metallicity, low-r-process, unevolved stars as homogenously as possible. Our goal in this work is to analyze spectra obtained with the Space Telescope Imaging Spectrograph (STIS), primarily with the highest resolution grating E230H, that can isolate enough lines of trans-Fe elements to provide abundances sufficiently reliable to distinguish the various nucleosynthesis mechanisms operational at the very earliest times. To extend the analysis to heavier elements, high-resolution optical spectra are analyzed as well.
From them we have determined abundances and constrained their uncertainties for a range of elements within and beyond the trans-Fe domain in the five metal-poor turnoff stars HD 19445, HD 84937, HD 94028, HD 140283, and HD 160617. In Sect. 2, several recently suggested sites of trans-Fe element synthesis are reviewed. In Sect. 3, the observations adopted here are reported. Section 4 summarizes the abundance analysis methods. Section 5 presents plots of calculations versus observations that illustrate the determination of trans-Fe elemental abundances. It characterizes the presence of newly identified Fe I lines and lines that remain unidentified, and shows their influence on certain trans-Fe lines often adopted previously. Abundance results and their constraints on i-process calculations are discussed in Sect. 6. A summary is provided in Sect. 7.
2. Recent suggestions for the sites of heavy-element synthesis in metal-poor stars
As Cowan et al. (2019) recently reviewed, the astrophysical site or sites of the r-process may include more exotic environments than the collapse and explosion of a single massive star, and might lead to diverse yields. One possibility is the merger of two neutron stars, encouraged by recent observations of the kilonova associated with gravitational wave event GW170817 (Abbott et al. 2017a,b). Such events are capable of r-process nucleosynthesis that produces heavy elements (notably strontium: Watson et al. 2019). Other scenarios include the merger of a neutron-star with a black hole, rarer classes of massive single-star supernovae, magneto-rotational supernovae with jets (Winteler et al. 2012), and collapsars (Siegel et al. 2019). Like a massive, normally evolving single-star supernova, all these more exotic explosive and merger events take place very shortly after star formation first occurs, on the time scale of the evolution of massive stars. Given the complexity of the energy and dynamics of such explosions, detailed predictions of heavy-element production are difficult to provide.
Several tens of Myr later, a contribution can also occur from fast rotating massive stars (FRMS). This requires about 40 Myr for stars of seven solar masses (Meynet et al. 2006; Hirschi et al. 2007; Frischknecht et al. 2016). A few hundred Myr later, contributions may be incorporated from evolved lower-mass stars, especially those on the asymptotic giant branch (AGB) or super AGB (SAGB; Gallino et al. 2006; Käppeler et al. 2011; Bisterzo et al. 2017). Both these scenarios may also produce heavy elements by the s-process, and under the right circumstances can also synthesize certain lighter elements.
Results from UV echelle spectra for lighter neutron-capture elements, such as Ge, As, Se, Mo, and Ru, have led various authors to weigh in on the implications for trans-Fe synthesis sites at early times. For five warm, metal-poor turnoff stars, none of which had an r-process content enhanced by as much as a factor of four above solar, Peterson (2011) found that all five showed elevated abundances of Mo and Ru with respect to iron, but that the somewhat heavier element Cd (Z = 48) and the s-process element La (Z = 57) were minimally enhanced. This suggested the operation of high-entropy winds (HEW) operating above the core of collapsing Type II supernovae (Farouqi et al. 2009a,b), the only mechanism that predicted the production of light trans-iron elements confined to a narrow mass range.
In a sample of six metal-poor stars, including three that Peterson (2011) had analyzed, Roederer (2012) studied the abundance of Ge, As, and Se, and suggested that the weak and main components of the s-process are not likely to be the sources of these three elements.
Turning to very metal-poor giants, and incorporating optical spectra to extend the comparisons to many more heavy elements, Siqueira Mello et al. (2013) compared the abundance distributions of both the trans-Fe and the heavier elements in HD 122563 (with low heavy r-process content) versus those in CS-31082−001 (with high heavy r-process content). They suggested that the light neutron-capture elements can be formed in electron-capture supernovae as well (Wanajo et al. 2011).
Roederer et al. (2016) found a high ratio of the abundance of arsenic relative to those of Ge and Se for the mildly metal-poor star HD 94028, whose composition shows s-process as well as r-process products. To explain this they suggested an i-process like that of Cowan & Rose (1977), in which synthesis occurs at a neutron flux intermediate between those of the s- and r-processes, and inferred it had operated in early epochs.
Finally Spite et al. (2018) showed from optical spectra that, in extremely metal-poor giants, the behavior of the light neutron-capture elements between Sr (Z = 38) and Ag (Z = 47), whose proportions differ between r-rich and r-poor stars, can only be explained by a heavy element enrichment in two steps. Several authors had also suggested this previously for trans-Fe elements in metal-poor stars (e.g., Cescutti et al. 2013; Hansen et al. 2014; Roederer 2017). Spite et al. (2018) proposed an enrichment in main r-process elements that would lead to the abundance pattern observed in the classical r-rich stars (like CS 31082−001), and that, independently, a second mechanism detectable only in r-poor stars would enrich the matter in mainly first peak elements. Both processes would be required to operate at very early galactic epochs, since extremely metal-poor giants are believed to be very old.
3. Observational data
The UV analysis of this work is primarily based on HST spectra acquired with the E230H grating of the STIS echelle spectrograph and the 0.2″ × 0.09″ slit for a resolving power R = 114 000. The log of observations with the STIS spectrograph is given in Table 1.
Log of adopted HST STIS E230H and E230M echelle spectra.
The E230H spectra provide complete high resolution coverage of the stellar spectrum in the interval 1880−3140 Å for HD 84937, HD 94028, and HD 140283. For HD 19445, E230H coverage is limited to 1880−2150 Å; E230M spectra are available between 2280 and 3179 Å. For HD 160617, E230H spectra again cover 1880−2130 Å, beyond which no UV STIS echelle spectra are available. At 2000 Å, the E230H spectra all show S/N > 50.
We have simultaneously re-analyzed high-resolution optical archival spectra to obtain abundances of the first peak elements Sr, Y, Zr, and the second peak elements Ba and Eu. For those elements where both optical and UV lines are useful, this allows a direct comparison of the results of the more widely used optical spectra with those based on UV spectra. The optical spectra adopted are described below.
4. Analysis methods
To investigate analytical uncertainties, two independent approaches to the abundance analyses were followed. Spite and Barbuy performed a χ2 fit of the observed spectrum to a synthetic spectrum computed with the spectrum synthesis code Turbospectrum (Alvarez & Plez 1998; Plez 2012). Peterson ran the spectrum synthesis code SYNTHE (Kurucz 1993, 2004) over the region from 1850 Å to 6000 Å, deriving abundances visually by altering the elemental abundances adopted for SYNTHE until the calculated strengths of the relevant lines of an element matched those in the observed spectrum. The SYNTHE input line list is a more recent version of the one employed by Peterson et al. (2017), in which log gf-values are originally adopted from the Kurucz web site and continually updated to best match high-quality spectra for stars spanning a range of line strengths, as illustrated below.
Both Turbospectrum and SYNTHE include standard sources of continuous opacity. In the UV, both incorporate the bound-free edges of several abundant heavy elements whose strong influence is illustrated in Fig. 8.6 of Gray (2005). That work emphasizes that heavy elements dominate the continuous opacity below 2500 Å, and increases so rapidly toward bluer wavelengths that the continuum optical depth is forced to progressively higher, shallower atmospheric levels. Gray (2005) also notes the importance of Rayleigh scattering in the UV in cool stars, which again is included in both Turbospectrum and SYNTHE.
The opacity of overlapping individual lines also contributes at and below 2000 Å, and in redder regions wherever strong lines or line wings dominate. Consequently, even the weakest UV lines near 2000 Å are formed at shallow atmospheric levels.
The same model atmospheres were adopted for the optical analysis as for the UV. Models for the Turbospectrum analysis were interpolated in the MARCS grids (Gustafsson et al. 2008). The SYNTHE analysis adopted interpolations of models from the grids of Castelli & Kurucz (2003). For the extremely transparent atmospheres of the weak-lined stars HD 84937 and HD 140283, the SYNTHE analysis adopted models interpolated from the versions subsequently made publicly available by Fiorella Castelli that assume a mixing-length to scale-height ratio of 0.5, instead of the standard 1.25 value of the other models.
With these choices, SYNTHE calculations for all the five stars yielded no discernable discrepancy in the abundances of Fe I lines regardless of wavelength or lower excitation. This eliminates a tendency that persists in some current work (see e.g., Roederer et al. 2018a, and works cited therein) for the iron abundances found from Fe I lines of lowest excitation to diverge from those found from Fe II lines and Fe I lines of higher excitation.
Both Turbospec and SYNTHE analyses adopted the high-resolution UV spectra in Table 1. However, in the optical, the analyses incorporated different observational spectra. For the optical Turbospectrum analysis, ESO spectra obtained with the Very Large Telescope (VLT) and the spectrograph UVES (Dekker et al. 2000) were adopted. Included were the observations in the UVES programs listed in the Acknowledgements. In all cases, the resolving power R was 47 000 or higher. These spectra were reduced using the UVES context (Ballester et al. 2000). The S/N of the resulting spectra exceeded 100 at 350 nm. To better detect extremely weak lines, this analysis also incorporated a high S/N spectrum of HD 140283 obtained with the spectrograph ESPADONS at the CFHT in Hawaii under program 11AB01 (PI Barbuy). This had a resolving power R = 81 000, and covered the wavelength range 3700−10 475 Å with S/N = 800−3400 per pixel.
The SYNTHE optical analysis also relied on UVES archival spectra, along with Keck HIRES spectra from the KOA archive. Table 1 of Peterson & Kurucz (2015) includes the specifics of the optical spectra adopted for HD 94028, HD 140283, and HD 160617 from KOA. While these supported the Turbospectrum analysis, they are less accurate, being based on spectra of lower S/N and resolution. Consequently the SYNTHE optical values were not included in the final results below.
4.1. Stellar parameters
The stellar parameters adopted for the five stars in each approach are reported in Table 2 along with their sources. The SYNTHE parameters were derived strictly spectroscopically (Peterson et al. 2001, 2017), while the Turbospectrum parameters also incorporate photometry.
Stellar parameters adopted with Turbospectrum and with SYNTHE.
Despite their different origins, the parameters adopted for the Turbospectrum and SYNTHE computations are very similar. The difference in the adopted values is at most 50 K for the effective temperature Teff, 0.1 dex in gravity log g, 0.3 km s−1 in microturbulent velocity vt, and 0.15 dex in [Fe/H]. Runs with Turbospectrum adopting the SYNTHE models confirmed that these small differences in the model parameters have a negligible influence on the abundances deduced.
Our temperature for HD 94028 is 300 K higher than the values of Roederer (2012) and Roederer et al. (2016). However, Roederer et al. (2018b) redetermined the stellar parameters of HD 94028, and also HD 19445 and HD 84937, and these values of temperature, gravity and microturbulent velocity now agree with our determinations in Table 2 to within the errors.
4.2. Selection of lines and gf-values
The list of lines used for the determination of the abundances of the trans-iron and neutron-capture elements is given in Table 3, together with the adopted log gf values. The latter are largely taken from Morton (2000). Where these are unavailable or have been revised based on improved laboratory measurements, other sources were adopted, as specified in the table. As an example, for cadmium we adopted the updated Roederer & Lawler (2012) log gf value for the Cd I line at 2288 Å, as well as their hyperfine splitting for both cadmium lines, but reverted to the Warner (1968b)gf value for the Cd II line at 2144 Å, because that value provided excellent consistency between the two lines in our abundance determinations. To illustrate the effect of the hyperfine splitting of this feature as lines become stronger, its hyperfine splitting was not included in the SYNTHE calculations shown for this line in the next section.
Lines and line parameters adopted are given, along with abundances A(X) derived from them for each star analyzed in this work.
For each line, Table 3 includes the abundance of the element A(X) (defined as A(X) = log(NX/NH) + 12). The set of A(X) values listed on the left were derived with Turbospec; those to the right were derived with SYNTHE. Both analyses adopted the line parameters appearing in the first five columns. Wavelengths for SYNTHE calculations were adjusted by up to 0.02 Å where necessary, to match the wavelength scale set by Fe I (Peterson et al. 2017).
We tried to avoid the lines too severely blended. This was judged both from the line list itself, and from the figures below comparing spectral synthesis versus observation for each star.
For germanium, many lines are potentially available, but all are weak in the most metal-poor stars. We chose as many lines as feasible: eight minimally blended Ge I lines with consistent experimental and theoretical gf-values from Li et al. (1999). The Ge I log gf values in Table 3 are the straight average of their theoretical and experimental results.
The SYNTHE analysis yielded results for all eight Ge I lines in all five stars, except for those regions where data are lacking for HD 160617 (Table 1). The low internal dispersion of the SYNTHE Ge abundances determined for each individual star seen in Table 3 supports the internal consistency of the Li et al. (1999)gf values for these eight lines.
As described below in discussing the figures, for arsenic, selenium, and germanium we excluded certain lines adopted in previous work that we found to be blended by Fe I lines listed in the laboratory Fe I study of Brown et al. (1988), and those recently identified by Peterson & Kurucz (2015) or Peterson et al. (2017). Consequently, abundances deduced for these elements tend to be lower in this versus previous work, especially for arsenic where few lines are available.
4.3. Comparison of methods and results from each approach
Because the same log gf-values were adopted for the UV lines of trans-Fe species, the line-by-line differences in the abundances found by these independent analyses are useful in assessing the uncertainties in the derivation of the abundances of individual elements. In general, these agree to better than 0.1 dex, when based on largely unblended lines of medium strength in regions where the continuum is well defined. Line-to-line differences reach 0.2 dex when lines become blended or very weak, and can exceed this both for saturated lines and for lines blueward of 2000 Å, where the S/N of the observed spectra decreases and the number of unidentified lines rises rapidly, as illustrated just below.
We also investigated potential UV systematics due strictly to the code and the source of models, by incorporating both the line lists and the Castelli & Kurucz (2003) models adopted by Peterson into Turbospec runs. No differences were discerned at a level of 0.05 dex (see also Appendix A in Bonifacio et al. 2009).
5. Comparisons of observed and calculated UV spectra near lines of trans-Fe elements, and the effect of unidentified lines
Figures 1–15 illustrate the agreement between the observed spctrum and two SYNTHE spectral calculations for each of the five stars in UV regions containing lines of light trans-Fe elements. These five comparisons are offset vertically for clarity. Especially at an expanded scale, the goodness of fit of the abundance deduced for each star can be judged by how well the light blue line representing the best-fit theoretical calculation that includes the newly identified Fe I lines below matches the dark black observation.
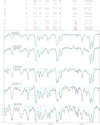 |
Fig. 1. Spectra for the five stars are plotted in the region of the Sn II 1899.898 Å line, where unidentified lines are numerous and strong. Each of Figs. 1−15 compares the observed spectrum (heavy black line) with the two calculations, one lacking newly identified Fe I lines (thin black line) and one including them (light blue line). The Y scale on the left is for the bottom comparison. The others have the same vertical scaling factor; ticks on the Y axis indicate a displacement of 0.1 full scale. At the bottom is the wavelength in Å. At the top, aligned with line wavelength, are listed the line parameters for the strongest lines in the best-fit calculation of the bottom spectrum. Following the decimal digits of the wavelength are given the species, the lower excitation potential in eV, the decimal digits of the core residual intensity of the unbroadened spectrum, and the log gf-value adopted. Lines of trans-Fe species are highlighted in red, and those of newly identified Fe I in light blue. Purple lines indicate light-blue calculations with a ±0.3 change in the adopted abundances of each trans-Fe element. |
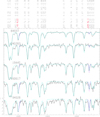 |
Fig. 2. Spectra of the Ru II 1888.064 Å and As I 1890.429 Å lines. |
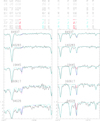 |
Fig. 3. Spectra near the As I lines at 1937.594 Å (left panel) and at 1972.624 Å (right panel). |
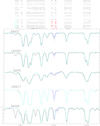 |
Fig. 4. Spectra near the Cd I 2288.018 Å line; that of HD 19445 is E230M. Data for HD 160617 are lacking in this region. |
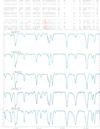 |
Fig. 5. Spectra in the region of the Cd II 2144.393 Å line. The poor fit for the two bottom spectra illustrates the effect of omitting its hyperfine splitting for this plot. |
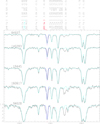 |
Fig. 6. Spectra in the region of the Se I 1960.893 Å line. |
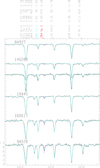 |
Fig. 7. Spectra in the region of the Se I 2074.794 Å line. |
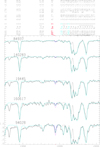 |
Fig. 8. Spectra in the region of the Ge I 1998.887 Å line. |
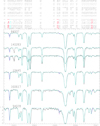 |
Fig. 9. Spectra near the Ge I 2065.215 Å line. Here and in Figs. 7, 10, 14, and 15, the GO-7348 spectrum for HD 140283 appears above that of GO-14672. |
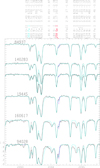 |
Fig. 10. Spectra in the region of the Ge I 2094.258 Å line. |
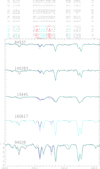 |
Fig. 11. Spectra in the region of the Ge I 2651.568 Å line. In this region and those of Figs. 12 and 13, data for HD 160617 are lacking, and are from a lower-resolution E230M spectrum for 19445. The effect of weak newly identified and unidentified Fe I lines is evident in the three E230H spectra; their effect persists but is difficult to discern at the E230M resolution. |
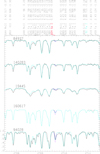 |
Fig. 12. Spectra in the region of the Ge I 2709.624 Å line. Unidentified lines are still present but less prominent here than in Fig. 11. |
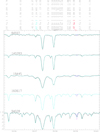 |
Fig. 13. Spectra in the region of the Ge I 3039.067 Å line. Unidentified lines are virtually absent even in the HD 94028 spectrum. |
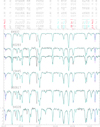 |
Fig. 14. Spectra covering the Mo II 2015.123 Å and 2020.324 Å lines. |
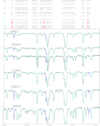 |
Fig. 15. Spectra in the region of the Mo II 2038.452 Å, Se I 2039.842 Å and Ge I 2041.712 Å lines. |
Labels highlighted in light blue indicate lines of Fe I newly identified in ongoing work by Peterson & Kurucz (2015) and Peterson et al. (2017), including results for forty more levels since identified by Peterson et al. (in prep.). The effects of these recently identified Fe I lines are discerned wherever the light blue line falls below the thin black line. Lines that remain unidentified are evident wherever the solid black line falls below the blue line in all stars, and increase in depth from the top to the bottom spectrum.
Figure 1 shows examples of both types. Three newly identified lines appear at 1898.284 Å, 1898.727 Å, and 1899.822 Å. Two of the strongest lines that remain unidentified are seen at 1897.78 Å and 1900.02 Å. Many weaker unidentified lines are also present, to a degree that the continuum is no longer discernible in the bottom spectrum. Figures 2 and 3 also show the presence of unidentified lines, although not quite to the same degree. Figure 3 contains two strong and two weaker newly identified Fe I lines, as identified at the top.
Straightforward theoretical considerations suggest that these three regions blueward of 2000 Å should harbor considerably more unidentified Fe I lines than do the regions somewhat redward of 2000 Å, as follows. According to Peterson & Kurucz (2015), in the near UV, most unidentified lines in cool stars are expected to be due to Fe I. They are transitions from a lower level that has been identified, to an upper level that is unidentified, since Fe I levels below ≈7 eV have largely been identified. The ground state of a species is defined as 0 eV from its lowest level; that of Fe I is of even parity. Lines of Fe I have the upper level of the opposite parity as the lower level. Consequently, the number of unidentified lines remaining whose upper level is odd increases dramatically only below ≈2000 Å, as seen in Fig. 1.
A similar increase in the number of unidentified lines is expected redward of 2500 Å. This is because the lowest Fe I odd-parity levels are not at zero but at several eV. The strong presence of unidentified lines in the 2630−2720 Å region where weak lines prevail is indeed observed from the low-resolution UV spectra of dwarfs. Throughout this region, unmodeled flux is absent only in the most metal-poor dwarfs of near-solar temperature, and climbs to dramatic levels at solar abundances (Peterson & Kurucz 2015, Fig. 4).
That these are largely due to Fe I is confirmed by the Kurucz “predicted” calculations of unidentified Fe I lines, those for which the energy of one level (or both) is unknown. Currently, the Kurucz predicted Fe I calculations show more than fifty unidentified Fe I lines remaining in the 2650−2700 Å region with predicted strengths greater than 20% deep in the HD 94028 spectrum of Fig. 11, and roughly five times that number greater than 10% deep. Because of their higher low excitation potentials, their strengths are considerably reduced (by the exponential Boltzmann excitation factor) compared to those < 2000 Å. So they are much more difficult to identify, especially in the laboratory (Brown et al. 1988), but their numbers remain strong.
The effect of these unidentified lines on abundances derived from weak lines in this region is thus expected to be large, on both the contamination of weak features and on the placement of the local continuum. It is best judged from Fig. 11, where many weak newly identified and unidentified lines are both present. Within this 3 Å range, five newly identified Fe I lines are strong enough to be labeled at the top, and weaker ones such as those at 2650.66 Å and 2652.01 Å are seen in the HD 94028 spectrum.
Blending by newly identified Fe I lines does impact abundance determinations for trans-Fe elements. One such case is seen in Fig. 11. Two Fe I lines Peterson et al. (2017) identified at 2651.102 Å and 2651.182 Å blend with one of the strongest Ge I lines, at 2651.172 Å. The extent of their contamination is judged by the difference in the depth of the blue line, which includes them in the synthesis, versus that of the thin black line, which does not. This is seen most clearly in the plots for HD 140283 and HD 160617. In HD 160617, the black line falls higher than does the weaker of the two red lines, indicating that the analysis of this line would yield a germanium abundance about 0.4 dex too high if the Fe I contribution was ignored. While the SYNTHE calculations do include this contamination, and produce consistent results for germanium for the other stars, we dropped this line due to its blending. Its potentially unrecognized contamination highlights the need for including as many well-modeled lines as possible for species reliant upon UV spectra.
Another case is seen in Fig. 9, even though unidentified lines are much less common. In contrast to Fig. 11, the 5 Å region in Fig. 9 has but a single newly identified Fe I line, at 2062.800 Å. However, as it lies close to the Se I line at 2062.788 Å, its contamination is also significant, and so this line was also dropped.
Those lines in Fig. 11 that remain unidentified are mostly too weak to affect continuum placement in the E230H spectrum of the warm star HD 84937 at [Fe/H] = −2.25. Unidentified lines do become significant in the continuum placement of the lower resolution E230M spectrum of the cooler star HD 19445 at [Fe/H] = −2.0, and also in the E230H spectrum of HD 94028 at [Fe/H] = −1.4, as seen in the increasing number and strength of black depressions that have no counterparts in the blue calculation. In Fig. 9, weaker depressions are seen in HD 94028; these are only barely discerned in HD 160617 and they are absent from the other stars.
In lower-resolution E230M spectra of cool metal-poor giants, Cowan et al. (2005) noted that the UV Ge I lines such as those near 2651 Å were detectable, but were very difficult to analyze due to their contamination. Because Fe I lines strengthen at low temperatures, it seems probable that their difficulties were due to the significant presence of unidentified Fe I lines contaminating the surroundings.
6. Abundance results
Table 4 presents the final A(X) values adopted for the Sun as well as for each star. In Table 4, most solar values of A(X) are adopted from Grevesse et al. (2015); those for As and Se are from Asplund et al. (2009). In Table 5, we present the corresponding values of [X/Fe] for the Turbospec models.
To derive A(X) for each star, the line-by-line results in boldface for each element as listed in Table 3 were combined as follows. For UV lines, each individual Turbospectrum and SYNTHE determination was averaged with equal weight. Upper limits were considered as detections, which could lead to erroneously high abundances in cases with many upper limits. For lines redward of 3050 Å, the unweighted average of Turbospec results alone was adopted, due to the higher quality of the optical spectra employed. Wherever lines from both Turbospec and SYNTHE were used, Table 4 lists the internal standard deviation of the individual line-by-line determinations in both separate analyses. It is a measurement of the overall coherence of the two sets of computations.
Germanium warranted an exception. For germanium, we adopted the SYNTHE calculations alone for the A(Ge) values in Table 4. The SYNTHE calculations do include the newly identified Fe I lines, whose importance for germanium is described at the end of Sect. 5. In addition, the SYNTHE calculations over 2000 Å−2080 Å (Figs. 7, 9, 10, 14, and 15) incorporate both of the two E230H spectra available for this region in HD 140283 (Table 1). This aided estimates of detection for extremely weak lines, especially critical for germanium. As noted in Sect. 4.2, the SYNTHE analysis yielded results whose internal dispersion is low, which supports the internal consistency of the Li et al. (1999) Ge Igf values; it supports the reliability of the SYNTHE analysis as well. However, since many of the SYNTHE determinations are upper limits, our result for that star is best considered a possible upper limit, as indicated in Table 4.
6.1. Comparison with previous works for these stars
UV studies of most of the elements in Table 5 were conducted for HD 94028 by Roederer et al. (2016) and for HD 160617 by Roederer & Lawler (2012). Their results for each element generally agree with those of Table 5 to within the joint standard deviation of about 0.2 dex in the determinations.
However, differences are large in the germanium abundance we find for the two stars in common with Roederer (2012). For HD 140283, our Ge result A(X) = ≤−0.15 in Table 4 is considerably lower than the Roederer (2012) upper limit of +0.6. For HD 94028, we find a higher value for A(Ge), +1.86 versus +1.56. Roederer (2012) considered only four Ge I lines, obtaining upper limits for all of them in HD 140283, and one detection plus two upper limits in HD 94028. For the latter star, they had only a single UV spectrum centered at 2013 Å; for HD 140283, only an E230M spectrum for the critical 2390–3135 Å region. As discussed above, our use of a more extensive Ge I line list with consistent gf values, and of an expanded E230H dataset better able to detect them (Cowan et al. 2005), undoubtedly has led to more robust results for this difficult analysis.
Differences are also large for arsenic. The Roederer et al. values for [As/Fe] are higher than ours by 0.4 dex for HD 94028 (Roederer et al. 2016) and 0.5 dex for HD 160617 (Roederer & Lawler 2012). As their adopted temperatures and gravities are similar to ours, we attribute the discrepancy to the choice of As I lines, all of which lie blueward of 2000 Å.
We adopted only the lines at 1890.4 Å and 1937.6 Å, plotted respectively in Fig. 2 and in the left panel of Fig. 3. We dropped the only line adopted by Roederer et al. (2016) for HD 94028, as this 1990.4 Å line is weaker and more blended. We also rejected the 1972.6 Å line that Roederer & Lawler (2012) included along with those at 1890.4 Å and 1990.4 Å for HD 160617.
The 1972.6 Å line was dropped because it is dominated by an Fe I line that appears in the laboratory Fe I spectrum of Brown et al. (1988). The right panel of Fig. 3 shows SYNTHE calculations that adopt the arsenic abundances of Table 4, and incorporate an Fe I line at the wavelength and lower excitation potential listed in Table 1 of Brown et al. (1988). The red lines in this panel depict calculations that include the As I line only; its contribution is too small to register in the top two spectra. Adding the Fe I line produces an excellent match to the strength and profile of the blended feature in each of the five stars. Clearly the Fe I line dominates the strength of the As I feature in all five spectra, and is the sole contributor in the two weakest-lined spectra.
NLTE effects due to departures from thermal and Saha equilibrium populations may be influential among lines of minority neutral species, including those of most trans-Fe elements. We are not aware of NLTE calculations for these trans-Fe neutral species, and would encourage theoretical calculations for UV resonance lines of these neutral species wherever possible. In this work they appear to be small.
Calculations by Andrievsky et al. (2007) for the Na D lines in warm turnoff stars found an NLTE correction of −0.3 dex at [Fe/H] = −2.5, decreasing to < − 0.1 dex at [Fe/H] = −3.5. In general, the weaker the line the weaker the NLTE effect, as is consistent with weak-line formation at greater atmospheric depth and pressure. Their Fig. 4 shows that the Na D 5890 Å lines in high-resolution spectra of stars with these parameters have residual intensities of 0.75 to 0.85. Our UV trans-Fe resonance lines are rarely this strong, but are formed at shallower levels (Sect. 4). Nonetheless, in Figs. 6 and 7 the same LTE selenium abundance matches each star’s Se I profile of both the strong Se I line at 1960.893 Å and the weak Se I line at 2074.794 Å.
Concerning the ionization balance, the SYNTHE result for the abundance of the minority neutral species agrees with that of the ionized species for elements such as Fe and Ti that are represented by many lines of each species. Furthermore, with the adoption in SYNTHE of l/H = 0.5 models for the weakest-lined stars (Sect. 4), no dependence is seen of the abundance within a neutral species on the lower excitation potential of the line, neither in the UV nor in the optical.
6.2. Abundance patterns in the most metal-poor stars: HD 19445, HD 84937, HD 140283, and HD 160617
With these results, we turn our attention to the abundance patterns exhibited within each star by the light trans-Fe elements and their heavier counterparts. We first examine the four most metal-poor stars analyzed here, those with metallicities approaching 1/100 solar: [Fe/H] ≤ −1.8. Their r-process content is judged from the [Eu/Fe] values of Table 5. With [Eu/Fe] = −0.22, HD 140283 has a less-than-solar proportion of r-process elements; the other three stars have modest enhancements, +0.37 ≤ [Eu/Fe] ≤ +0.51.
The main r-process abundance pattern has been computed by Wanajo (2007) for hot and cold models. This theoretical pattern is known to give a good representation of the abundance pattern of stars with extreme r-process enhancements [Eu/Fe] > 1, such as CS 31082−001 (Hill et al. 2002; Barbuy et al. 2011; Siqueira Mello et al. 2013) or CS 22892−052 (Sneden et al. 1996, 2003). But in metal-poor giants with more modest r-process enhancements, an overabundance is often observed of Sr, Y, and Zr, the first-peak elements with optical lines. As the r-process enhancement drops towards the solar value, some stars show elevated Sr abundances, with [Sr/Eu] ranging from the solar value to [Sr/Eu] > 1. Siqueira Mello et al. (2014), Roederer et al. (2016), Aoki et al. (2017), and Spite et al. (2018) see this in giants within our Galaxy, as does Roederer (2017) in giants in ultrafaint galaxies.
In Fig. 16, we plot as a function of atomic number Z the abundance pattern observed in each of these four stars (black squares) versus the Wanajo (2007) calculations (blue lines), both normalized to the abundance of Eu. Like the metal-poor giants of modest r-process enhancement, the four field halo turnoff stars of Fig. 16 show Sr-Y-Zr abundances that are somewhat higher than the Wanajo (2007) predictions. The discrepancy is smallest for Zr and largest for Sr, and for all three elements the discrepancy increases as metallicity declines. In the three stars of lowest metallicity, the discrepancy extends to Mo and Ru as well.
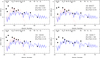 |
Fig. 16. Neutron-capture abundances observed in the four sample stars with [Fe/H] ≤ −1.8 (black squares) are compared to the predictions of the main r-process following Wanajo (2007) (hot and cold models; blue lines) and the predictions of the weak-r process (Wanajo 2013) with Proto-Neutron-Star masses M = 1.2 and 1.4 M⊙ (red dotted lines). |
All four stars show good agreement with main r-process predictions at the heavy end, for Ba and Eu. Their [Ba/Eu] ratios are always compatible with the main r-process, as expected when an s-process contribution is absent. More surprisingly, the ratios [Sn/Eu] and [Cd/Eu] appear to be also compatible with a pure main r-process. These elements are rarely observed in giants.
Other processes, collectively designated the “weak” r-process, can bring about an extra first-peak enrichment (Wanajo 2013; Cowan et al. 2019). Recently, Aoki et al. (2017) showed that small variations of the electron-capture supernovae parameters such as electron fraction and Proto-Neutron-Star (PNS) mass could induce variations of the ejecta of the weak-r process that can approximately reproduce the abundance patterns of the first peak elements from Sr to Ba in their sample of giant stars.
In Fig. 16 we also compare the abundance pattern of our most metal-poor stars to predictions (dotted red lines) of the weak-r process by Wanajo (2013), computed for PNS masses of 1.2 to 1.4 M⊙. The Sr-Y-Zr-Mo-Ru abundances of these three stars are a much better match to these calculations than to the Wanajo (2007) weak-r process contributions shown by blue lines in Fig. 16. However, the Wanajo (2013) calculations are not able to account for the high abundance of the lightest trans-Fe elements Ge, As, Se in any of the four stars. A peculiarity of the weak-r process (following Wanajo 2013) is indeed a rapid drop of the abundances below Z = 40, which is not observed in these stars.
6.3. Abundance patterns in the less metal-poor star: HD 94028
With [Fe/H] = −1.4, HD 94028 is the least metal-poor star of our sample; it has a low r-process enhancement, [Eu/Fe] = +0.15. As seen in the upper panel of Fig. 17, the abundance pattern of this star is very different from the Wanajo (2007) main r-process pattern (blue lines). It also differs from the pattern behavior of the four more metal poor stars in Fig. 16. Not even the observed Ba/Eu ratio in Fig. 17 fits the main r-process pattern, as Roederer et al. (2016) also noted.
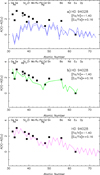 |
Fig. 17. Neutron-capture abundances observed in HD 94028 are compared to the predictions of the main r-process following Wanajo (2007, hot and cold models, blue lines) in the top panel; the solar abundance pattern (green line) in the middle panel; and the predictions of the combined s, modified r, and i-processes as computed by Roederer et al. (2016, their Figs. 6 and 7; red lines) in the bottom panel. |
In the middle panel of Fig. 17, we compare the abundance pattern of HD 94028 to the abundance pattern of the Sun. The agreement is much better. The ratio Ba/Eu is the same as observed in the Sun, which suggests the presence of s-process products to the same degree. The light trans-Fe elements from Ge to Cd have abundances that remain higher than their solar proportions, but the excess is moderate.
In the lower panel of Fig. 17, we compare the abundance pattern of HD 94028 to a composite template constructed by Roederer et al. (2016). To explain the observational distribution of element abundances in HD 94028, and in particular the high abundances they derive for Ge, As, and Se in this star, Roederer et al. (2016) invoked contributions from three distinct mechanisms: the s-process, an r-process modified from that of the Sun, and an i-process, which designates neutron capture with a neutron flux intermediate between that of the s- and r-processes. Such i-process conditions may be found in multiple stellar sites, with both short and long time scales.
Roederer et al. (2016) followed Cowan & Rose (1977) in investigating the i-process in an evolving star, when a rapid ingestion of a large quantity of H into the He-burning convective regions occurs, producing neutrons through the 13C(α,n)16O reaction. Roederer et al. (2016) computed the ejecta of this i-process at a metallicity [Fe/H] = −2, using the i-process trajectory of Bertolli et al. (2013) adjusted to maximize production in the As-Mo region. Their Fig. 7 shows a reasonably good match to the abundance distribution they derived for HD 94028. Ours shows a similar fit, despite the Ge and As abundance discrepancies noted in Sect. 6.1.
Roederer et al. (2016) remarked that this i-process calculation generally reproduced an observational trend they detected among HD 94028 and the more metal-poor stars they had analyzed previously: that [As/Ge] is generally super-solar while [Se/As] is sub-solar. At the same time they noted that Y was overproduced in their calculations, and stated that their proposed detection of i-process products at early times is preliminary, requiring more comprehensive models.
We concur that more work needs to be done here. While we do find a super-solar ratio [As/Ge] for all these very metal-poor stars except HD 84937, we also find the ratio [Se/As] to be super-solar in all our stars (Table 5). We are also concerned that the Roederer et al. (2016), Fig. 7 comparison rests on a substantial r-process modification. Prior to adding their i-process contribution to their template, they added to the solar r-process abundances the differences from the Simmerer et al. (2004) solar r-process distribution that Roederer et al. (2012, 2014) had derived for the star HD 108317, a very metal-poor giant of somewhat higher r-process content. Based on the bottom panel of Fig. 9 of Roederer et al. (2014), this increased the amount attributed to the r-process by +1.2 dex for Ge and +0.7 dex for As. Whether such a modified r-process has similarly contributed to the abundance distribution of trans-Fe elements of some metal-poor stars but not to that of the Sun remains an open question.
6.4. The odd-even effect and its metallicity dependence among trans-iron elements in metal-poor stars
In Figs. 16 and 17, all five metal-poor stars exhibit an odd-even effect in the trans-Fe elemental trios Ge-As-Se and Sr-Y-Zr: the abundances are depressed of the odd-Z elements As and Y relative to those of the adjacent even-Z elements. Among such unevolved metal-poor stars generally, an odd-even effect is also seen in the sodium and aluminum abundances. Its size increases as metallicity declines, due to the metallicity dependence of the neutron seed in the progenitor of explosive synthesis.
For the trans-Fe elements, a hint of such a metallicity dependence is suggested, in that the size of the odd-even effect in both Ge-As-Se and Sr-Y-Zr is larger in the most metal-poor stars of Fig. 16 than in the most metal-rich star HD 94028 in Fig. 17. However, conclusive evidence depends on a larger sample of stars spanning a wider metallicity range.
As noted above, extensive Sr, Y, and Zr abundances for metal-poor stars have been obtained from ground-based optical abundances. Consequently we have examined the behavior of the Sr-Y-Zr abundances from two such studies with larger samples, those by Peterson (2013) in 29 more metal-rich dwarfs, and by Spite et al. (2018) in 14 very metal-poor giants. Subtracting the average of [Sr/Fe] and [Zr/Fe] from the [Y/Fe] value for each star in each study revealed that the Y abundance is once again generally suppressed with respect to their average.
A plot versus metallicity of these values for both groups provided a fit to all points that shows a strong correlation, with a correlation coefficient R = 0.82, and an individual standard deviation of 0.082 dex for the giants and 0.067 dex for the dwarfs. At the upper metallicity limit of the dwarfs, [Fe/H] = −1.2, [Y/Fe]–⟨[Sr/Fe] + [Zr/Fe]⟩ = 0.0, indicating the Y abundance is not depressed below its solar value relative to the average abundance of the adjacent elements Sr and Zr. The Y relative abundance does become depressed at lower metallicities, however. [Y/Fe]–⟨[Sr/Fe] + [Zr/Fe]⟩ decreases by 0.15 dex for every 1 dex decrease in [Fe/H], becoming −0.4 at [Fe/H] = −4, the lower metallicity limit of the giants.
6.5. i-process calculations and the odd-even effect in trans-iron elements
Generally speaking, the Wanajo (2013) calculations (pink lines) in Fig. 16 fail to reproduce the overall rise of the lightest trans-Fe elements in the more metal-poor stars, while the Roederer et al. (2016) composite template (pink line) in the bottom panel of Fig. 17 reproduces the overall distribution of HD 94028 quite well. In contrast, despite having adopted [Fe/H] = −2 for the i-process calculations of HD 94028 (at [Fe/H] = −1.4), the Roederer et al. (2016) template in Fig. 17 underestimates the odd-even effect of its trans-Fe elements, especially for Sr-Y-Zr; while the Wanajo (2013) calculations in Fig. 16 match the odd-Z to even-Z trans-Fe abundance variations quite well for both Sr-Y-Zr and Ge-As-Se.
From this it seems that while the i-process offers promise to explain the excess of trans-Fe abundances in significant classes of metal-poor stars, more calculations are needed to judge whether its products are representative of the abundance distribution of the light trans-Fe elements in the majority of field halo stars with low to moderate enhancements of the r-process heavy elements. In particular, the presence of a trans-Fe odd-even effect suggests that more useful i-process calculations should include yields for model star progenitors that span the range of metallicities −4 ≤ [Fe/H] ≤ −1. As noted in the Introduction, two sets of recent i-process calculations do this.
Ritter et al. (2018) extended the NuGrid program results that provide stellar overproduction factors for virtually all elements synthesized in stars with initial masses 1−25 M⊙. Their models include the evolution of each star before, during, and after each condition amenable to nucleosynthesis, incorporating the various neutron addition processes based on the associated neutron fluxes. In this work they included progenitor metallicities ranging from mildly metal-poor to extremely metal-poor halo stars, again including the nucleosynthetic yields of both massive stars and lower mass stars on the AGB.
One suggestive result of these calculations is that where Sr-Y-Zr is copiously produced, the adjacent element rubidium (Rb; Z = 37) is produced in even greater overabundance. To check this possibility, Turbospec calculations were run near the Rb I line at 7800.26 Å, adopting the Warner (1968a) value log gf = +0.137 dex. These were compared to a high-quality red spectrum of HD 94028 formed from the coaddition of two UVES spectra. As shown in the upper panels of Fig. 17, this comparison led to an upper limit to the HD 94028 Rb abundance. This limit is not inconsistent with these predictions, but cannot confirm them. We also searched for this line in UVES archival spectra for HD 84937, HD 140283, and HD 160617, and in a spectrum obtained at the TBL (Pic du Midi) for HD 19445, but no hint of its detection was found.
Unfortunately, for most trans-Fe elements the Ritter et al. (2018) yields are difficult to compare directly with observations, for they often exhibit significant variations between small changes in mass. This is not unexpected given the variety of conditions involved, and the approximations necessary to model them. As these assumptions improve, these calculations might provide a comprehensive benchmark for comparison against present and future observational constraints from metal-poor stars.
The Banerjee et al. (2017) calculations were done for metallicities from one-tenth to 1/10 000 solar, but only for a single mass of 25 M⊙. They are based on the ingesting varying amounts of protons into its He-burning shell. Their choice of mass stems from their arguments that synthesis from proton ingestion only occurs for stars of 20−30 M⊙. They point out that the burning of the ingested protons is very difficult to model because the convective mixing can only be approximated very simply. Despite these limitations and simplifications, their results do show a clear odd-even effect among the trans-Fe elements, one which increases as metallicity drops. This seems to be a very promising test case.
6.6. Additional observational correlations among elemental abundances
Among the abundances we derive for the five stars considered here, outside of the odd-even effect and the two exceptions noted just below, the excess or deficiency of a particular element shows no correlation with that of any other element, whether within or beyond the mass range 30 < Z < 52. In particular, none of these elements individually tracks the overall enhancement of r-process heavy elements among these stars. They do among metal-poor giants that are highly enhanced in r-process elements, but that is not the case among these dwarf stars, nor those of Peterson (2013); with but a single exception, all of these have [Eu/Fe] ≤ 0.5. Four of the Spite et al. (2018) giants have high r-process content, +0.7 ≤ [Eu/Fe] ≤ +1.65, but show no obvious correlation for any trans-Fe elemental abundance, nor for the Sr-Y-Zr odd-even effect. For all four have −2.9 ≤ [Fe/H] ≤ −2.7 and −0.38 ≤ [Y/⟨Sr+Zr⟩] ≤ −0.14, straddling the best-fit line with rather large scatter.
The first exception is that even when molybdenum is highly enhanced, the heaviest trans-Fe elements are not. Peterson (2011) found Mo (Z = 42) to be highly overabundant with respect to iron, but Cd (Z = 48) and Sn (Z = 50) were found at nearly their solar proportions. This suggested the formation of trans-iron elements of lowest Z in the low-entropy regime of a high-entropy wind, which for certain parameters leads to excess production of primarily the trans-iron elements of lowest Z (Farouqi et al. 2009a,b, 2010). Such a specific constraint led Peterson (2011) to note that only a few individual supernovae must have contributed to the heavy-element content of these stars, even in HD 94028 at a metallicity [Fe/H] = −1.4, where the observed heavy-element abundance distribution usually requires the accumulation of products from multiple events.
The second exception is that, with our addition of Ge abundances, we find that the germanium abundance does track that of molybdenum, but at a level that is dramatically lower than that of the solar ratio. Despite the wide star-to-star range of their individual abundances with respect to iron, [Mo/Ge] is essentially constant in all five stars at an average ⟨[Mo/Ge]⟩ = 1.18 dex, with an individual standard deviation of 0.10 dex. Among these five stars, this suggests that whatever has overproduced Mo has underproduced Ge with respect to iron. This further constrains both the mechanism and the number of events contributing heavy elements to each star.
Unfortunately, neither the Spite et al. (2018) nor the Peterson (2013) results include germanium, because the single Ge I line potentially observable from the ground falls at 3039 Å, where telluric absorption increases suddenly and dramatically toward the blue. Ground-based echelle spectra are usually very poorly exposed there, or cut off entirely just redward. Consequently this connection must await further observation and analysis for verification in the low-metallicity domain [Fe/H] < −1.5.
To date, we have not found any calculations, i-process or otherwise, that predict a high, constant [Mo/Ge] ratio at these metallicities. One interpretation is that mentioned above, that the lightest trans-iron elements are preferentially formed in different processes, or perhaps in different environments of the same process, than are the heavier trans-iron elements. Regardless of the exact circumstances, this high [Mo/Ge] ratio in metal-poor dwarfs must return quite quickly to the solar ratio as iron abundance increases above [Fe/H] = −1.5. Consequently, despite the obscurity surrounding the mechanisms of the production of trans-Fe elements, our work nonetheless offers the promise that abundance determinations of molybdenum and germanium in the same stars as heavier trans-Fe elements might provide a long-sought way to identify the population from which a given star originated.
7. Summary
We have obtained new high-resolution, high-signal to noise UV spectroscopic observations employing the E230H grating of STIS onboard HST of the metal-poor turnoff stars HD 19445 and HD 140283 below 2000 Å. For these stars plus HD 84937, HD 94028, and HD 160617, we have analyzed similar UV spectra obtained for them previously to determine abundances for the lightest heavy elements, Ge, As, Se, Mo, Cd, and Sn. Concurrent analysis of optical archival spectra have yielded the abundances of Sr, Y, and Zr, along with the heavy elements Ba and Eu.
Comparing the results from our two separate approaches indicates that the largest source of recognizable systematic error in the UV arises from the continuum placement in crowded regions. Comparisons with other studies indicate that the choice of trans-Fe lines for analysis and the choice of gf-values for those lines often contribute to systematic differences, once again affecting crowded regions the most.
For germanium in particular, we show that the inclusion of newly identified Fe I lines (Peterson & Kurucz 2015; Peterson et al. 2017, and in prep.) aids in deconvolving the blending of weak lines and in continuum placement, but that as yet unidentified lines can still be influential, especially in the 2650–2700 Å region.
Again concerning germanium, our calculations that do incorporate newly identified Fe I lines confirm that the Li et al. (1999)gf-values are on a consistent scale for the eight lines examined. These include the Ge I 3039 Å line most often adopted in analyzing giants, which will enable results for dwarfs and giants to be placed on a more reliably consistent scale. Other elements, notably Mo, would also benefit from improved gf-value scales.
From the reanalysis of optical archival spectra for these stars, we present abundances for the trans-Fe elements Sr, Y, and Zr, and the heavier elements Eu and Ba, which are largely due to the r-process and s-process respectively. Their inclusion enables us to examine patterns of light-Fe and heavy r-process elemental abundances together, to better constrain nucleosynthesis calculations and overall observational trends.
In contrast to the regular pattern exhibited by the r-process elements in metal-poor stars (Sneden et al. 2008), the lighter elements studied here show a wide diversity of the excess or deficiency of a particular element versus iron. While this is already known, it remains subject to a range of interpretations.
The abundance of germanium with respect to that of iron ranges from the solar level to a deficiency of almost a factor of ten. The strongest abundance excesses with respect to iron are seen in molybdenum, first noted by Peterson (2011). Neither the germanium deficiency nor the molybdenum excess is correlated with metallicity in this work, nor are such correlations generally seen in other studies of their respective abundances.
Surprisingly, we find that these two elemental abundances are strongly correlated with one another. Compared to the solar proportion, molybdenum is an order of magnitude more abundant than germanium in all five metal-poor stars studied here.
With measurements of a larger number of trans-iron elements, we uncover another unexpected result as well. The trans-iron elements exhibit an odd-even effect, in both the Ge-As-Se and the Sr-Y-Zr elemental trios, in which the element with odd Z shows a reduced abundance relative to its even-Z neighbors. This tendency increases as metallicity decreases, as we show most clearly by evaluating Sr-Y-Zr measurements from our independent earlier optical studies of metal-poor stars.
Abundance definitions: Iron abundance [Fe/H] = NFe/NH. [Fe/H] = log(NFe/NH)star − log(NFe/NH)Sun. For element X, [X/Fe] = log(NX/ NFe)star − log(NX/NFe)Sun. A(X) = log[(N(X)/N(H))]+12.
Acknowledgments
We are indebted to Don Morton for the verification of oscillator strengths adopted in Table 3 for this work. We also thank Jim Lawler and the anonymous referee for their comments. Support for RCP for this work was provided by NASA through GO grant numbers 14161, 14762, and 15179 from the Space Telescope Science Institute, which is operated by AURA, Inc., under NASA contract NAS 5-26555. MS is supported by the “Programme National de Physique Stellaire” and the “Programme National de Cosmologie et Galaxies (PNCG)” (CNRS-INSU). BB acknowledges partial financial support from FAPESP, CNPq, and CAPES – Financial code 001. This work is based on ultraviolet spectral observations made with the NASA/ESA Hubble Space Telescope, and obtained from the data archive at the Space Telescope Science Institute. STSci is operated by the Association of Universities for Research in Astronomy, Inc. under NASA contract NAS 5-26555. It is also based on optical spectral observations made primarily at the European Organisation for Astronomical Research in the Southern Hemisphere under ESO programs 065.L-0507(A), 067.D-0439(A), 068.D-0094(A) (PI Primas); 066.C-0220(A) (PI Sarre); 072.B-0585(A), 074.B-0639(A) (PI Silva); 076.B-0133(A) (PI Pasquini); 0101.A-0229(A) (PI Spite); and 266.D-5655(A); along with a spectrum from program 11AB01 (PI Barbuy) from the Canada-France-Hawaii Telescope (CFHT), which is operated by the National Research Council (NRC) of Canada, the Institut National des Sciences de l’Univers of the Centre National de la Recherche Scientifique (CNRS) of France, and the University of Hawaii; and a spectrum acquired at the Télescope Bernard Lyot (TBL) at Pic du Midi Observatory with the spectrograph NARVAL under program L172N04 (PI Spite).
References
- Abbott, B. P., Abbott, R., Abbott, T. D., et al. 2017a, Phys. Rev. Lett., 119, 161101 [NASA ADS] [CrossRef] [PubMed] [Google Scholar]
- Abbott, B. P., Abbott, R., Abbott, T. D., et al. 2017b, ApJ, 848, L13 [NASA ADS] [CrossRef] [Google Scholar]
- Alvarez, R., & Plez, B. 1998, A&A, 330, 1109 [NASA ADS] [Google Scholar]
- Aoki, M., Ishimaru, Y., Aoki, W., & Wanajo, S. 2017, ApJ, 837, 8 [NASA ADS] [CrossRef] [Google Scholar]
- Andrievsky, S. M., Spite, M., Korotin, S. A., et al. 2007, A&A, 464, 1081 [NASA ADS] [CrossRef] [EDP Sciences] [Google Scholar]
- Arcones, A., & Montes, F. 2011, ApJ, 731, 5 [NASA ADS] [CrossRef] [Google Scholar]
- Asplund, M., Grevesse, N., Sauval, A. J., & Scott, P. 2009, ARA&A, 47, 481 [NASA ADS] [CrossRef] [Google Scholar]
- Ballester, P., Modigliani, A., Boitquin, O., et al. 2000, The Messenger, 101, 31 [NASA ADS] [Google Scholar]
- Banerjee, P., Qian, Y.-Z., & Heger, A. 2017, ApJ, 865, 120 [Google Scholar]
- Barbuy, B., Spite, M., Hill, V., et al. 2011, A&A, 534, A60 [NASA ADS] [CrossRef] [EDP Sciences] [Google Scholar]
- Bertolli, M. G., Herwig, F., Pignatari, M., & Kawano, T. 2013, ArXiv e-prints [arXiv:1310.4578] [Google Scholar]
- Bisterzo, S., Travaglio, C., Gallino, R., Wiescher, M., & Käppeler, F. 2014, ApJ, 787, 10 [NASA ADS] [CrossRef] [Google Scholar]
- Bisterzo, S., Travaglio, C., Wiescher, M., Käppeler, F., & Gallino, R. 2017, ApJ, 835, 97 [NASA ADS] [CrossRef] [Google Scholar]
- Bonifacio, P., Spite, M., Cayrel, R., et al. 2009, A&A, 501, 519 [NASA ADS] [CrossRef] [EDP Sciences] [Google Scholar]
- Brown, C. M., Ginter, M. L., Johansson, S., & Tilford, S. G. 1988, J. Opt. Soc. Am. B Opt. Phys., 5, 2125 [NASA ADS] [CrossRef] [Google Scholar]
- Castelli, F., & Kurucz, R. L. 2003, in Modelling of Stellar Atmospheres, eds. N. Piskunov, W. W. Weiss, & D. F. Gray (Cambridge: Cambridge Univ. Press), IAU Symp., 210, 20 [Google Scholar]
- Cescutti, G., Chiappini, C., Hirschi, R., Meynet, G., & Frischknecht, U. 2013, A&A, 553, A51 [NASA ADS] [CrossRef] [EDP Sciences] [Google Scholar]
- Cowan, J. J., & Rose, W. K. 1977, ApJ, 212, 149 [NASA ADS] [CrossRef] [Google Scholar]
- Cowan, J. J., Sneden, C., Beers, T. C., et al. 2005, ApJ, 627, 238 [NASA ADS] [CrossRef] [Google Scholar]
- Cowan, J. J., Sneden, C., Lawler, J. E., et al. 2019, Rev. Mod. Phys., submitted [arXiv:1901.01410] [Google Scholar]
- Dekker, H., D’Odorico, S., Kaufer, A., Delabre, B., & Kotzlowski, H. 2000, Proc. SPIE, 4008, 534 [Google Scholar]
- Farouqi, K., Kratz, K.-L., & Pfeiffer, B. 2009a, PASA, 26, 194 [NASA ADS] [CrossRef] [Google Scholar]
- Farouqi, K., Kratz, K.-L., Mashonkina, L. I., et al. 2009b, ApJ, 694, L49 [NASA ADS] [CrossRef] [Google Scholar]
- Farouqi, K., Kratz, K.-L., Pfeiffer, B., et al. 2010, ApJ, 712, 1359 [NASA ADS] [CrossRef] [Google Scholar]
- François, P., Depagne, E., Hill, V., et al. 2007, A&A, 476, 935 [NASA ADS] [CrossRef] [EDP Sciences] [Google Scholar]
- Frischknecht, U., Hirschi, R., Pignatari, M., et al. 2016, MNRAS, 456, 1803 [NASA ADS] [CrossRef] [Google Scholar]
- Gallino, R., Bisterzo, S., Straniero, O., Ivans, I. I., & Käppeler, F. 2006, Mem. Soc. Astron. It., 77, 786 [Google Scholar]
- Gray, D. F. 2005, The Observation and Analysis of Stellar Photospheres, 3rd edn. (Cambridge, UK: Cambridge University Press) [CrossRef] [Google Scholar]
- Grevesse, N., Scott, P., Asplund, M., & Sauval, A. J. 2015, A&A, 573, A27 [NASA ADS] [CrossRef] [EDP Sciences] [Google Scholar]
- Gustafsson, B., Edvardsson, B., Eriksson, K., et al. 2008, A&A, 486, 951 [NASA ADS] [CrossRef] [EDP Sciences] [Google Scholar]
- Hannaford, P., Lowe, R. M., Grevesse, N., et al. 1982, ApJ, 261, 736 [NASA ADS] [CrossRef] [Google Scholar]
- Hansen, C. J., Montes, F., & Arcones, A. 2014, ApJ, 797, 123 [NASA ADS] [CrossRef] [Google Scholar]
- Hill, V., Plez, B., Cayrel, R., et al. 2002, A&A, 387, 560 [NASA ADS] [CrossRef] [EDP Sciences] [Google Scholar]
- Hirschi, R., Maeder, A., Meynet, G., Chiappini, C., & Ekström, S. 2007, EAS Pub. Ser., 24, 263 [NASA ADS] [CrossRef] [EDP Sciences] [Google Scholar]
- Käppeler, F., Gallino, R., Busso, M., Picchio, G., & Raiteri, C. M. 2011, Rev. Mod. Phys., 83, 157 [NASA ADS] [CrossRef] [EDP Sciences] [Google Scholar]
- Kratz, K.-L., Farouqi, K., Pfeiffer, B., et al. 2007, ApJ, 662, 39 [NASA ADS] [CrossRef] [MathSciNet] [Google Scholar]
- Kurucz, R. L. 1993, CD-ROM 18, “SYNTHE Spectrum Synthesis Programs and Line Data” (Cambridge: Smithsonian Astrophycal Obs.), Available at http://kurucz.harvard.edu [Google Scholar]
- Kurucz, R. L. 2004, Mem. Soc. Astron. It., 75, 1 [Google Scholar]
- Li, Z.-S., Norin, J., Persson, A., et al. 1999, Phys. Rev. A, 60, 198 [CrossRef] [Google Scholar]
- Limongi, M., Chieffi, A., & Bonifacio, P. 2003, ApJ, 594, L123 [CrossRef] [Google Scholar]
- Lodders, K. 2010, in Principles and Perspectives in Cosmochemistry, eds. A. Goswami, & B. E. Reddy (Berlin: Springer-Verlag), 379 [CrossRef] [Google Scholar]
- Ljung, G., Nilsson, H., Asplund, M., et al. 2006, A&A, 456, 1181 [NASA ADS] [CrossRef] [EDP Sciences] [Google Scholar]
- Mashonkina, L., Christlieb, N., Barklem, P. S., et al. 2019, A&A, 516, A46 [Google Scholar]
- Meynet, G., Ekström, S., & Maeder, A. 2006, A&A, 447, 623 [NASA ADS] [CrossRef] [EDP Sciences] [Google Scholar]
- Morton, D. C. 2000, ApJS, 130, 403 [NASA ADS] [CrossRef] [MathSciNet] [Google Scholar]
- Niu, P., Cui, W., & Zhang, B. 2015, ApJ, 813, 56 [NASA ADS] [CrossRef] [Google Scholar]
- Peterson, R. C. 2011, ApJ, 742, 21 [NASA ADS] [CrossRef] [Google Scholar]
- Peterson, R. C. 2013, ApJ, 768, L13 [NASA ADS] [CrossRef] [Google Scholar]
- Peterson, R. C., & Kurucz, R. L. 2015, ApJS, 216, 1 [Google Scholar]
- Peterson, R. C., Dorman, B., & Rood, R. T. 2001, ApJ, 559, 372 [NASA ADS] [CrossRef] [Google Scholar]
- Peterson, R. C., Kurucz, R. L., & Ayres, T. R. 2017, ApJS, 229, 23 [NASA ADS] [CrossRef] [Google Scholar]
- Plez, B. 2012, Astrophysics Source Code Library [record ascl:1205.004] [Google Scholar]
- Ritter, C., Herwig, F., Jones, S., et al. 2018, MNRAS, 480, 538 [NASA ADS] [CrossRef] [Google Scholar]
- Roederer, I. U. 2012, ApJ, 756, 36 [NASA ADS] [CrossRef] [Google Scholar]
- Roederer, I. U. 2017, ApJ, 835, 23 [NASA ADS] [CrossRef] [Google Scholar]
- Roederer, I. U., & Lawler, J. E. 2012, ApJ, 750, 76 [NASA ADS] [CrossRef] [Google Scholar]
- Roederer, I. U., Lawler, J. E., Sobeck, J. S., et al. 2012, ApJS, 203, 27 [NASA ADS] [CrossRef] [Google Scholar]
- Roederer, I. U., Schatz, H., Lawler, J. E., et al. 2014, ApJ, 791, 32 [NASA ADS] [CrossRef] [Google Scholar]
- Roederer, I. U., Karakas, A. I., Pignatari, M., & Herwig, F. 2016, ApJ, 821, 37 [NASA ADS] [CrossRef] [Google Scholar]
- Roederer, I. U., Hattori, K., & Valluri, M. 2018a, AJ, 156, 179 [NASA ADS] [CrossRef] [Google Scholar]
- Roederer, I. U., Sneden, C., Lawler, J. E., et al. 2018b, ApJ, 860, 125 [NASA ADS] [CrossRef] [Google Scholar]
- Siegel, D. M., Barnes, J., & Metzger, B. D. 2019, Nature, 569, 241 [NASA ADS] [CrossRef] [Google Scholar]
- Simmerer, J., Sneden, C., Cowan, J. J., et al. 2004, ApJ, 617, 1091 [NASA ADS] [CrossRef] [Google Scholar]
- Siqueira Mello, C., Spite, M., Barbuy, B., et al. 2013, A&A, 550, A122 [NASA ADS] [CrossRef] [EDP Sciences] [Google Scholar]
- Siqueira Mello, C., Hill, V., Barbuy, B., et al. 2014, A&A, 565, A93 [NASA ADS] [CrossRef] [EDP Sciences] [Google Scholar]
- Siqueira Mello, C., Andrievsky, S., Barbuy, B., et al. 2015, A&A, 584, A86 [NASA ADS] [CrossRef] [EDP Sciences] [Google Scholar]
- Sneden, C., McWilliam, A., Preston, G. W., et al. 1996, ApJ, 467, 819 [NASA ADS] [CrossRef] [Google Scholar]
- Sneden, C., Cowan, J. J., Lawler, J. E., et al. 2003, ApJ, 591, 936 [NASA ADS] [CrossRef] [Google Scholar]
- Sneden, C., Cowan, J. J., & Gallino, R. 2008, ARA&A, 46, 241 [NASA ADS] [CrossRef] [EDP Sciences] [Google Scholar]
- Spite, M., Peterson, R. C., Gallagher, A. J., et al. 2017, A&A, 600, A26 [NASA ADS] [CrossRef] [EDP Sciences] [Google Scholar]
- Spite, F., Spite, M., Barbuy, B., et al. 2018, A&A, 611, A30 [NASA ADS] [CrossRef] [EDP Sciences] [Google Scholar]
- Travaglio, C., Gallino, R., Arnone, E., et al. 2004, ApJ, 601, 864 [NASA ADS] [CrossRef] [Google Scholar]
- Truran, J. W. 1981, A&A, 97, 391 [NASA ADS] [Google Scholar]
- Wanajo, S. 2007, ApJ, 666, L77 [NASA ADS] [CrossRef] [Google Scholar]
- Wanajo, S. 2013, ApJ, 770, L22 [NASA ADS] [CrossRef] [Google Scholar]
- Wanajo, S., Janka, H.-T., & Müller, B. 2011, ApJ, 726, L15 [NASA ADS] [CrossRef] [Google Scholar]
- Warner, B. 1968a, MNRAS, 139, 115 [NASA ADS] [Google Scholar]
- Warner, B. 1968b, MNRAS, 140, 53 [NASA ADS] [Google Scholar]
- Watson, D., Hansen, C. J., Selsing, J., et al. 2019, Nature, 574, 497 [NASA ADS] [CrossRef] [Google Scholar]
- Winteler, C. R., Käppeli, A., Perego, A., et al. 2012, ApJ, 750, L22 [NASA ADS] [CrossRef] [Google Scholar]
- Woosley, S. E., & Weaver, T. A. 1995, ApJS, 101, 181 [NASA ADS] [CrossRef] [Google Scholar]
All Tables
Lines and line parameters adopted are given, along with abundances A(X) derived from them for each star analyzed in this work.
All Figures
|
Fig. 1. Spectra for the five stars are plotted in the region of the Sn II 1899.898 Å line, where unidentified lines are numerous and strong. Each of Figs. 1−15 compares the observed spectrum (heavy black line) with the two calculations, one lacking newly identified Fe I lines (thin black line) and one including them (light blue line). The Y scale on the left is for the bottom comparison. The others have the same vertical scaling factor; ticks on the Y axis indicate a displacement of 0.1 full scale. At the bottom is the wavelength in Å. At the top, aligned with line wavelength, are listed the line parameters for the strongest lines in the best-fit calculation of the bottom spectrum. Following the decimal digits of the wavelength are given the species, the lower excitation potential in eV, the decimal digits of the core residual intensity of the unbroadened spectrum, and the log gf-value adopted. Lines of trans-Fe species are highlighted in red, and those of newly identified Fe I in light blue. Purple lines indicate light-blue calculations with a ±0.3 change in the adopted abundances of each trans-Fe element. |
| In the text | |
|
Fig. 2. Spectra of the Ru II 1888.064 Å and As I 1890.429 Å lines. |
| In the text | |
|
Fig. 3. Spectra near the As I lines at 1937.594 Å (left panel) and at 1972.624 Å (right panel). |
| In the text | |
|
Fig. 4. Spectra near the Cd I 2288.018 Å line; that of HD 19445 is E230M. Data for HD 160617 are lacking in this region. |
| In the text | |
|
Fig. 5. Spectra in the region of the Cd II 2144.393 Å line. The poor fit for the two bottom spectra illustrates the effect of omitting its hyperfine splitting for this plot. |
| In the text | |
|
Fig. 6. Spectra in the region of the Se I 1960.893 Å line. |
| In the text | |
|
Fig. 7. Spectra in the region of the Se I 2074.794 Å line. |
| In the text | |
|
Fig. 8. Spectra in the region of the Ge I 1998.887 Å line. |
| In the text | |
|
Fig. 9. Spectra near the Ge I 2065.215 Å line. Here and in Figs. 7, 10, 14, and 15, the GO-7348 spectrum for HD 140283 appears above that of GO-14672. |
| In the text | |
|
Fig. 10. Spectra in the region of the Ge I 2094.258 Å line. |
| In the text | |
|
Fig. 11. Spectra in the region of the Ge I 2651.568 Å line. In this region and those of Figs. 12 and 13, data for HD 160617 are lacking, and are from a lower-resolution E230M spectrum for 19445. The effect of weak newly identified and unidentified Fe I lines is evident in the three E230H spectra; their effect persists but is difficult to discern at the E230M resolution. |
| In the text | |
|
Fig. 12. Spectra in the region of the Ge I 2709.624 Å line. Unidentified lines are still present but less prominent here than in Fig. 11. |
| In the text | |
|
Fig. 13. Spectra in the region of the Ge I 3039.067 Å line. Unidentified lines are virtually absent even in the HD 94028 spectrum. |
| In the text | |
|
Fig. 14. Spectra covering the Mo II 2015.123 Å and 2020.324 Å lines. |
| In the text | |
|
Fig. 15. Spectra in the region of the Mo II 2038.452 Å, Se I 2039.842 Å and Ge I 2041.712 Å lines. |
| In the text | |
|
Fig. 16. Neutron-capture abundances observed in the four sample stars with [Fe/H] ≤ −1.8 (black squares) are compared to the predictions of the main r-process following Wanajo (2007) (hot and cold models; blue lines) and the predictions of the weak-r process (Wanajo 2013) with Proto-Neutron-Star masses M = 1.2 and 1.4 M⊙ (red dotted lines). |
| In the text | |
|
Fig. 17. Neutron-capture abundances observed in HD 94028 are compared to the predictions of the main r-process following Wanajo (2007, hot and cold models, blue lines) in the top panel; the solar abundance pattern (green line) in the middle panel; and the predictions of the combined s, modified r, and i-processes as computed by Roederer et al. (2016, their Figs. 6 and 7; red lines) in the bottom panel. |
| In the text | |
Current usage metrics show cumulative count of Article Views (full-text article views including HTML views, PDF and ePub downloads, according to the available data) and Abstracts Views on Vision4Press platform.
Data correspond to usage on the plateform after 2015. The current usage metrics is available 48-96 hours after online publication and is updated daily on week days.
Initial download of the metrics may take a while.