| Issue |
A&A
Volume 697, May 2025
|
|
|---|---|---|
| Article Number | A127 | |
| Number of page(s) | 12 | |
| Section | Stellar atmospheres | |
| DOI | https://doi.org/10.1051/0004-6361/202554123 | |
| Published online | 14 May 2025 | |
The R-Process Alliance: Hunting for gold in the near-UV spectrum of 2MASS J05383296–5904280★
1
Department of Astronomy, Stockholm University,
AlbaNova University Center,
106 91
Stockholm,
Sweden
2
Department of Physics, North Carolina State University,
Raleigh,
NC
27695,
USA
3
Joint Institute for Nuclear Astrophysics – Center for the Evolution of the Elements
(JINA-CEE),
USA
4
Department of Astronomy, University of Florida,
Bryant Space Science Center,
Gainesville,
FL
32611,
USA
5
Department of Physics and Astronomy, University of Notre Dame,
Notre Dame,
IN
46556,
USA
6
Department of Physics and Kavli Institute for Astrophysics and Space Research, Massachusetts Institute of Technology,
Cambridge,
MA
02139,
USA
7
Lawrence Livermore National Laboratory,
7000 East Avenue,
Livermore,
CA
94550,
USA
8
NSF NOIRLab,
Tucson,
AZ
85719,
USA
9
Department of Physics and Astronomy, San Francisco State University,
San Francisco,
CA
94132,
USA
10
Department of Astronomy & Astrophysics, University of Chicago,
5640 S Ellis Avenue,
Chicago,
IL
60637,
USA
11
Mitchell Institute for Fundamental Physics and Astronomy and Department of Physics and Astronomy, Texas A&M University,
College Station,
TX
77843-4242,
USA
12
Department of Physics, Zarqa University,
Zarqa
13110,
Jordan
13
Jordanian Astronomical Virtual Observatory, Zarqa University,
Zarqa
13110,
Jordan
14
Kavli Institute for Cosmological Physics, University of Chicago,
Chicago,
IL
60637,
USA
★★ Corresponding author: This email address is being protected from spambots. You need JavaScript enabled to view it.
Received:
13
February
2025
Accepted:
17
March
2025
Abstract
Context. Over the past few years, the R-Process Alliance (RPA) has successfully carried out a search for stars that are highly enhanced in elements produced via the rapid neutron-capture (r-) process. In particular, the RPA has identified a number of relatively bright, highly r-process-enhanced (r-II) stars, suitable for observations with the Hubble Space Telescope (HST), facilitating abundance derivation of elements such as gold (Au) and cadmium (Cd).
Aims. This paper presents the detailed abundances derived for the metal-poor ([Fe/H] = −2.55) highly r-process-enhanced ([Eu/Fe] = +1.29) r-II star 2MASS J05383296–5904280.
Methods. One-dimensional local thermodynamic equilibrium (LTE) elemental abundances were derived via equivalent width and spectral synthesis using high-resolution high signal-to-noise near-UV HST/STIS and optical Magellan/MIKE spectra.
Results. Abundances were determined for 43 elements, including 26 neutron-capture elements. In particular, abundances of the rarely studied elements Nb, Mo, Cd, Lu, Os, Pt, and Au are derived from the HST spectrum. These results, combined with RPA near-UV observations of two additional r-II stars, increase the number of Cd abundances derived for r-process-enriched stars from seven to ten and Au abundances from four to seven. A large star-to-star scatter is detected for both of these elements, highlighting the need for more detections enabling further investigations, specifically into possible non-LTE effects.
Key words: stars: abundances / stars: chemically peculiar / stars: kinematics and dynamics / stars: low-mass / stars: Population II
Based on observations made with the NASA/ESA Hubble Space Telescope, obtained at the Space Telescope Science Institute (STScI), which is operated by the Association of Universities for Research in Astronomy, Inc. (AURA) under NASA contract NAS 5-26555. These observations are primarily associated with program GO-15951. This paper also includes data gathered with the 6.5 meter Magellan Telescopes located at Las Campanas Observatory, Chile.
© The Authors 2025
 Open Access article, published by EDP Sciences, under the terms of the Creative Commons Attribution License (https://creativecommons.org/licenses/by/4.0), which permits unrestricted use, distribution, and reproduction in any medium, provided the original work is properly cited.
This article is published in open access under the Subscribe to Open model. This email address is being protected from spambots. You need JavaScript enabled to view it. to support open access publication.
1 Introduction
The origin and chemical evolution of elements such as gold and silver have long been investigated in nuclear astrophysics. These elements, along with half of the other isotopes heavier than iron, are produced via the rapid-neutron capture process or r-process. This process was predicted theoretically almost 70 years ago (Burbidge et al. 1957; Cameron 1957), but the astrophysical site(s) associated with it are still heavily debated. For decades, neutron star mergers (NSM) were strong candidates for at least one astrophysical r-process site (Lattimer & Schramm 1974). This was confirmed in 2017 when the Laser Interferometer Gravitational-Wave (LIGO) observatory detected a gravitational wave signal from an NSM (Abbott et al. 2017). Extensive photometric and spectroscopic observations of the corresponding kilonova (AT2017gfo/SSS17a) revealed a signal consistent with the decay of heavy-element isotopes produced in the merger (Drout et al. 2017). Potentially, 3–13 Earth masses of gold were produced in this event; however, there are large uncertainties in the assumed abundance composition resulting from this one event (Côté et al. 2018). Furthermore, galactic chemical-evolution models and the contents of neutron-capture elements in the oldest stars in the Milky Way (MW) halo and its satellites suggest that NSMs may not be the only site of r-process-element production (Côté et al. 2017). Since the discovery of AT2017gfo, a renewed interest in the r-process has resulted in a considerable effort from theorists to identify additional heavy-element production sites. Currently, in addition to NSMs and neutron star–black hole mergers (Lattimer & Schramm 1974; Surman et al. 2008; Wehmeyer et al. 2019), various types of supernovae (SNe), such as collapsars (Siegel et al. 2019), magneto-rotationally driven SNe (Fujimoto et al. 2008), and common-envelope jet SNe (Grichener & Soker 2019) have also been suggested, and most recently magnetar giant flares have been added to the list of possible r-process element production sites (Patel et al. 2025).
Since direct observations of r-process-element production sites such as NSMs and exotic SNe are still very sparse, and new observations will be difficult to obtain as these events are rare (and often also faint), we need to look in other places for clues concerning the details of the r-process. One such probe is the abundances of the oldest and most metal-poor stars in the MW. The chemical compositions of these stars, mapped through detailed abundance analyses, provide a direct fingerprint of the elements produced by the stellar generation(s) prior to their birth.
In 2016, The r-Process Alliance (RPA) initiated a successful search for r-process-enriched stars to investigate the r-process. In the first five data release papers (Hansen et al. 2018; Sakari et al. 2018a; Holmbeck et al. 2020; Ezzeddine et al. 2020; Bandyopadhyay et al. 2024) the RPA has identified over 70 highly r-process-enhanced r-II stars ([Eu/Fe] > + 0.7; Holmbeck et al. 2020) and several hundred moderately enhanced r-I stars (+0.3 < [Eu/Fe] ≤ 0.7; Holmbeck et al. 2020). For several of these stars, the RPA has been able to derive extremely detailed r-process-element abundance patterns, including more than 20 neutron-capture elements, for example for, for RAVE J203843.2– 002333 (Placco et al. 2017), RAVE J153830.9–180424 (Sakari et al. 2018b), HD 222925 (Roederer et al. 2018b, 2022b), 2MASS J09544277+5246414 (Holmbeck et al. 2018), 2MASS J14325334–4125494 (Cain et al. 2018), RAVE J094921.8–161722 (Gull et al. 2018), RAVE J183013.5– 455510 (Placco et al. 2020), 2MASS J1521399–3538094 (Cain et al. 2020), 2MASS J22132050–5137385 (Roederer et al. 2024), and 2MASS J00512646–1053170 (Shah et al. 2024), revealing new details on the r-process.
However, abundances for a number of neutron-capture elements, such as cadmium (Cd) and gold (Au), cannot be obtained from ground-based observations, as these elements only have absorption features in the near-ultraviolet (near-UV) region of the electromagnetic spectrum around 2000–3200 Å, for the conditions found in late-type stellar atmospheres and the typical abundances of these elements. Elements like Cd and Au could enable critical constraints on the nuclear properties of r-process nucleosynthesis. For instance, a recent result from the RPA proposed that select elements can be enhanced by fission-fragment deposition from transuranic elements (Roederer et al. 2023). However, the exact extent of elements affected by this deposition is less clear due to the limited number of abundances for elements like Cd and Au and the unconstrained, theoretical yields of transuranic nuclei. Hence, part of the RPA survey effort has also been focused on identifying relatively bright stars for which near-UV spectra can be obtained with the near-UV-sensitive Hubble Space Telescope (HST) to investigate the behavior of these additional neutron-capture elements in r-process-enriched stars.
Here, we present a detailed abundance analysis of the third RPA star observed in the near-UV with the HST, namely the warm horizontal-branch star 2MASS J05383296–5904280 (hereafter J0538), with [Fe/H] = − 2.55. The other two RPA stars with near-UV HST spectra are 2MASS J00512646–1053170, for which Shah et al. (2024) derived the highest Au enhancement found in an r-II star to date, and HD 222925, for which Roederer et al. (2022b) derived the most complete abundance pattern of any object outside the Solar System, including 42 neutron-capture elements. Abundances of Au have been derived for all three stars, almost doubling the number of Au abundances available for r-process-enriched stars in the literature (Cowan et al. 2002; Sneden et al. 2003; Barbuy et al. 2011; Roederer et al. 2012), allowing us, for the first time, to investigate the behavior of this element more systematically.
This paper is organized as follows. Section 2 describes the optical and near-UV observations of J0538. The analysis is described in Section 3. Section 4 presents our results, which are discussed in Section 5. Section 6 provides a summary.
2 Observations
2.1 Optical spectrum
Basic properties for J0538, including right ascension (RA), declination (Dec), and magnitudes, are listed in Table 1. The star was first observed as part of the RPA “snapshot” (R ∼ 30 000 and signal-to-noise (SNR) ∼30 at 4100 Å) survey (Hansen et al. 2018) on November 24, 2017, with the echelle spectrograph on the du Pont telescope (Bowen & Vaughan 1973). The analysis was published in the fourth RPA data release (Holmbeck et al. 2020), which determined a Eu abundance of [Eu/Fe] = +1.28, and a [Ba/Eu] = − 0.52, classifying it as an r-II star. A high-resolution, high SNR “portrait” spectrum was subsequently obtained with the MIKE spectrograph (Bernstein et al. 2003) on November 15, 2018. Two 1200-s exposures were obtained using the 0′.′5 × 5′.′0 slit and 2 ×1 binning, yielding a resolving power of R ∼ 55 000 in the blue and R ∼ 45 000 in the red, with a spectral coverage of 3330–5060 Å and 4850–9400 Å in the blue and red channels, respectively. The data were reduced using the CarPy software (Kelson 2003); the final spectrum has a SNR of 335 pix−1 at 4500 Å.
Properties of 2MASS J05383296–5904280.
2.2 Near-UV spectrum
A near-UV spectrum of J0538 was obtained with HST/STIS (Kimble et al. 1998; Woodgate et al. 1998) on April 16 and 21, 2020 (Hansen et al. 2019, GO-15951). The observations were carried out using the E230M echelle grating centered at 2707 Å, providing a wavelength coverage of ∼2275–3119 Å. The 0′.′2 ×0′.′06 slit was employed, yielding a resolving power of R ∼ 30 000. The star was observed over five orbits, with three orbits in the first visit and two in the second. The total exposure time over the five orbits was 3.63 hours. The spectra were processed automatically by the CALSTIS software package and downloaded from the Mikulski Archive for Space Telescopes. Each of the five spectra was cross-correlated against a spectrum of the star HD 84937 (Vhelio = −15.05 km s−1; Gaia Collaboration 2018), obtained with the same setup (Peterson et al. 2001, GO-7402), and then radial velocity-shifted to rest. The shifted spectra were then normalized and co-added, resulting in an SNR of 44 at 2707 Å in the final spectrum.
2.3 Radial velocities
Radial velocities determined for J0538 from the snapshot and portrait spectra are listed in Table 2; a clear radial-velocity variation is detected between the two observations, suggesting the star is part of a binary system. We, therefore, obtained additional spectra of the star with the MIKE spectrograph for radial-velocity measurements using the 0′.′7 × 0′.′5 slit and 2 × 2 binning. For each spectrum, we determine a radial velocity via order-by-order cross-correlation with a spectrum of the radial velocity standard star HD 122563 (Vhelio= − 26.13; Gaia Collaboration 2018), obtained with the same setting as the target star. Final velocities are listed in Table 2, along with the standard deviations and number of echelle orders used. The reported velocity is the mean of the individual velocities measured in the employed echelle orders, and σ is their standard deviation. Unfortunately, we are not able to compute an orbit for the system with the current set of radial-velocity measurements.
Heliocentric radial velocities measured for J0538
3 Stellar parameter determination and abundance analysis
The stellar parameters were determined following the standard RPA procedure (see, e.g., Roederer et al. 2022b; Shah et al. 2024). Effective temperatures Teff is derived from the Gaia G, BP, and RP bands and 2MASS K magnitudes using the colour-temperature relations from Mucciarelli et al. (2021). The Gaia magnitudes were de-reddened following Babusiaux et al. (2023), using the E(B − V) value listed in Table 1 obtained from the Schlafly & Finkbeiner (2011) dust maps. To de-redden the K magnitude, we use the extinction coefficient from McCall (2004). Following the Teff determination, we determine log g from the fundamental relation:
![Mathematical equation: \[\log g = 4\log {T_{eff}} + \log (M/{M_ \odot }) - 10.61 + 0.4\cdot(B{C_V} + {m_V} - 5\log (d) + 5 - 3.1\cdotE(B - V) - {M_{{\rm{bol}}, \odot }}).\]](/articles/aa/full_html/2025/05/aa54123-25/aa54123-25-eq1.png) (1)
(1)
Here, M is the mass of the star, assumed to be 0.8 ± 0.08 M , BCV is the bolometric correction in the V band (Casagrande & VandenBerg 2014), mV is the apparent V magnitude, d is the distance in parsecs from Bailer-Jones et al. (2021), and Mbol, ⊙ is the Solar bolometric magnitude, 4.75. The constant 10.61 is calculated from the Solar constants: log(Teff) ⊙ = 3.7617 and log g⊙ = 4.438. Finally, the model-atmosphere metallicity [M/H] and microturbulence ξ are determined from equivalent width (EW) measurements of Fe I and Fe II lines, using the [Fe II/H] abundance as the model atmosphere metallicity. The final stellar parameters are listed in Table 1. The uncertainty on the photo-metric Teff is determined as the 1σ standard deviation for Monte Carlo resamples of the input parameter values and similar for log g using the Teff input. The corresponding effects on [Fe/H] and ξ are determined by varying Teff and log g accordingly and redetermining [Fe/H] and ξ, which results in the following uncertainties: δTeff, δlog g, δ [Fe/H], δξ = 47 K, 0.07 dex, 0.04 dex, and 0.1 km s−1, respectively. We also determine the uncertainty on the stellar parameters arising from the scatter in the individual Fe I and Fe II line abundances used, resulting in δTeff, δlog g, δ [Fe/H], δξ = 36 K, 0.03 dex, 0.06 dex, and 0.17 km s−1, respectively. To reach the final parameter uncertainties listed in Table 1, we add these values in quadrature.
Abundances for J0538 have been derived via EW analysis and spectral synthesis using the analysis code SMHr1 to run the 1D radiative transfer code MOOG2 (Sneden 1973; Sobeck et al. 2011), assuming local thermodynamical equilibrium (LTE). We use α-enhanced ([α/Fe] = +0.4) ATLAS9 model atmospheres (Castelli & Kurucz 2003), and line lists generated from linemake3 (Placco et al. 2021); updates following Roederer et al. (2018b, 2022b) as input, and Solar abundances were taken from Asplund et al. (2009). The synthesis also includes isotopic shifts and hyperfine-structure (HFS) broadening, where applicable, employing the r-process isotopic ratios from Sneden et al. (2008). Table A.1 in the appendix lists the atomic data for the lines used in the analysis, along with the measured EW and derived abundance of each line.
Abundance summary for J0538.
UV abundance summary for J0538.
Abundance uncertainties for J0538.
4 Results
We derive abundances for 43 elements across 51 species. Table 3 lists the final one-dimensional (1D) and LTE abundances and associated uncertainties. For 30 species, we identified and analyzed lines in the near-UV spectrum. Abundances derived for these elements are listed explicitly in Table 4. Below, we highlight possible corrections to these abundances due to departure from the LTE assumption employed in this work. However, we leave it up to the reader to decide which corrections to employ when using the abundances listed in Tables 3 and 4. The abundance uncertainties are determined by propagating through the stellar-parameter uncertainties, following the procedure outlined in Ji et al. (2020). This method performs a line-by-line analysis and includes both statistical and systematic uncertainties. In addition to stellar-parameter uncertainties, we add in quadrature a 0.2 dex uncertainty to all abundances derived from two or fewer lines and 0.1 dex to all abundances to account for continuum placement, atomic data uncertainties, and other systematic uncertainties. A summary of all the uncertainties calculated for each species is listed in Table 5.
4.1 Elements from oxygen to zinc
We derive abundances for 17 elements from O to Zn. In addition, we derive 3-σ upper limits on C from the CH-G band ([C/Fe] < − 0.97), on N from the NH 3360 Å band ([N/Fe] < +0.77), and Cu from the 5105 Å line ([Cu/Fe] < −0.69). Figure 1 shows the derived abundances for light elements in J0538 (pink stars) compared to those of the other two RPA stars with HST spectra (HD 222925: green crosses (Roederer et al. 2022b), 2MASS J00512646–1053170: blue squares) (Shah et al. 2024), and abundances from MW halo stars (grey dots) (Roederer et al. 2014a). For Na and K, we plot the non-LTE corrected abundances. We have corrected the Na and K abundances for J0538 following Lind et al. (2011) (Na) and Reggiani et al. (2019) (K), resulting in corrections of − 0.58 dex for Na and − 0.20 dex for K. The abundances of the light elements in the three RPA HST stars agree quite well with those of the general MW halo population.
For eight elements, we derive abundance estimates from lines of neutral and singly ionized atoms facilitated by the HST spectrum for the elements Al, Si, Co, and Ni, as shown in Figure 2. The abundances derived from the different ionization states deviate for some of these elements, likely due to departures from the LTE assumption employed in this work. For Al, we find [Al I/Fe] = − 0.57 and [Al II/Fe] = +0.02, where the ratios indicate the total Al abundance of the star inferred from the neutral and singly ionized species. The difference between our Al abundances corresponds to the non-LTE correction for Al I of +0.53 dex found by Lind et al. (2022) for the bench-mark star with similar parameters, HD 140283 (Teff = 5792 K, log g = 3.65, [Fe/H] = − 2.38).
We find a 0.45 dex difference between our Si I and Si II abundances. The only non-LTE calculations we could find for Si are for the optical 3905 Å Si I line, where the Max Planck Institute for Astronomy (MPIA) based non-LTE correction tool4 finds no correction for J0538, based on the grid from Bergemann et al. (2013). It should be noted that Den Hartog et al. (2023) did not find such large differences in the abundances derived from near-UV Si I and Si II lines for their five metal-poor stars, so the origin of the discrepancy we find is not readily apparent. We find good agreement between our Ti I and Ti II and Co I and Co II abundances, potentially with slightly higher abundances derived from the Co I lines, similar to the result found be Cowan et al. (2020). The recent work by Mallinson et al. (2022), however, suggests that a non-LTE correction of +0.22 dex should be applied to the Ti I, and +0.03 dex to the Ti II abundances of the benchmark star HD 140283 (same as the one used above for Al). In addition, non-LTE corrections for Co as high as +0.6 to +0.8 dex was found for Co I lines in metal-poor stars by Bergemann et al. (2010). In our analysis, we find larger offsets between abundances from neutral and single ionized species of Cr, Mn, and Ni compared to Ti and Co. Using the MPIA-based non-LTE correction tool, we find non-LTE corrections of +0.65 to +0.88 dex for the Cr I lines used in this analysis, based on the grid from Bergemann & Cescutti (2010), which are significantly larger than the 0.31 dex abundance offset we find between Cr I and Cr II. Using the same tool, we find corrections of +0.4 to +0.6 dex for the Mn I lines used, based on the grid from Bergemann & Gehren (2008), closer to our abundance offset of 0.24 dex. Again, the offset we find between abundances derived from neutral and singly ionized lines of Cr and Mn agree with the offsets found in the detailed study of iron-peak elements by Cowan et al. (2020). Finally, Eitner et al. (2023) recently computed the non-LTE effects for Ni and determined a correction of +0.15 dex for Ni I abundances for stars in our atmospheric parameter regime, bringing our Ni I abundances closer to the Ni II value.
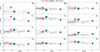 |
Fig. 1 Derived [X/Fe] abundances for the three RPA stars observed with the HST: J0538 (pink star, this work), HD 222925 (green cross, Roederer et al. 2022b), and 2MASS J00512646–1053170 (blue square, Shah et al. 2024), compared to stellar abundances from the MW halo (grey dots; Roederer et al. 2014a). |
4.2 Neutron-capture elements
We derive abundances for 26 neutron-capture elements from Sr to Th, including abundances of Nb, Mo, Cd, Lu, Os, Pt, and Au, exclusively derived from the near-UV HST spectrum. Figure 2 shows the synthesis of selected lines of these elements. We note that of the five Sr II lines we detect in the spectrum at 3464, 4077, 4161, 4215, and 4305 Å, abundances derived from the two commonly used resonance lines (4077 and 4215 Å) are ∼ 1 dex higher than the abundances derived from the remaining three lines. We, therefore, choose to exclude these two lines when calculating the final Sr II abundances for the star. Unfortunately, it was not possible to derive abundances or constraining upper limits for the neutron-capture elements Ru, Rh, Pd, Ag, Te, Ir, Pb, and U; we, therefore, provide 3σ upper limits for these elements in Table 3. Figure 3 shows the log ϵ(X) abundances of the neutron-capture elements detected in J0538 as a function of atomic number compared to the Solar r- and s-process abundances patterns. A good agreement with the r-process pattern is seen, confirming the r-process origin of the neutron-capture elements in the atmosphere of this star. This is further supported by the low [Ba/Eu] ratio of [Ba/Eu] = −0.56 found in the star.
Discussion
J0538 is the third r-II star for which the RPA has obtained near-UV spectra with the HST. In all three stars, we have derived abundances of Cd and Au, increasing the sample of Cd abundances in r-process-enriched stars from seven to ten and Au abundances from four to seven. In the following, we discuss the abundance signatures of Cd and Au for r-process-enriched stars in relation to two recent RPA discoveries, namely the universal light r-process-element pattern (Roederer et al. 2022a) and the fission-fragment deposition signature (Roederer et al. 2023). Figures 4 and 5 show the neutron-capture element abundances derived for the three RPA HST stars: J0538 (pink circles), HD 222925 (green circles) and 2MASS J00512646–1053170 (blue circles), along with literature stars (black circles) with Cd (Figure 4) and Au (Figure 5) abundances derived, compared to the “baseline” pattern from Roederer et al. (2023) (grey lines), determined from r-process-enriched stars with [Eu/Fe] ≤ +0.3 that do not display the fission fragment enhancement signature. Following Roederer et al. (2023), elements from Sr to Cd are scaled to Zr, while the heavy neutron-capture elements from Ba to Au are scaled to Ba. The circle sizes are correlated with the [Eu/Fe] ratios, such that the larger circles represent the stars with higher [Eu/Fe] ratios, and smaller circles represent those with lower [Eu/Fe] ratios, as in Roederer et al. (2023).
5.1 Light r-process elements, including Cd
Roederer et al. (2022a) showed that by scaling the light r-process elements (Se to Te) to Zr, instead of scaling the full pattern to Eu as in most previous studies (e.g. Sneden et al. 2008), a consistent pattern for the elements from Sr to Mo emerges for r-process-enriched stars, implying a local universality in the production of these elements. In Figure 4, we plot the abundances of the light r-process elements in the three RPA HST stars and literature r-process-enriched stars with Cd derived abundances. The literature stars included in Figure 4 are HD 140283 (log ϵ(Cd) = − 1.46; Peterson et al. 2020), HD 128279 (log ϵ(Cd) = − 1.38; Roederer et al. 2012, 2014b, 2022a), HD 19445 (log ϵ(Cd) = −0.36; Peterson et al. 2020), HD 84937 (log ϵ(Cd) = −0.36; Peterson et al. 2020), HD 160617 (log ϵ(Cd) = −0.03; Roederer & Lawler 2012; Peterson et al. 2020), HD 108317 (log ϵ(Cd) = − 1.15; Roederer et al. 2012, 2014b, 2022a), and BD+17◦3248 (log ϵ(Cd) = +0.99; Cowan et al. 2002; Sneden et al. 2009; Den Hartog et al. 2005; Roederer et al. 2022a). From the inspection of Figure 4, the three RPA HST stars and the literature sample all agree with the recently discovered universality among light r-process elements extending up to Mo (Roederer et al. 2022a). For the elements from Ru to Ag, Figure 4 shows a scatter in the abundances, which was attributed by Roederer et al. (2023) to fission-fragment deposition. For increasing Eu abundances, the fission-fragment deposition results in an increase of the abundances of these elements above the baseline pattern (grey line), which represents an empirical pattern without fission-fragment deposition. Moving on to the Cd abundances, a much larger spread between the stars and no clear correlation with Eu abundances is seen. This spread is somewhat driven by the very high Cd abundance derived for 2MASS J00512646–1053170 of [Cd/Fe] = +1.27 by Shah et al. (2024). Shah et al. (2024) investigated this spread and found correlations of the derived Cd abundances with the stellar parameters Teff and log g of these stars, suggesting that non-LTE effects might affect the Cd abundances. The Cd abundance we derive for J0538 of [Cd/Fe] = +0.52, along with the Teff and log g for J0538, follows the correlations found in Shah et al. (2024), thus supporting the suspected non-LTE effects.
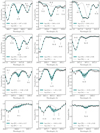 |
Fig. 2 Comparison of synthesized and observed spectra (black squares) for selected absorption features in the near-UV spectrum and Th. The blue line is the best-fit synthesis, the blue band shows the uncertainty, and the dotted line is a synthesis without the given element. |
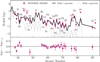 |
Fig. 3 Absolute abundances for neutron-capture elements derived for J0538 compared to scaled Solar System r-(solid) and s-process (dashed) abundances, taken from Sneden et al. (2008). Downwards pointing triangles denote upper limits. The stellar abundances most closely match the Solar System r-process abundance pattern. |
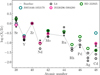 |
Fig. 4 Absolute abundances of light r-process elements for the three RPA stars observed with the HST (pink, green, and blue circles) and literature stars (black circles) with Cd detections compared to the baseline pattern from Roederer et al. (2023) (grey line), scaled to Zr. The circle size is correlated with the Eu abundances of the stars. Elements from Sr to Mo follow the universal light element pattern, while signatures of fission-fragment deposition are seen for Ru to Ag. Cd displays a large scatter and no clear correlation with Eu abundances. |
5.2 Heavy r-process elements, including Au
The behavior of the heavy r-process elements is investigated with Figure 5, where we include the four r-process-enriched stars present in the literature with Au abundances preceding RPA work: HD 108317 (log ϵ(Au) = − 1.64; Roederer et al. 2012, 2014b, 2022a), BD+17◦3248 (log ϵ(Au) = − 0.60; Roederer et al. 2022a), CS 22892–052 (log ϵ(Au) = − 0.90; Sneden et al. 2003), and CS 31082–001 (log ϵ(Au) = − 1.00; Siqueira Mello et al. 2013). We note that only two literature stars, namely HD 108317 and BD+17◦3248, appear both in Figures 4 and 5; the RPA has thus more than doubled the number of r-process-enriched stars for which abundances of both Cd and Au has been derived. Similar to Cd, Figure 5 shows a somewhat larger scatter for Au compared to the other heavy r-process elements and no clear correlation between an increased Au abundance and an increased Eu abundance. The standard deviation of the plotted log ϵ(Au/Ba) ratios is 0.31, similar to the uncertainty on the Au abundances reported by most of the studies included. In comparison, the 1σ values for log ϵ(Os/Ba), log ϵ(Ir/Ba), and log ϵ(Pt/Ba) are 0.24, 0.15, and 0.15 respectively. If we investigate the scatter within the third peak alone, we find 1σ values for log ϵ(Os/Au) and log ϵ(Pt/Au) of 0.25 and 0.24, respectively, very close to the value for log ϵ(Au/Ba), pointing to an element-to-element scatter present within the third-peak elements, and not just with respect to Ba.
Several studies have found that the shape and position of the third r-process peak are highly influenced by the choice of fission model, fission-fragment distribution, and adopted β-decay rates (Surman & Engel 2001; Lund et al. 2023). For example, beta-delayed neutron emission can lead to late-time neutron capture, affecting the third peak (Eichler et al. 2015). Roederer et al. (2023) found a correlation between the abundance of Eu and the third-peak elements Os and Pt in their sample of r-process-enriched stars, suggesting that the ratios of these elements to Eu are possibly affected by fission-fragment deposition or naturally require a more neutron-rich r-process for their production in the first place. Au was not included in that study due to the small number of abundances derived for this element. However, the large spread in Au abundances seen in Figure 5 highlights Au as an element needing further investigation.
The Au abundances in all of these stars use the Au I line at 2675 Å, and all but one uses the atomic data from Hannaford et al. (1981), log g f = −0.45; the study of HD 108317 uses atomic data from Fivet et al. (2006) with an almost identical log g f = − 0.47. However, while this study and that of 2MASS J00512646–1053170, HD 222925, and BD+17◦3248 include HFS (Demidov et al. 2021), HFS was not considered in the earlier studies of HD 108317, CS 31081-001, and CS 22892-052. We tested the effect of excluding the HFS components from our line list and found a change in the Au abundance of J0538 of − 0.05 dex. Hence, this is not likely the source of the spread seen in the Au abundances between these stars. However, the Au I line at 2675 Å is affected by blends of other species, so different choices by authors about how to treat these blends in the spectrum synthesis could affect the final derived abundances. We investigated adding the blending Fe I lines identified by Ernandes et al. (2023) to our 2675 Au I line list; one of the three Fe I lines was already included in the list, and found a difference in Au abundance of − 0.07 dex for J0538. For completeness, we note that in J0538 and 2MASS J00512646–1053170, the Au I line at 2427 Å was also used to derive the final Au abundance. In addition, these abundances may also be affected by non-LTE effects. To investigate this, in Figure 6, we plot the log ϵ(Au) abundances of the stars included in Figure 5 as a function of the stellar parameters: Teff (left panel), log g (middle panel), and [Fe/H] (right panel). For each stellar parameter, we determine the Pearson correlation coefficient (r-value) and the corresponding probability of observing a correlation of at least this magnitude by chance (p-value), which are shown in the plots. As can be seen in Figure 6, the log ϵ(Au) abundances seem to correlate with the stellar parameters for this limited sample of abundances, implying the potential presence of non-LTE effects.
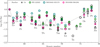 |
Fig. 5 Absolute abundances of heavy r-process elements in the three RPA stars observed with the HST (pink, green, and blue circles) and literature stars (black circles), with Au detections compared to the baseline pattern from Roederer et al. (2023) (grey line), scaled to Ba. The circle size is correlated with the Eu abundance of the star. A somewhat larger star-to-star scatter is seen for Au compared to the other elements. Note that Roederer et al. (2023) did not include Lu, Ta, W, Re, and Ir in their sample, hence the baseline pattern (grey line) in Figure 5 is not representative of these elements. |
5.3 Dynamical signature of J0538
The dynamical properties of J0538 were explored by Gudin et al. (2021) and Shank et al. (2023) using Gaia data. Gudin et al. (2021) derived a pericentric distance of rperi = 3.23 kpc, an apocentric distance of rapo = 9.04 kpc, and a maximum distance from the Galactic plane of Zmax = 4.81 kpc for the star using the AGAMA package (Vasiliev 2019) and the MW2017 potential (McMillan 2017). Using a friends-of-friends clustering algorithm, (Helmi & de Zeeuw 2000), Gudin et al. (2021) also found J0538 to belong to their identified chemo-dynamical tagged group #6 (CDTG-6). CDTG-6 is a group of three stars that also includes the two r-I stars, HD 149414 (Fulbright 2000) and 2MASS J01373857–2618131 (Holmbeck et al. 2020). Similar kinematic properties for J0538 were found in the analysis from Hattori et al. (2023). However, by employing the greedy optimistic clustering method (Okuno & Hattori 2022), Hattori et al. (2023) pair J0538 in a cluster with 11 other r-II stars, which they suggest is a good candidate for a disrupted r-process-enhanced dwarf galaxy. In general, kinematic analyses find large numbers of r-I and r-II stars, including stars from the literature sample used in Figures 4 and 5, to belong to dynamical groups characterized by the stars having similar orbital parameters and metallicities (Roederer et al. 2018a). Further identification and exploration of these systems will be key to investigating the r-process signature in metal-poor stars and further constrain the production of heavy elements in our Universe.
6 Summary
This paper presents detailed abundances derived from optical and near-UV spectra of the r-II star J0538. This is the third star discovered by the RPA for which near-UV spectra with the HST have been obtained, significantly increasing the sample of r-process-enriched stars with abundances derived from near-UV spectra. We derive abundances for 43 elements, including 26 neutron-capture elements, 25 of which are derived from the HST spectrum. In particular, we derive abundances for the neutron-capture elements Cd and Au. Prior to the RPA analysis, only two r-process-enriched stars existed in the literature, with abundances reported for both of these elements. We investigate the behavior of these two elements in r-process-enriched stars in relation to the recently discovered fission-fragment deposition signature potentially affecting the neutron-capture element abundances up to the third-peak elements Os and Pt. For both Cd and Au, a larger star-to-star scatter is detected, and no clear correlation with Eu abundances is seen, as is found for other elements affected by fission-fragment deposition. However, Shah et al. (2024) found correlations between the derived Cd abundances and the stellar parameters, suggesting that current Cd abundances are affected by non-LTE effects. We find similar correlations between the Au abundances and stellar parameters, suggesting that non-LTE effects also influence the Au abundances similarly derived from neutral species. Therefore, until non-LTE effects for Cd and Au are investigated thoroughly, it will be unclear whether the range of r-process elements (Ru to Ag and Gd to Pt) impacted by fission-fragment distribution of transuranic elements extends to elements Cd and Au. This work highlights the importance of the RPA efforts and the need for further near-UV observations of stars with an r-process abundance signature in order to more fully understand the formation and evolution of these elements in our Universe.
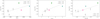 |
Fig. 6 Absolute abundances of Au in the three RPA stars (pink, green and blue stars) and literature r-process-enriched stars included in Figure 5 (grey dots), as a function of stellar parameters Teff (left panel), log g (middle panel), and [Fe/H] (right panel). In each panel, we also plot a least squares fit (grey line) and provide the Pearson correlation coefficient (r-value) and the corresponding probability of observing a correlation of at least this magnitude by chance (p-value). The abundances of Au seem to correlate with the stellar parameters, hinting at the presence of non-LTE effects. |
Data availability
Full Table A.1. is available at the CDS via anonymous ftp to cdsarc.cds.unistra.fr (130.79.128.5) or via https://cdsarc.cds.unistra.fr/viz-bin/cat/J/A+A/697/A127
Acknowledgements
We thank the referee for a timely report and helpful comments on the paper. We acknowledge generous support provided by NASA through grant GO-15951 from the Space Telescope Science Institute, which is operated by the Association of Universities for Research in Astronomy, Incorporated, under NASA contract NAS5-26555. T.T.H. acknowledges support from the Swedish Research Council (VR 2021-05556) and HST-GO-15657. T.C.B. acknowledges partial support from grants PHY 14-30152; Physics Frontier Center/JINA Center for the Evolution of the Elements (JINA-CEE), and OISE-1927130: The International Research Network for Nuclear Astrophysics (IReNA), awarded by the US National Science Foundation. A.F. acknowledges support from NSF-AAG grant AST-2307436. E.M.H. acknowledges work performed under the auspices of the U.S. Department of Energy by Lawrence Livermore National Laboratory under Contract DE-AC52-07NA27344. This document has been approved with release number LLNL-JRNL-2001281-DRAFT. The work of VMP is supported by NOIRLab, which is managed by the Association of Universities for Research in Astronomy (AURA) under a cooperative agreement with the U.S. National Science Foundation. I.U.R. acknowledges additional funding support from HST-GO-15657 and the U.S. National Science Foundation (NSF) grant AST 2205847. R.E. acknowledges support from NSF-AAG grant AST 2206263 and NASA Astrophysics Theory Program grant 80NSSC24K0899. This research has made use of NASA’s Astrophysics Data System Bibliographic Services; the arXiv.org preprint server operated by Cornell University; the SIMBAD and VizieR databases hosted by the Strasbourg Astronomical Data Center (Wenger et al. 2000); the ASD hosted by NIST; the MAST at STScI; Image Reduction and Analysis Facility (IRAF) NOIRLab IRAF is distributed by the Community Science and Data Center at NSF NOIRLab, which is managed by the Association of Universities for Research in Astronomy (AURA) under a cooperative agreement with the U.S. National Science Foundation (Tody 1986, 1993; Fitzpatrick et al. 2024); NumPy (van der Walt et al. 2011); Matplotlib (Hunter 2007); and AstroPy (Astropy Collaboration 2013, 2018).
Appendix
Atomic data and abundances for individual lines analysed.
References
- Abbott, B. P., Abbott, R., Abbott, T. D., et al. 2017, Phys. Rev. Lett., 119, 161101 [CrossRef] [PubMed] [Google Scholar]
- Asplund, M., Grevesse, N., Sauval, A. J., & Scott, P. 2009, ARA&A, 47, 481 [NASA ADS] [CrossRef] [Google Scholar]
- Astropy Collaboration (Robitaille, T. P., et al.) 2013, A&A, 558, A33 [NASA ADS] [CrossRef] [EDP Sciences] [Google Scholar]
- Astropy Collaboration (Price-Whelan, A. M., et al.) 2018, AJ, 156, 123 [Google Scholar]
- Babusiaux, C., Fabricius, C., Khanna, S., et al. 2023, A&A, 674, A32 [NASA ADS] [CrossRef] [EDP Sciences] [Google Scholar]
- Bailer-Jones, C. A. L., Rybizki, J., Fouesneau, M., Demleitner, M., & Andrae, R. 2021, AJ, 161, 147 [Google Scholar]
- Bandyopadhyay, A., Ezzeddine, R., Allende Prieto, C., et al. 2024, ApJS, 274, 39 [Google Scholar]
- Barbuy, B., Spite, M., Hill, V., et al. 2011, A&A, 534, A60 [NASA ADS] [CrossRef] [EDP Sciences] [Google Scholar]
- Belmonte, M. T., Pickering, J. C., Ruffoni, M. P., et al. 2017, ApJ, 848, 125 [NASA ADS] [CrossRef] [Google Scholar]
- Bergemann, M., & Cescutti, G. 2010, A&A, 522, A9 [NASA ADS] [CrossRef] [EDP Sciences] [Google Scholar]
- Bergemann, M., & Gehren, T. 2008, A&A, 492, 823 [NASA ADS] [CrossRef] [EDP Sciences] [Google Scholar]
- Bergemann, M., Pickering, J. C., & Gehren, T. 2010, MNRAS, 401, 1334 [CrossRef] [Google Scholar]
- Bergemann, M., Kudritzki, R.-P., Würl, M., et al. 2013, ApJ, 764, 115 [NASA ADS] [CrossRef] [Google Scholar]
- Bernstein, R., Shectman, S. A., Gunnels, S. M., Mochnacki, S., & Athey, A. E. 2003, SPIE Conf. Ser., 4841, 1694 [Google Scholar]
- Biémont, É., Blagoev, K., Engström, L., et al. 2011, MNRAS, 414, 3350 [Google Scholar]
- Bowen, I. S., & Vaughan, A. H., J. 1973, Appl. Opt., 12, 1430 [Google Scholar]
- Burbidge, E. M., Burbidge, G. R., Fowler, W. A., & Hoyle, F. 1957, Rev. Mod. Phys., 29, 547 [CrossRef] [Google Scholar]
- Cain, M., Frebel, A., Gull, M., et al. 2018, ApJ, 864, 43 [Google Scholar]
- Cain, M., Frebel, A., Ji, A. P., et al. 2020, ApJ, 898, 40 [NASA ADS] [CrossRef] [Google Scholar]
- Cameron, A. G. W. 1957, PASP, 69, 201 [NASA ADS] [CrossRef] [Google Scholar]
- Casagrande, L., & VandenBerg, D. A. 2014, MNRAS, 444, 392 [Google Scholar]
- Castelli, F., & Kurucz, R. L. 2003, IAU Symp., 210, A20 [Google Scholar]
- Côté, B., Belczynski, K., Fryer, C. L., et al. 2017, ApJ, 836, 230 [CrossRef] [Google Scholar]
- Côté, B., Fryer, C. L., Belczynski, K., et al. 2018, ApJ, 855, 99 [Google Scholar]
- Cowan, J. J., Sneden, C., Burles, S., et al. 2002, ApJ, 572, 861 [NASA ADS] [CrossRef] [Google Scholar]
- Cowan, J. J., Sneden, C., Roederer, I. U., et al. 2020, ApJ, 890, 119 [Google Scholar]
- Cutri, R. M., Skrutskie, M. F., van Dyk, S., et al. 2003, VizieR Online Data Catalog: II/246 [Google Scholar]
- Demidov, Y. A., Konovalova, E. A., Imanbaeva, R. T., Kozlov, M. G., & Barzakh, A. E. 2021, Phys. Rev. A, 103, 032824 [Google Scholar]
- Den Hartog, E. A., Lawler, J. E., Sneden, C., & Cowan, J. J. 2003, ApJS, 148, 543 [Google Scholar]
- Den Hartog, E. A., Herd, M. T., Lawler, J. E., et al. 2005, ApJ, 619, 639 [NASA ADS] [CrossRef] [Google Scholar]
- Den Hartog, E. A., Lawler, J. E., Sneden, C., & Cowan, J. J. 2006, ApJS, 167, 292 [NASA ADS] [CrossRef] [Google Scholar]
- Den Hartog, E. A., Lawler, J. E., Sobeck, J. S., Sneden, C., & Cowan, J. J. 2011, ApJS, 194, 35 [NASA ADS] [CrossRef] [Google Scholar]
- Den Hartog, E. A., Ruffoni, M. P., Lawler, J. E., et al. 2014, ApJS, 215, 23 [NASA ADS] [CrossRef] [Google Scholar]
- Den Hartog, E. A., Lawler, J. E., Sneden, C., Cowan, J. J., & Brukhovesky, A. 2019, ApJS, 243, 33 [NASA ADS] [CrossRef] [Google Scholar]
- Den Hartog, E. A., Lawler, J. E., & Roederer, I. U. 2020, ApJS, 248, 10 [Google Scholar]
- Den Hartog, E. A., Lawler, J. E., & Roederer, I. U. 2021a, ApJS, 254, 5 [NASA ADS] [CrossRef] [Google Scholar]
- Den Hartog, E. A., Lawler, J. E., Sneden, C., et al. 2021b, ApJS, 255, 27 [NASA ADS] [CrossRef] [Google Scholar]
- Den Hartog, E. A., Lawler, J. E., Sneden, C., Roederer, I. U., & Cowan, J. J. 2023, ApJS, 265, 42 [Google Scholar]
- Drout, M. R., Piro, A. L., Shappee, B. J., et al. 2017, Science, 358, 1570 [NASA ADS] [CrossRef] [Google Scholar]
- Eichler, M., Arcones, A., Kelic, A., et al. 2015, ApJ, 808, 30 [NASA ADS] [CrossRef] [Google Scholar]
- Eitner, P., Bergemann, M., Ruiter, A. J., et al. 2023, A&A, 677, A151 [NASA ADS] [CrossRef] [EDP Sciences] [Google Scholar]
- Ernandes, H., Castro, M. J., Barbuy, B., et al. 2023, MNRAS, 524, 656 [NASA ADS] [CrossRef] [Google Scholar]
- Ezzeddine, R., Rasmussen, K., Frebel, A., et al. 2020, ApJ, 898, 150 [NASA ADS] [CrossRef] [Google Scholar]
- Fedchak, J. A., & Lawler, J. E. 1999, ApJ, 523, 734 [Google Scholar]
- Fitzpatrick, M., Placco, V., Bolton, A., et al. 2024, AAS Meeting Abstracts, 243, 201.16| [Google Scholar]
- Fivet, V., Quinet, P., Biémont, É., & Xu, H. L. 2006, J. Phys. B Atm. Mol. Phys., 39, 3587 [Google Scholar]
- Fujimoto, S.-i., Nishimura, N., & Hashimoto, M.-a. 2008, ApJ, 680, 1350 [Google Scholar]
- Fulbright, J. P. 2000, AJ, 120, 1841 [NASA ADS] [CrossRef] [Google Scholar]
- Gaia Collaboration 2018, VizieR Online Data Catalog: I/345 [Google Scholar]
- Gaia Collaboration (Vallenari, A., et al.) 2023, A&A, 674, A1 [NASA ADS] [CrossRef] [EDP Sciences] [Google Scholar]
- Grichener, A., & Soker, N. 2019, ApJ, 878, 24 [Google Scholar]
- Gudin, D., Shank, D., Beers, T. C., et al. 2021, ApJ, 908, 79 [NASA ADS] [CrossRef] [Google Scholar]
- Gull, M., Frebel, A., Cain, M. G., et al. 2018, ApJ, 862, 174 [Google Scholar]
- Gurell, J., Nilsson, H., Engström, L., et al. 2010, A&A, 511, A68 [NASA ADS] [CrossRef] [EDP Sciences] [Google Scholar]
- Hannaford, P., Larkins, P. L., & Lowe, R. M. 1981, J. Phys. B Atm. Mol. Phys., 14, 2321 [Google Scholar]
- Hansen, T. T., Holmbeck, E. M., Beers, T. C., et al. 2018, ApJ, 858, 92 [Google Scholar]
- Hansen, T. T., Beers, T. C., Ezzeddine, R., et al. 2019, Testing r-process nucleosynthesis models with two r-process enhanced stars, HST Proposal. Cycle 27, ID. #15951 [Google Scholar]
- Hattori, K., Okuno, A., & Roederer, I. U. 2023, ApJ, 946, 48 [NASA ADS] [CrossRef] [Google Scholar]
- Helmi, A., & de Zeeuw, P. T. 2000, MNRAS, 319, 657 [Google Scholar]
- Holmbeck, E. M., Beers, T. C., Roederer, I. U., et al. 2018, ApJ, 859, L24 [NASA ADS] [CrossRef] [Google Scholar]
- Holmbeck, E. M., Hansen, T. T., Beers, T. C., et al. 2020, ApJS, 249, 30 [NASA ADS] [CrossRef] [Google Scholar]
- Hunter, J. D. 2007, Comput. Sci. Eng., 9, 90 [Google Scholar]
- Ivans, I. I., Simmerer, J., Sneden, C., et al. 2006, ApJ, 645, 613 [NASA ADS] [CrossRef] [Google Scholar]
- Ji, A. P., Li, T. S., Hansen, T. T., et al. 2020, AJ, 160, 181 [NASA ADS] [CrossRef] [Google Scholar]
- Kelson, D. D. 2003, PASP, 115, 688 [NASA ADS] [CrossRef] [Google Scholar]
- Kimble, R. A., Woodgate, B. E., Bowers, C. W., et al. 1998, ApJ, 492, L83 [NASA ADS] [CrossRef] [Google Scholar]
- Kramida, A., Ralchenko, Y., Nave, G., & Reader, J. 2018, APS Meeting Abstracts, 2018, |pM01.004| [Google Scholar]
- Kramida, A., Ralchenko, Y., Reader, J., & NIST ASD Team 2020, National Institute of Standards and Technology, Gaithersburg, MD, https://physics. nist.gov/asd [Google Scholar]
- Kurucz, R. L. 2011, Canad. J. Phys., 89, 417 [Google Scholar]
- Lattimer, J. M., & Schramm, D. N. 1974, ApJ, 192, L145 [NASA ADS] [CrossRef] [Google Scholar]
- Lawler, J. E., & Dakin, J. T. 1989, J. Opt. Soc. Am. B Opt. Phys., 6, 1457 [Google Scholar]
- Lawler, J. E., Bonvallet, G., & Sneden, C. 2001a, ApJ, 556, 452 [NASA ADS] [CrossRef] [Google Scholar]
- Lawler, J. E., Wickliffe, M. E., Cowley, C. R., & Sneden, C. 2001b, ApJS, 137, 341 [NASA ADS] [CrossRef] [Google Scholar]
- Lawler, J. E., Wickliffe, M. E., den Hartog, E. A., & Sneden, C. 2001c, ApJ, 563, 1075 [CrossRef] [Google Scholar]
- Lawler, J. E., Wyart, J. F., & Blaise, J. 2001d, ApJS, 137, 351 [NASA ADS] [CrossRef] [Google Scholar]
- Lawler, J. E., Sneden, C., & Cowan, J. J. 2004, ApJ, 604, 850 [Google Scholar]
- Lawler, J. E., Den Hartog, E. A., Sneden, C., & Cowan, J. J. 2006, ApJS, 162, 227 [Google Scholar]
- Lawler, J. E., den Hartog, E. A., Labby, Z. E., et al. 2007, ApJS, 169, 120 [Google Scholar]
- Lawler, J. E., Sneden, C., Cowan, J. J., et al. 2008, ApJS, 178, 71 [Google Scholar]
- Lawler, J. E., Sneden, C., Cowan, J. J., Ivans, I. I., & Den Hartog, E. A. 2009, ApJS, 182, 51 [Google Scholar]
- Lawler, J. E., Guzman, A., Wood, M. P., Sneden, C., & Cowan, J. J. 2013, ApJS, 205, 11 [Google Scholar]
- Lawler, J. E., Sneden, C., & Cowan, J. J. 2015, ApJS, 220, 13 [NASA ADS] [CrossRef] [Google Scholar]
- Lawler, J. E., Sneden, C., Nave, G., et al. 2017, ApJS, 228, 10 [CrossRef] [Google Scholar]
- Lawler, J. E., Feigenson, T., Sneden, C., Cowan, J. J., & Nave, G. 2018, ApJS, 238, 7 [Google Scholar]
- Lawler, J. E., Hala, Sneden, C., et al. 2019, ApJS, 241, 21 [NASA ADS] [CrossRef] [Google Scholar]
- Li, R., Chatelain, R., Holt, R. A., et al. 2007, Phys. Scr, 76, 577 [NASA ADS] [CrossRef] [Google Scholar]
- Lind, K., Asplund, M., Barklem, P. S., & Belyaev, A. K. 2011, A&A, 528, A103 [NASA ADS] [CrossRef] [EDP Sciences] [Google Scholar]
- Lind, K., Nordlander, T., Wehrhahn, A., et al. 2022, A&A, 665, A33 [NASA ADS] [CrossRef] [EDP Sciences] [Google Scholar]
- Ljung, G., Nilsson, H., Asplund, M., & Johansson, S. 2006, A&A, 456, 1181 [NASA ADS] [CrossRef] [EDP Sciences] [Google Scholar]
- Lund, K. A., Engel, J., McLaughlin, G. C., et al. 2023, ApJ, 944, 144 [NASA ADS] [CrossRef] [Google Scholar]
- Malcheva, G., Blagoev, K., Mayo, R., et al. 2006, MNRAS, 367, 754 [Google Scholar]
- Mallinson, J. W. E., Lind, K., Amarsi, A. M., et al. 2022, A&A, 668, A103 [NASA ADS] [CrossRef] [EDP Sciences] [Google Scholar]
- McCall, M. L. 2004, AJ, 128, 2144 [Google Scholar]
- McMillan, P. J. 2017, MNRAS, 465, 76 [NASA ADS] [CrossRef] [Google Scholar]
- McWilliam, A. 1998, AJ, 115, 1640 [NASA ADS] [CrossRef] [Google Scholar]
- Meléndez, J., & Barbuy, B. 2009, A&A, 497, 611 [NASA ADS] [CrossRef] [EDP Sciences] [Google Scholar]
- Mucciarelli, A., Bellazzini, M., & Massari, D. 2021, A&A, 653, A90 [NASA ADS] [CrossRef] [EDP Sciences] [Google Scholar]
- Munari, U., Henden, A., Frigo, A., et al. 2014, AJ, 148, 81 [NASA ADS] [CrossRef] [Google Scholar]
- Nilsson, H., Zhang, Z. G., Lundberg, H., Johansson, S., & Nordström, B. 2002, A&A, 382, 368 [NASA ADS] [CrossRef] [EDP Sciences] [Google Scholar]
- Nilsson, H., Ljung, G., Lundberg, H., & Nielsen, K. E. 2006, A&A, 445, 1165 [NASA ADS] [CrossRef] [EDP Sciences] [Google Scholar]
- Nilsson, H., Hartman, H., Engström, L., et al. 2010, A&A, 511, A16 [NASA ADS] [CrossRef] [EDP Sciences] [Google Scholar]
- O’Brian, T. R., Wickliffe, M. E., Lawler, J. E., Whaling, W., & Brault, J. W. 1991, J. Opt. Soc. Am. B Opt. Phys., 8, 1185 [Google Scholar]
- Okuno, A., & Hattori, K. 2022, arXiv e-prints [arXiv:2204.08205] [Google Scholar]
- Pakhomov, Y. V., Ryabchikova, T. A., & Piskunov, N. E. 2019, Astron. Rep., 63, 1010 [Google Scholar]
- Patel, A., Metzger, B. D., Goldberg, J. A., et al. 2025, arXiv e-prints [arXiv:2501.17253] [Google Scholar]
- Pehlivan Rhodin, A., Hartman, H., Nilsson, H., & Jönsson, P. 2017, A&A, 598, A102 [NASA ADS] [CrossRef] [EDP Sciences] [Google Scholar]
- Peterson, R. C., Dorman, B., & Rood, R. T. 2001, ApJ, 559, 372 [NASA ADS] [CrossRef] [Google Scholar]
- Peterson, R. C., Barbuy, B., & Spite, M. 2020, A&A, 638, A64 [NASA ADS] [CrossRef] [EDP Sciences] [Google Scholar]
- Pickering, J. C., Thorne, A. P., & Perez, R. 2001, ApJS, 132, 403 [Google Scholar]
- Pickering, J. C., Thorne, A. P., & Perez, R. 2002, ApJS, 138, 247 [NASA ADS] [CrossRef] [Google Scholar]
- Piskunov, N. E., Kupka, F., Ryabchikova, T. A., Weiss, W. W., & Jeffery, C. S. 1995, A&AS, 112, 525 [Google Scholar]
- Placco, V. M., Holmbeck, E. M., Frebel, A., et al. 2017, ApJ, 844, 18 [NASA ADS] [CrossRef] [Google Scholar]
- Placco, V. M., Santucci, R. M., Yuan, Z., et al. 2020, ApJ, 897, 78 [Google Scholar]
- Placco, V. M., Sneden, C., Roederer, I. U., et al. 2021, Res. Notes Am. Astron. Soc., 5, 92 [Google Scholar]
- Reggiani, H., Amarsi, A. M., Lind, K., et al. 2019, A&A, 627, A177 [EDP Sciences] [Google Scholar]
- Roederer, I. U., & Lawler, J. E. 2012, ApJ, 750, 76 [NASA ADS] [CrossRef] [Google Scholar]
- Roederer, I. U., & Lawler, J. E. 2021, ApJ, 912, 119 [NASA ADS] [CrossRef] [Google Scholar]
- Roederer, I. U., Lawler, J. E., Sneden, C., et al. 2008, ApJ, 675, 723 [Google Scholar]
- Roederer, I. U., Sneden, C., Lawler, J. E., & Cowan, J. J. 2010, ApJ, 714, L123 [NASA ADS] [CrossRef] [Google Scholar]
- Roederer, I. U., Lawler, J. E., Sobeck, J. S., et al. 2012, ApJS, 203, 27 [NASA ADS] [CrossRef] [Google Scholar]
- Roederer, I. U., Preston, G. W., Thompson, I. B., et al. 2014a, AJ, 147, 136 [Google Scholar]
- Roederer, I. U., Schatz, H., Lawler, J. E., et al. 2014b, ApJ, 791, 32 [NASA ADS] [CrossRef] [Google Scholar]
- Roederer, I. U., Hattori, K., & Valluri, M. 2018a, AJ, 156, 179 [NASA ADS] [CrossRef] [Google Scholar]
- Roederer, I. U., Sakari, C. M., Placco, V. M., et al. 2018b, ApJ, 865, 129 [NASA ADS] [CrossRef] [Google Scholar]
- Roederer, I. U., Cowan, J. J., Pignatari, M., et al. 2022a, ApJ, 936, 84 [CrossRef] [Google Scholar]
- Roederer, I. U., Lawler, J. E., Den Hartog, E. A., et al. 2022b, ApJS, 260, 27 [NASA ADS] [CrossRef] [Google Scholar]
- Roederer, I. U., Vassh, N., Holmbeck, E. M., et al. 2023, Science, 382, 1177 [CrossRef] [PubMed] [Google Scholar]
- Roederer, I. U., Beers, T. C., Hattori, K., et al. 2024, ApJ, 971, 158 [NASA ADS] [CrossRef] [Google Scholar]
- Ruffoni, M. P., Den Hartog, E. A., Lawler, J. E., et al. 2014, MNRAS, 441, 3127 [NASA ADS] [CrossRef] [Google Scholar]
- Sakari, C. M., Placco, V. M., Farrell, E. M., et al. 2018a, ApJ, 868, 110 [Google Scholar]
- Sakari, C. M., Placco, V. M., Hansen, T., et al. 2018b, ApJ, 854, L20 [Google Scholar]
- Schlafly, E. F., & Finkbeiner, D. P. 2011, ApJ, 737, 103 [Google Scholar]
- Shah, S. P., Ezzeddine, R., Roederer, I. U., et al. 2024, MNRAS, 529, 1917 [NASA ADS] [CrossRef] [Google Scholar]
- Shank, D., Beers, T. C., Placco, V. M., et al. 2023, ApJ, 943, 23 [NASA ADS] [CrossRef] [Google Scholar]
- Siegel, D. M., Barnes, J., & Metzger, B. D. 2019, Nature, 569, 241 [Google Scholar]
- Sikström, C. M., Pihlemark, H., Nilsson, H., et al. 2001, J. Phys. B Atm Mol. Phys., 34, 477 [Google Scholar]
- Siqueira Mello, C., Spite, M., Barbuy, B., et al. 2013, A&A, 550, A122 [NASA ADS] [CrossRef] [EDP Sciences] [Google Scholar]
- Sneden, C. A. 1973, PhD thesis, University of Texas, Austin, USA [Google Scholar]
- Sneden, C., Cowan, J. J., Lawler, J. E., et al. 2003, ApJ, 591, 936 [NASA ADS] [CrossRef] [Google Scholar]
- Sneden, C., Cowan, J. J., & Gallino, R. 2008, ARA&A, 46, 241 [Google Scholar]
- Sneden, C., Lawler, J. E., Cowan, J. J., Ivans, I. I., & Den Hartog, E. A. 2009, ApJS, 182, 80 [Google Scholar]
- Sobeck, J. S., Lawler, J. E., & Sneden, C. 2007, ApJ, 667, 1267 [NASA ADS] [CrossRef] [Google Scholar]
- Sobeck, J. S., Kraft, R. P., Sneden, C., et al. 2011, AJ, 141, 175 [NASA ADS] [CrossRef] [Google Scholar]
- Surman, R., & Engel, J. 2001, Phys. Rev. C, 64, 035801 [Google Scholar]
- Surman, R., McLaughlin, G. C., Ruffert, M., Janka, H. T., & Hix, W. R. 2008, ApJ, 679, L117 [NASA ADS] [CrossRef] [Google Scholar]
- Tody, D. 1986, SPIE Conf. Ser., 627, 733 [Google Scholar]
- Tody, D. 1993, ASP Conf. Ser., 52, 173 [Google Scholar]
- Träbert, E., Wolf, A., Linkemann, J., & Tordoir, X. 1999, J. Phys. B Atm. Mol. Phys., 32, 537 [Google Scholar]
- van der Walt, S., Colbert, S. C., & Varoquaux, G. 2011, Comput. Sci. Eng., 13, 22 [Google Scholar]
- Vasiliev, E. 2019, MNRAS, 482, 1525 [Google Scholar]
- Wehmeyer, B., Fröhlich, C., Côté, B., Pignatari, M., & Thielemann, F. K. 2019, MNRAS, 487, 1745 [NASA ADS] [CrossRef] [Google Scholar]
- Wenger, M., Ochsenbein, F., Egret, D., et al. 2000, A&AS, 143, 9 [NASA ADS] [CrossRef] [EDP Sciences] [Google Scholar]
- Wickliffe, M. E., & Lawler, J. E. 1997, J. Opt. Soc. Ame. B Opt. Phys., 14, 737 [Google Scholar]
- Wickliffe, M. E., Lawler, J. E., & Nave, G. 2000, J. Quant. Spec. Radiat. Transf., 66, 363 [Google Scholar]
- Wood, M. P., Lawler, J. E., Sneden, C., & Cowan, J. J. 2013, ApJS, 208, 27 [NASA ADS] [CrossRef] [Google Scholar]
- Wood, M. P., Lawler, J. E., Den Hartog, E. A., Sneden, C., & Cowan, J. J. 2014a, ApJS, 214, 18 [Google Scholar]
- Wood, M. P., Lawler, J. E., Sneden, C., & Cowan, J. J. 2014b, ApJS, 211, 20 [NASA ADS] [CrossRef] [Google Scholar]
- Woodgate, B. E., Kimble, R. A., Bowers, C. W., et al. 1998, PASP, 110, 1183 [NASA ADS] [CrossRef] [Google Scholar]
- Xu, H. L., Persson, A., Svanberg, S., et al. 2004, Phys. Rev. A, 70, 042508 [Google Scholar]
All Tables
All Figures
|
Fig. 1 Derived [X/Fe] abundances for the three RPA stars observed with the HST: J0538 (pink star, this work), HD 222925 (green cross, Roederer et al. 2022b), and 2MASS J00512646–1053170 (blue square, Shah et al. 2024), compared to stellar abundances from the MW halo (grey dots; Roederer et al. 2014a). |
| In the text | |
|
Fig. 2 Comparison of synthesized and observed spectra (black squares) for selected absorption features in the near-UV spectrum and Th. The blue line is the best-fit synthesis, the blue band shows the uncertainty, and the dotted line is a synthesis without the given element. |
| In the text | |
|
Fig. 3 Absolute abundances for neutron-capture elements derived for J0538 compared to scaled Solar System r-(solid) and s-process (dashed) abundances, taken from Sneden et al. (2008). Downwards pointing triangles denote upper limits. The stellar abundances most closely match the Solar System r-process abundance pattern. |
| In the text | |
|
Fig. 4 Absolute abundances of light r-process elements for the three RPA stars observed with the HST (pink, green, and blue circles) and literature stars (black circles) with Cd detections compared to the baseline pattern from Roederer et al. (2023) (grey line), scaled to Zr. The circle size is correlated with the Eu abundances of the stars. Elements from Sr to Mo follow the universal light element pattern, while signatures of fission-fragment deposition are seen for Ru to Ag. Cd displays a large scatter and no clear correlation with Eu abundances. |
| In the text | |
|
Fig. 5 Absolute abundances of heavy r-process elements in the three RPA stars observed with the HST (pink, green, and blue circles) and literature stars (black circles), with Au detections compared to the baseline pattern from Roederer et al. (2023) (grey line), scaled to Ba. The circle size is correlated with the Eu abundance of the star. A somewhat larger star-to-star scatter is seen for Au compared to the other elements. Note that Roederer et al. (2023) did not include Lu, Ta, W, Re, and Ir in their sample, hence the baseline pattern (grey line) in Figure 5 is not representative of these elements. |
| In the text | |
|
Fig. 6 Absolute abundances of Au in the three RPA stars (pink, green and blue stars) and literature r-process-enriched stars included in Figure 5 (grey dots), as a function of stellar parameters Teff (left panel), log g (middle panel), and [Fe/H] (right panel). In each panel, we also plot a least squares fit (grey line) and provide the Pearson correlation coefficient (r-value) and the corresponding probability of observing a correlation of at least this magnitude by chance (p-value). The abundances of Au seem to correlate with the stellar parameters, hinting at the presence of non-LTE effects. |
| In the text | |
Current usage metrics show cumulative count of Article Views (full-text article views including HTML views, PDF and ePub downloads, according to the available data) and Abstracts Views on Vision4Press platform.
Data correspond to usage on the plateform after 2015. The current usage metrics is available 48-96 hours after online publication and is updated daily on week days.
Initial download of the metrics may take a while.