Fig. 6
Download original image
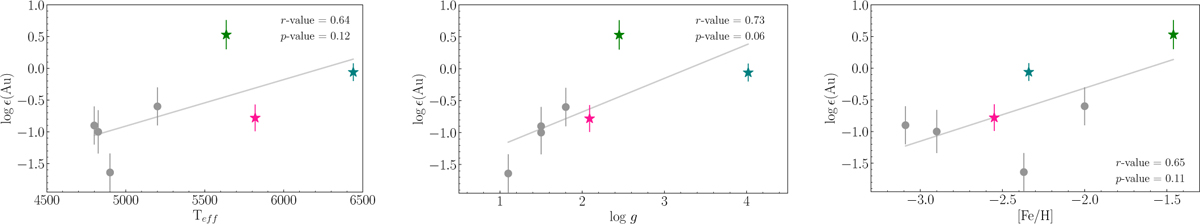
Absolute abundances of Au in the three RPA stars (pink, green and blue stars) and literature r-process-enriched stars included in Figure 5 (grey dots), as a function of stellar parameters Teff (left panel), log g (middle panel), and [Fe/H] (right panel). In each panel, we also plot a least squares fit (grey line) and provide the Pearson correlation coefficient (r-value) and the corresponding probability of observing a correlation of at least this magnitude by chance (p-value). The abundances of Au seem to correlate with the stellar parameters, hinting at the presence of non-LTE effects.
Current usage metrics show cumulative count of Article Views (full-text article views including HTML views, PDF and ePub downloads, according to the available data) and Abstracts Views on Vision4Press platform.
Data correspond to usage on the plateform after 2015. The current usage metrics is available 48-96 hours after online publication and is updated daily on week days.
Initial download of the metrics may take a while.