Fig. 1.
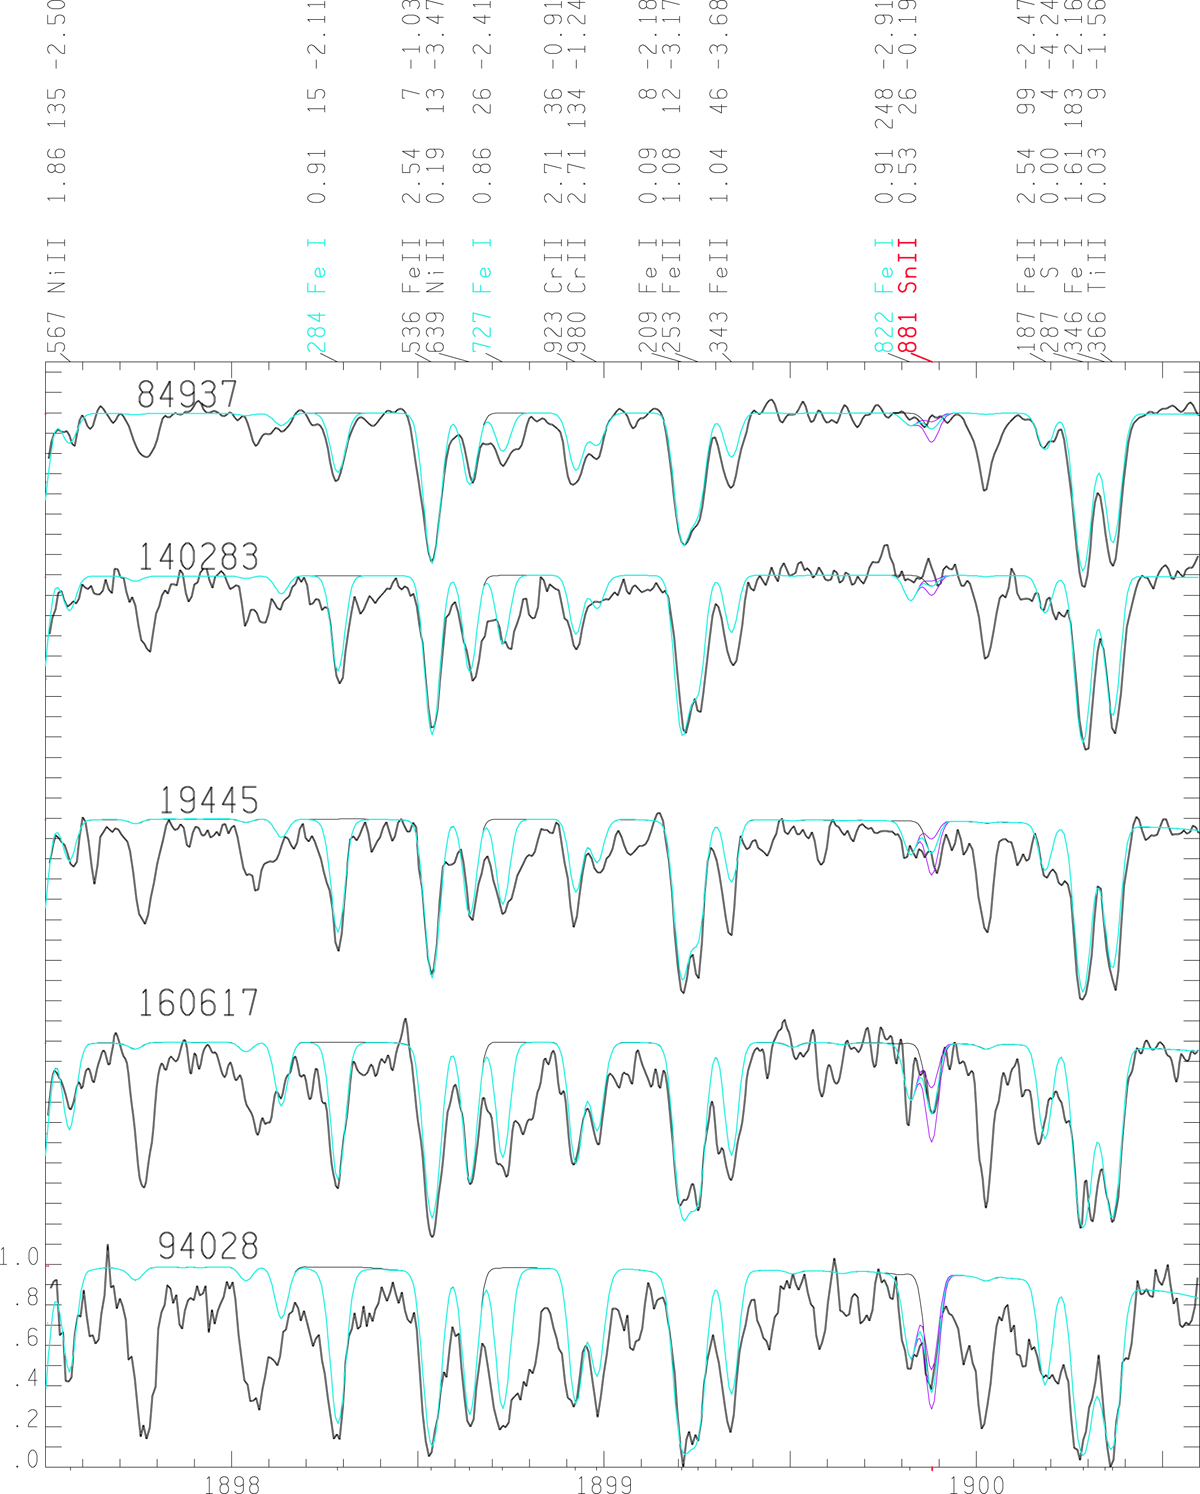
Spectra for the five stars are plotted in the region of the Sn II 1899.898 Å line, where unidentified lines are numerous and strong. Each of Figs. 1−15 compares the observed spectrum (heavy black line) with the two calculations, one lacking newly identified Fe I lines (thin black line) and one including them (light blue line). The Y scale on the left is for the bottom comparison. The others have the same vertical scaling factor; ticks on the Y axis indicate a displacement of 0.1 full scale. At the bottom is the wavelength in Å. At the top, aligned with line wavelength, are listed the line parameters for the strongest lines in the best-fit calculation of the bottom spectrum. Following the decimal digits of the wavelength are given the species, the lower excitation potential in eV, the decimal digits of the core residual intensity of the unbroadened spectrum, and the log gf-value adopted. Lines of trans-Fe species are highlighted in red, and those of newly identified Fe I in light blue. Purple lines indicate light-blue calculations with a ±0.3 change in the adopted abundances of each trans-Fe element.
Current usage metrics show cumulative count of Article Views (full-text article views including HTML views, PDF and ePub downloads, according to the available data) and Abstracts Views on Vision4Press platform.
Data correspond to usage on the plateform after 2015. The current usage metrics is available 48-96 hours after online publication and is updated daily on week days.
Initial download of the metrics may take a while.