Fig. 17.
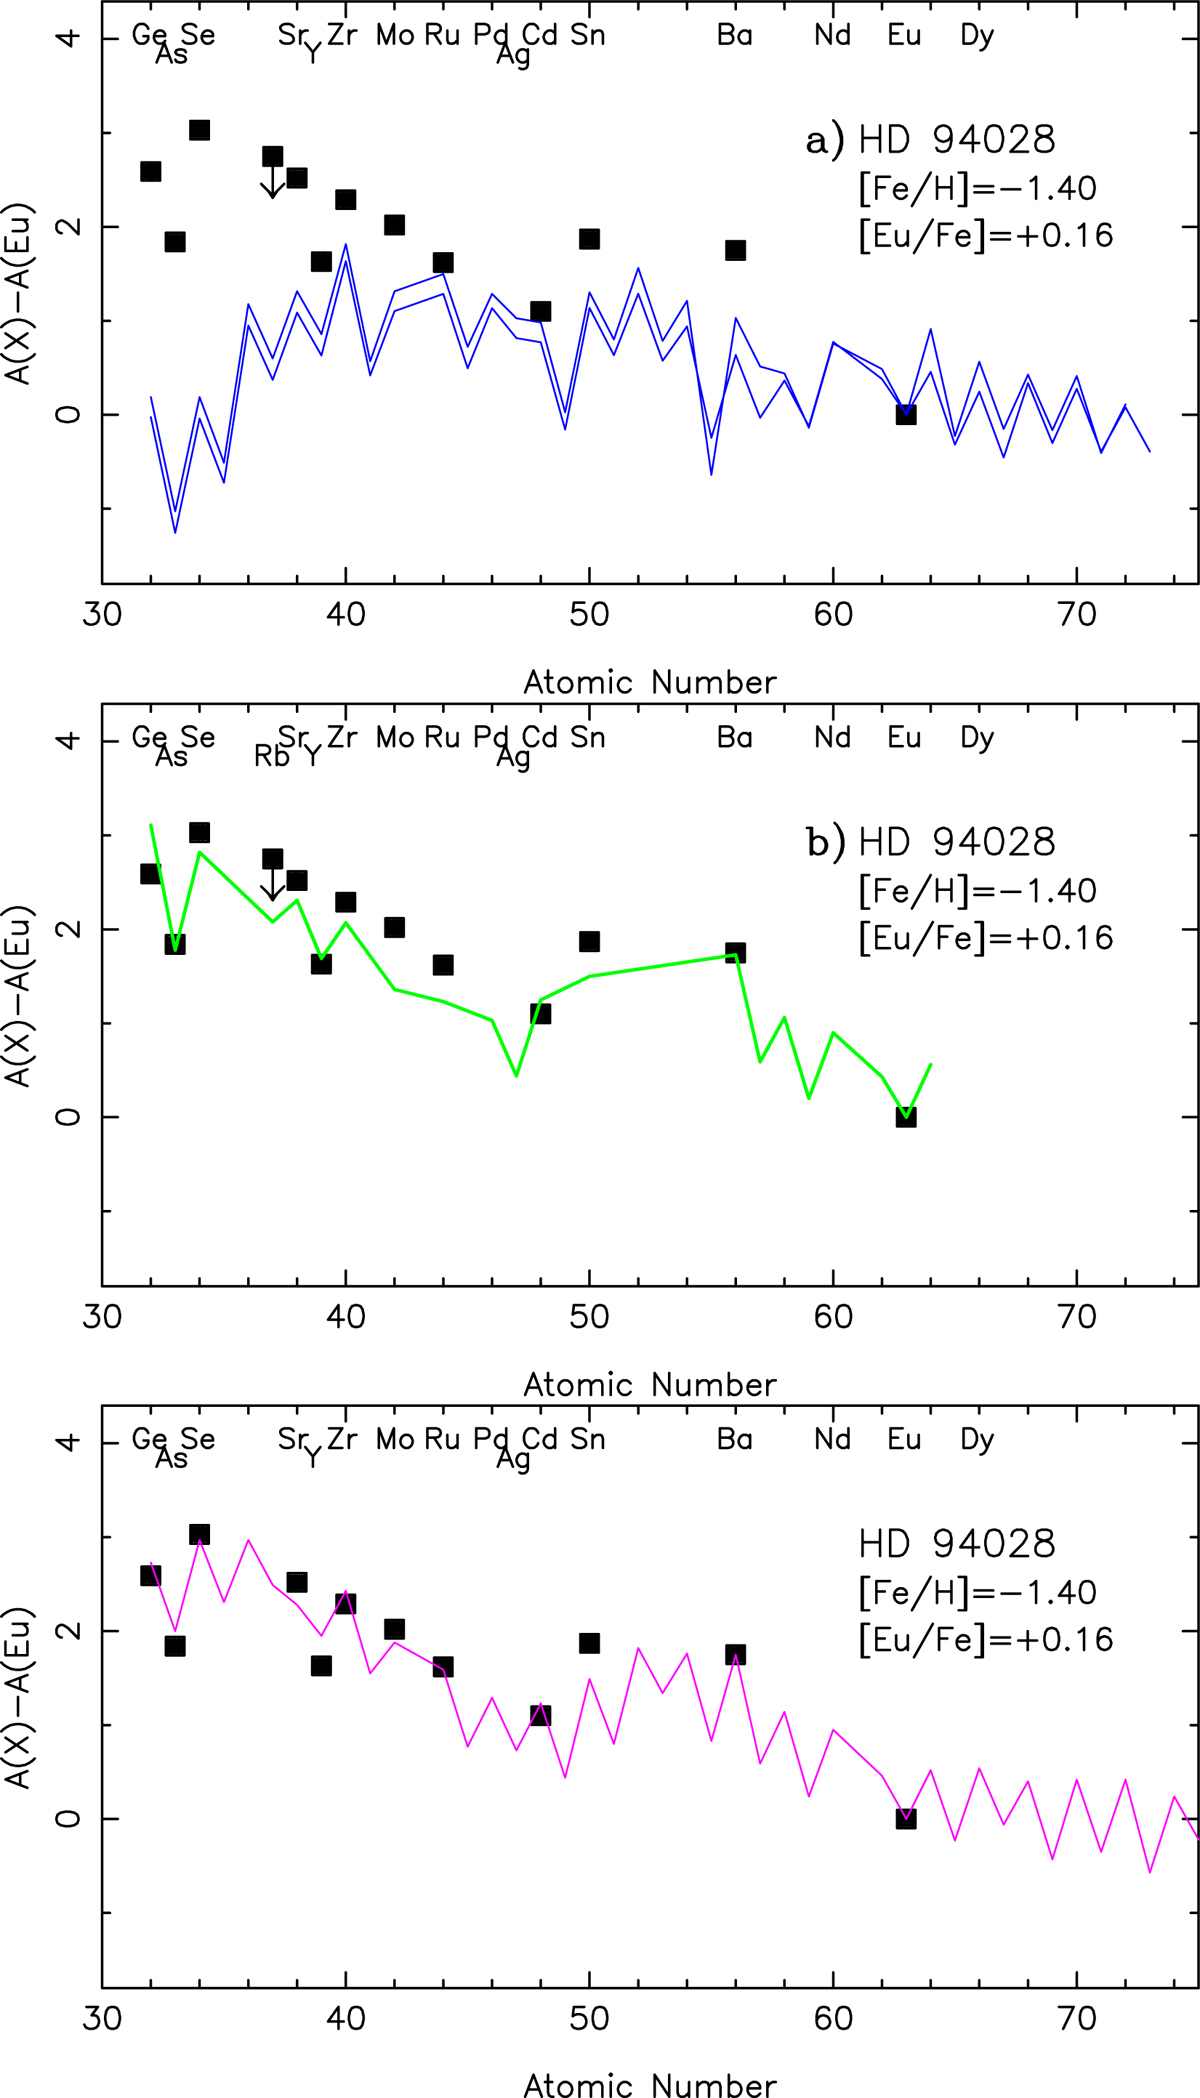
Neutron-capture abundances observed in HD 94028 are compared to the predictions of the main r-process following Wanajo (2007, hot and cold models, blue lines) in the top panel; the solar abundance pattern (green line) in the middle panel; and the predictions of the combined s, modified r, and i-processes as computed by Roederer et al. (2016, their Figs. 6 and 7; red lines) in the bottom panel.
Current usage metrics show cumulative count of Article Views (full-text article views including HTML views, PDF and ePub downloads, according to the available data) and Abstracts Views on Vision4Press platform.
Data correspond to usage on the plateform after 2015. The current usage metrics is available 48-96 hours after online publication and is updated daily on week days.
Initial download of the metrics may take a while.