| Issue |
A&A
Volume 637, May 2020
|
|
|---|---|---|
| Article Number | A56 | |
| Number of page(s) | 28 | |
| Section | Extragalactic astronomy | |
| DOI | https://doi.org/10.1051/0004-6361/202037604 | |
| Published online | 14 May 2020 | |
Stellar populations across galaxy bars in the MUSE TIMER project
1
Institute of Cosmology and Gravitation, University of Portsmouth, Burnaby Road, Portsmouth PO1 3FX, UK
e-mail: jusneuma.astro@gmail.com
2
Leibniz-Institut für Astrophysik Potsdam (AIP), An der Sternwarte 16, 14480 Potsdam, Germany
3
Max-Planck-Institut für Astrophysik, Karl-Schwarzschild-Str. 1, 85748 Garching bei München, Germany
4
Departamento de Física Teórica y del Cosmos, Universidad de Granada, Facultad de Ciencias (Edificio Mecenas), 18071 Granada, Spain
5
Instituto Universitario Carlos I de Física Teórica y Computacional, Universidad de Granada, 18071 Granada, Spain
6
European Southern Observatory (ESO), Karl-Schwarzschild-Str. 2, 85748 Garching b. München, Germany
7
Instituto de Astrofísica de Canarias, Calle Vía Láctea s/n, 38205 La Laguna, Tenerife, Spain
8
Departamento de Astrofísica, Universidad de La Laguna, 38200 La Laguna, Tenerife, Spain
9
Departamento de Física Teórica, Universidad Autónoma de Madrid, 28049 Cantoblanco, Spain
10
Instituto de Física de Partículas y del Cosmos IPARCOS, Facultad de Ciencias Físicas, Universidad Complutense de Madrid, 28040 Madrid, Spain
11
Ludwig-Maximilians-Universität, Professor-Huber-Platz 2, 80539 München, Germany
12
Max-Planck-Institut für Astronomie, Königstuhl 17, 69117 Heidelberg, Germany
13
Instituto de Investigación Multidisciplinar en Ciencia y Tecnología, Universidad de La Serena, Raúl Bitrán, 1305 La Serena, Chile
14
Departamento de Astronomía, Universidad de La Serena, Av. Juan Cisternas 1200 Norte, La Serena, Chile
15
Astrophysics Research Institute, Liverpool John Moores University, IC2, Brownlow Hill, Liverpool, Merseyside L3 5RF, UK
16
Department of Astronomy and Atmospheric Sciences, Kyungpook National University, Daegu 702-701, Korea
17
Korea Astronomy and Space Science Institute, Daejeon 305-348, Korea
18
Caltech-IPAC, MC 314-6, 1200 E California Blvd, Pasadena, CA 91125, USA
Received:
28
January
2020
Accepted:
18
March
2020
Stellar populations in barred galaxies save an imprint of the influence of the bar on the host galaxy’s evolution. We present a detailed analysis of star formation histories (SFHs) and chemical enrichment of stellar populations in nine nearby barred galaxies from the TIMER project. We used integral field observations with the MUSE instrument to derive unprecedented spatially resolved maps of stellar ages, metallicities, [Mg/Fe] abundances, and SFHs, as well as Hα as a tracer of ongoing star formation. We find a characteristic V-shaped signature in the SFH that is perpendicular to the bar major axis, which supports the scenario where intermediate-age stars (∼2 − 6 Gyr) are trapped on more elongated orbits shaping a thinner part of the bar, while older stars (> 8 Gyr) are trapped on less elongated orbits shaping a rounder and thicker part of the bar. We compare our data to state-of-the-art cosmological magneto-hydrodynamical simulations of barred galaxies and show that such V-shaped SFHs arise naturally due to the dynamical influence of the bar on stellar populations with different ages and kinematic properties. Additionally, we find an excess of very young stars (< 2 Gyr) on the edges of the bars, predominantly on the leading side, thus confirming typical star formation patterns in bars. Furthermore, mass-weighted age and metallicity gradients are slightly shallower along the bar than in the disc, which is likely due to orbital mixing in the bar. Finally, we find that bars are mostly more metal-rich and less [Mg/Fe]-enhanced than the surrounding discs. We interpret this as a signature that the bar quenches star formation in the inner region of discs, usually referred to as star formation deserts. We discuss these results and their implications on two different scenarios of bar formation and evolution.
Key words: galaxies: formation / galaxies: evolution / galaxies: stellar content / galaxies: structure / galaxies: star formation / galaxies: kinematics and dynamics
© ESO 2020
1. Introduction
Most disc galaxies in the nearby universe are barred, with numerous observational studies finding fractions of the order of 60−80% (Eskridge et al. 2000; Menéndez-Delmestre et al. 2007; Aguerri et al. 2009; Masters et al. 2011; Buta et al. 2015; Erwin 2018). In principle, one would expect this number to be even higher because bars are long-lived (Gadotti et al. 2015) and it is extremely difficult to avoid bar-forming instabilities in numerical simulations of disc galaxies (e.g. Berrier & Sellwood 2016; Bauer & Widrow 2019). These statistics already demonstrate that studying bars is essential for the global understanding of galaxy evolution.
Bars are very efficient in the radial redistribution of matter and angular momentum and, thereby, they drive the formation of nuclear structures, such as inner bars (de Lorenzo-Cáceres et al. 2012, 2013), nuclear rings, or nuclear discs (Debattista et al. 2006; Athanassoula 2013; Sellwood 2014; Fragkoudi et al. 2019), as well as outer structures, such as inner and outer rings (see also Buta 1986; Buta & Combes 1996; Rautiainen & Salo 2000). At the same time, they are believed to intensify the global cessation of star formation in late stages of galaxy evolution (Masters et al. 2012; Hakobyan et al. 2016; Haywood et al. 2016; Khoperskov et al. 2018; George et al. 2019). They may play a role in feeding active galactic nuclei (AGN) by transporting gas inwards, but this is a heavily discussed subject and still somewhat inconclusive (Ho et al. 1997; Coelho & Gadotti 2011; Oh et al. 2012; Cheung et al. 2015; Galloway et al. 2015; Goulding et al. 2017; Alonso et al. 2018).
The impact of bars in shaping their host galaxies has been studied in detail in the literature. In contrast, quantitative observational studies of internal properties of bars, such as star formation and stellar populations, are still scarce. Observations of stellar populations in bars provide information about processes during bar formation and evolution. Among possible sources for a variation of stellar populations are localised star formation during certain periods in time, radial migration of stars, quenching of star formation, and other dynamics of stars and gas.
Most observational studies so far have been focused on stellar population gradients along the bar major axis as compared to the outer disc or to the minor axis of the bar (Pérez et al. 2007, 2009; Pérez & Sánchez-Blázquez 2011; Sánchez-Blázquez et al. 2011; Seidel et al. 2016; Fraser-McKelvie et al. 2019) or compared to an unbarred control sample (Sánchez-Blázquez et al. 2014). From theory, we could expect a flattening of mean stellar parameters along the major axis. From stellar dynamics, we know that stars get trapped in periodic and quasi-periodic orbits in the bar potential. However, Sellwood & Binney (2002) showed that, when spiral arms are present in a galaxy, stars can gain or lose angular momentum at the corotation resonance without heating the disc (see also Grand et al. 2012; Halle et al. 2015, 2018). This process can be enhanced by coupling with a bar potential (Minchev & Famaey 2010). As a consequence, stars migrate radially, which would result in a flattening of the stellar chemical abundance gradient (Grand et al. 2015). With a growing bar, this process can affect large parts of the disc, but apparently in simulations it is mostly visible outside corotation, that is, outside the bar region (e.g. Friedli et al. 1994; Di Matteo et al. 2013). Additionally, gradients along bars are expected to be flat due to orbital mixing (Binney & Tremaine 1987). Bars are confined elongated structures. In any spatial resolution element within the bar, stellar orbits with different elongations and apocentres cross or come very close together. This results in a mixing and a flattening of measured stellar population gradients along the bar. From observational studies, the results still somehow seem ambiguous, but they mostly indicate a flattening along the major axis (Sánchez-Blázquez et al. 2011; Seidel et al. 2016; Fraser-McKelvie et al. 2019).
However, the distribution of stellar populations is influenced by more factors. From hydrodynamical simulations of gas dynamics in barred galaxies, we know that gas flows inwards in thin stream lines along the leading edges1 of rotating bars (Athanassoula 1992; Piner et al. 1995; Kim et al. 2012; Li et al. 2015; Renaud et al. 2015; Sormani et al. 2015; Fragkoudi et al. 2016). If gas is present and star formation is not suppressed by shear, star formation is expected to occur along the leading edges of the bar. This was observationally confirmed in Neumann et al. (2019), where we found that only some bars show signs of ongoing star formation and it is predominantly located on the leading side (see also Sheth et al. 2002). Such a pattern could be observed in the youngest stellar populations, but it is expected to be washed out quickly due to orbital mixing and short dynamical timescales (∼100 Myr).
Additionally, a local cessation of star formation would also leave its imprints on the stellar populations in the form of a truncated star formation history (SFH) or elevated [Mg/Fe] values, the latter of which is commonly used as a time-scale indicator of the SFH. Seidel et al. (2016) found that the main disc is usually less α-enhanced than the bar indicating a more continuous star formation, while more central parts of the disc have been observed with truncated SFHs due to the action of bars (James & Percival 2016, 2018).
Finally, recent N-body simulations have shown that stars could be trapped in bar orbits with different elongations based on the initial kinematics of the stars or the gas from which they form (Athanassoula et al. 2016, 2017; Debattista et al. 2017; Fragkoudi et al. 2017). This could lead to different populations dominating at different locations in the bar.
In this work, we present spatially resolved stellar population analyses of nine barred galaxies from the Time Inference with MUSE in Extragalactic Rings (TIMER) project studied with the Multi-Unit Spectroscopic Explorer (MUSE; Bacon et al. 2010) on the Very Large Telescope (VLT). We specifically concentrate on the bar region, while other components of the galaxies will be analysed in future papers by the collaboration. In addition to stellar ages, metallicities, and [Mg/Fe] abundances, we present a detailed analysis of SFHs across bars and we use Hα measurements to connect young stellar populations to places of ongoing star formation. Furthermore, we compare our results to the bars in magneto-hydrodynamical cosmological simulations of the Auriga project (Grand et al. 2017).
With the high spatial resolution of our data, we are able to resolve the bar not only along the major axis but also across its width. In this paper, we explore the stellar populations of bars to better understand processes during their formation and evolution that include star formation, quenching, radial migration, and kinematic differentiation.
The outline of the paper is as follows. In Sect. 2, we present the TIMER sample, the selection of our sub-sample, and the observations with MUSE, as well as the emission line and stellar population analysis. In Sect. 3, we show 2D maps of spatially resolved Hα and stellar population properties, followed by an analysis of gradients along 1D pseudo-cuts extracted from the maps in Sect. 4. In Sect. 5, we present results from detailed SFHs. Finally, we discuss some of the most important results in Sect. 6, where we also compare our observations to simulations from the Auriga project, and we conclude the work in Sect. 7.
2. Data and analysis
2.1. Sample selection and MUSE observations
The present work is part of the TIMER project (Gadotti et al. 2019, hereafter Paper I), a survey with the MUSE integral field unit (IFU) spectrograph that aims at studying the central structures of 24 nearby barred galaxies. One of the main goals of the project is to estimate the epoch when galactic discs dynamically settle, which leads to the formation of bars. The feasibility is demonstrated in a pilot study of the galaxy NGC 4371 (Gadotti et al. 2015). Within the TIMER collaboration, TIMER data have been used to study the assembly of double-barred galaxies (de Lorenzo-Cáceres et al. 2019) to find that inner bars also buckle (Méndez-Abreu et al. 2019) and to explore bar-driven effects on the interstellar medium, central star formation, and stellar feedback (Leaman et al. 2019).
The parent sample of the TIMER project is of the Spitzer Survey of Stellar Structures in Galaxies (S4G; Sheth et al. 2010) and includes only nearby (d < 40 Mpc), bright (mB < 15.5), and large (D25 > 1′) galaxies. From this catalogue, TIMER galaxies were selected based on mass (M⋆ > 1010 M⊙), inclination (i < 60°), and the presence of a bar and prominent central structures, such as nuclear rings or nuclear discs. The latter was judged by consulting the morphological classification in Buta et al. (2015).
Out of the 24 nearby barred galaxies in the TIMER sample, 21 galaxies have been observed with MUSE to date. From these 21 objects, we selected all galaxies where almost the entire bar (80% of the semi-major axis of the bar) is covered by the MUSE field-of-view (FOV) so as to be able to study gradients along bars. The final sample consists of nine galaxies, the bars of six of them completely fit into the MUSE FOV. In Fig. 1, we show infrared 3.6 μm S4G images of the sample superimposed with the approximate outline of the MUSE FOV. The main parameters of the sample are summarised in Table 1. This table includes parameters for the bars from the S4G analyses to constrain the bar region (length, ellipticity, and position angle) from Herrera-Endoqui et al. (2015)2 and the bar strength from Díaz-García et al. (2016), which we use to compare to stellar population parameters derived from the TIMER observations.
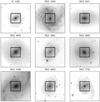 |
Fig. 1. S4G images at 3.6 μm for the complete sample. The black squares show the approximate MUSE FOV. |
Summary of the main parameters of the sample.
Observations of eight of the galaxies were performed during ESO Period 97 from April to September 2016. NGC 4371 was subject to our science verification programme for MUSE (Gadotti et al. 2015) and observed between 25 and 29 June 2014. The MUSE instrument covers a 1 squared arcmin FOV with a spatial sampling of 0.2″ and a spectral sampling of 1.25 Å per pixel. We used the nominal setup with a wavelength coverage from 4750 Å to 9350 Å at a mean resolution of 2.65 Å (full-width-at-half-maximum, FWHM). The typical seeing during observations was 0.8″ − 0.9″. The data was reduced with the MUSE pipeline v1.6 (Weilbacher et al. 2012) applying the standard calibration plan. Details of the TIMER sample selection, the observations, and the data reduction can be found in Paper I.
2.2. Emission line analysis
The extraction of emission line fluxes for all TIMER galaxies was performed by employing the code PYPARADISE, an extended version of PARADISE (see Walcher et al. 2015). One of the advantages of PYPARADISE is that it propagates the error from the stellar absorption fit to the emission line analysis. The procedure was done on a spaxel-by-spaxel basis to retrieve the fine spatial structure of the gas component. This is possible due to the generally high signal-to-noise ratio (S/N) in the emission lines. The stellar absorption features, however, are usually less pronounced. For that reason, we Voronoi binned the cubes with a minimum S/N of ∼40 to estimate the underlying stellar kinematics. For self-consistency and to make use of the internal error propagation, we did not use the kinematics derived with PPXF that we describe in the next sub-section, but performed an independent analysis with PYPARADISE.
The procedure can be summarised in three steps, further details can be found in Paper I. First, the stellar kinematics are measured by fitting a linear combination of stellar template spectra from the Indo-US template library (Valdes et al. 2004) convolved with a Gaussian line-of-sight velocity kernel to the Voronoi-binned spectra in the cube. Second, in each spaxel, the continuum is fitted with fixed kinematics according to the underlying Voronoi cell. Finally, the emission lines are modelled with Gaussian functions in the continuum-subtracted residual spectra. To estimate uncertainties, the fit is repeated 30 times in a Monte Carlo simulation after modulating the input spectra by the formal errors and by using only 80% of the template library.
The extracted Hα fluxes have to be corrected for dust attenuation. For that purpose, we used the ratio of Hα/Hβ = 2.86 (Balmer decrement from case B recombination), which is intrinsically set by quantum mechanics. Since the attenuation is wavelength dependent, the observed ratio changes and can thus be used to correct for the effect of dust on the emission line fluxes. We used the prescription by Calzetti et al. (2000) to account for the wavelength dependent reddening.
2.3. Derivation of stellar population parameters
A detailed description of the extraction of stellar population parameters for the whole set of TIMER galaxies is given in Paper I. Here we summarise the main steps of the procedure.
To ensure a high-quality analysis, the spectra in each cube were spatially binned using the Voronoi method of Cappellari & Copin (2003) to achieve a minimum S/N of ∼40 per spatial element. The spectrum of each Voronoi bin was then analysed as follows.
First, the stellar kinematics were determined by employing the penalised pixel fitting code PPXF (Cappellari & Emsellem 2004; Cappellari 2017) with the E-MILES single stellar population (SSP) model library from Vazdekis et al. (2015). Subsequently, with fixed stellar kinematics, the nebular emission was fitted and removed with the code GANDALF (Sarzi et al. 2006; Falcón-Barroso et al. 2006). Afterwards, we modelled ages, metallicities, and SFHs on the emission-free residual spectra employing the code STECKMAP (STEllar Content and Kinematics via Maximum A Posteriori; Ocvirk et al. 2006a,b) with the E-MILES library and assuming a Kroupa (2001) initial mass function (IMF). We employed the BaSTI isochrones (Pietrinferni et al. 2004, 2006, 2009, 2013) with stellar ages ranging from 0.03 − 14.0 Gyr and metallicities (Z) from 0.0001 to 0.05, corresponding to [Z/H] ranging from −2.3 to 0.4. We refer to Paper I for further technical details.
Uncertainties as to the derivation of mean stellar ages and metallicities from the SFHs produced by STECKMAP were studied for a set of 5000 spectra from the TIMER data in Appendix A of Paper I. Typical values are 0.5 − 1 Gyr for age, and 0.005 − 0.010 for metallicity (Z).
Since STECKMAP is not capable of measuring [Mg/Fe] abundances, we exploited the PPXF routine to derive those values in a similar but slightly optimised set-up (see, e.g. Pinna et al. 2019). The implementation of this analysis is based on the GIST pipeline3 (Bittner et al. 2019) and further details of the analysis are described in Bittner et al. (in prep.). A comparison between the results obtained from STECKMAP and PPXF is currently being conducted within the TIMER collaboration and will be published soon. Differences are found to be minimal. In the following, we summarise the main steps of exploiting the PPXF routine.
In order to obtain reliable estimates of the [Mg/Fe] values, in this analysis, we spatially bin the data to an approximately constant S/N of 100. We note that all spaxels which surpass this S/N remain unbinned while those below the isophote level that has an average S/N of 3 are excluded from the analysis. As a line-spread function of the observations, we adopt the udf-10 characterisation of Bacon et al. (2017).
We employ the wavelength range of 4800 Å−5800 Å together with the MILES model library from Vazdekis et al. (2010), covering a large range in ages and metallicities, and two [α/Fe] values of 0.00 and 0.40. In the given wavelength range, the best-fit combination of templates with regard to their [α/Fe] value is driven only by the Mg lines and, since it is not clear if all α-elements are enhanced at the same level, we, thus, refer to this abundance in the following as [Mg/Fe]. The models employ the BaSTI isochrones (Pietrinferni et al. 2004, 2006, 2009, 2013) and the revised Kroupa initial mass function (Kroupa 2001). In order to account for differences between observed and template spectra, we include an 8th-order, multiplicative Legendre polynomial.
The analysis is performed in three steps: We first derive the stellar kinematics with PPXF with emission lines that are masked, before modelling and subtracting any gaseous emission with PYGANDALF – a python implementation of GANDALF. Then, we perform a regularised run of PPXF to estimate the population properties, while keeping the stellar kinematics fixed to the results from the unregularised run. The strength of the regularisation that is used is the one at which the χ2 of the best-fitting solution of the regularised run exceeds the one from the unregularised run by  , with Npix being the number of spectral pixels included in the fit. This criterion is applied to one of the central bins with a high S/N and then used for the entire cube (Press et al. 1992; McDermid et al. 2015).
3. Resolved 2D properties
3.1. Recent star formation as traced by Hα
To get a complete picture of the stellar population properties in bars, it is important to connect the study of the SFH with ongoing star formation. A detailed investigation of star formation in bars was conducted for a different sample in Neumann et al. (2019). There, we found that bars clearly separate into either star-forming or non-star-forming and, if star formation is present, it is predominant on the leading edge of the rotating bar. In the present work, we explore how star formation is connected to the stellar populations in the bar.
From the MUSE data cubes, we derived Hα maps as a tracer of H II regions and, thus, star formation for the complete set of galaxies. Given that gas can also be ionised by AGN or shocks, we derived Baldwin, Phillips, & Terlevich diagrams (BPT diagrams; Baldwin et al. 1981) that showed that Hα emission in the bar and the disc is not affected by the AGN and can safely be accounted to star formation.
In Fig. 2 we plotted Hα maps for all galaxies in the sample. This figure shows that most galaxies have ongoing star formation either along spiral arms (NGC 4303, NGC 4981, NGC 5248), at the ends of the bar (IC 1438) or in a ring-like feature (NGC 6902, NGC 7755). Additionally, central regions often show nuclear structures (discs, rings, or point sources) that are partially caused by star formation as well as by ionisation from the AGN (as revealed by the BPT diagrams).
 |
Fig. 2. Dust-corrected Hα maps for the complete sample. Only fluxes with a S/NHα > 5 and S/NHβ > 5 are shown. Black ellipses outline the approximate extent of the galaxy bar. NGC 4371 does not have any Hα above the S/N cut. |
That being mentioned, there is a clear lack of star formation between the centre and the ends of the bar for all bars. Some galaxies show star formation at the edges of the bar (NGC 4303 and a few blobs in IC 1438, NGC 4981, NGC 6902, NGC 7755), while others show none at all. This means that for most galaxies there is a supply of cold gas in the outer disc that either does not reach the bar region or the star formation is suppressed within the bar, for example, by means of strong velocity gradients. Interestingly, ionised gas is seen in the centre of all galaxies except in NGC 4371, indicating that gas has been flown inwards. In fact, colour maps of the TIMER galaxies in Fig. 2 of Paper I show dust lanes in the bars in seven of our galaxies, which implies the presence of cold gas flows. Only do NGC 4371 and NGC 4643 show no clear sign of gas in the bar. We connect these results with the stellar population analysis in the next section.
The galaxy NGC 5248 is a peculiar case. Seen in Hα, it seems to have a very large nuclear disc (∼1 kpc) with spiral-like features attached to it inside the bar region. It shows an outlier in the subsequent plots in this paper.
3.2. Stellar ages and metallicities
In Figs. 3 and 4, we show spatially resolved maps of light-weighted mean stellar ages and metallicities, respectively. From a careful examination of the figures, we conclude that bars are typically older or as old as the part of the disc immediately surrounding the bar. This is in agreement with a suppression of star formation in the bars as seen in the previous section. Furthermore, we observe that bars are more metal-rich or as rich as the surroundings. Interestingly, for three galaxies (NGC 4371, NGC 4981, NGC 4984), we see low metallicity regions in the bar between the centre and the end of the bar. These regions of lower metallicities are seen more frequently in the mass-weighted maps (Fig. E.1), where both bars and discs are mostly old. However, we caution that the conversion from light to mass usually introduces additional uncertainties.
 |
Fig. 3. Light-weighted maps of mean stellar ages. Contours of the surface brightness distribution from the MUSE whitelight images are shown in white. Black ellipses outline the approximate extent of the bars. |
 |
Fig. 4. Light-weighted maps of mean stellar metallicities. Contours of the surface brightness distribution from the MUSE whitelight images are shown in white. Black ellipses outline the approximate extent of the bars. |
3.3. [Mg/Fe] abundance ratios
The measurement of [Mg/Fe] can shed further light on the formation process of different components in a galaxy. This ratio has been traditionally used as a time-scale indicator of the SFH. On the one hand, Mg is almost exclusively produced by massive, exploding stars, and released to the interstellar medium in timescales of a few million years. On the other hand, the largest fraction of iron-peak elements are produced in type Ia supernovae (with a minor but important contribution from core-collapse supernovae, see e.g. Maiolino & Mannucci 2019 or Bose et al. 2018) which, after an episode of star formation, occur over an extended period of time following a distribution of delay times (e.g. Matteucci 1994; Greggio et al. 2008). Quantifying the duration of the star formation using the [Mg/Fe] ratio is difficult since the relation between these parameters can be modified by differences in the star formation rate, the initial mass function, or the type Ia mechanisms. However, the comparison of [Mg/Fe] in different regions of the galaxies can give us a qualitative idea as to the violence of the star formation processes and, therefore, the physical mechanisms involved in their formation (e.g. Thomas et al. 1999).
We present our measurements of [Mg/Fe] in Fig. 5. We notice that [Mg/Fe] in the bar is typically intermediate between the nuclear disc or nuclear ring component and the surrounding disc, where more elevated values of [Mg/Fe] are found. This is in accordance with the results found for inner bars as compared to the nuclear discs in the double-barred galaxies NGC 1291 and NGC 5850 in the TIMER project (de Lorenzo-Cáceres et al. 2019) and this supports the picture in which primary and inner bars are formed in similar ways.
 |
Fig. 5. Spatially resolved Voronoi-binned maps of light-weighted [Mg/Fe]. Contours of the surface brightness distribution from the MUSE whitelight images are shown in white. The positions of the bars are shown in black and approximated by ellipses. |
Interestingly, by studying 16 barred galaxies from the Bars in Low Redshift Optical Galaxies (BaLROG) sample with IFU data from the SAURON instrument (Bacon et al. 2001), Seidel et al. (2016) found that the outer discs are less α-enhanced than the bars. However, the [α/Fe] of the discs in their sample is measured outside the bar radius. In contrast, the disc region that our measurements in TIMER cover is restricted within the radial range of the bar for most of the galaxies. This region, which encompasses the part of the disc that is within the bar radius but outside of the bar, is typically termed the “star formation desert” (SFD; James et al. 2009; James & Percival 2016). In our sample, NGC 7755 in Fig. 2 is a nice example of a SFD between the nuclear and the inner ring of Hα. It seems that star formation is being suppressed by the bar in the SFD. In fact, a truncation of the SFH in SFDs has been found in observations (James & Percival 2016, 2018) and, as a more gradual decline, in cosmological zoom-in simulations (Donohoe-Keyes et al. 2019). In this work we, thus, find higher [Mg/Fe] abundances in the SFDs than in the bars. This result can be explained by a rapid suppression of star formation in the SFD after the formation of the bar and a more extended SFH in the bar. An even more extended period of star formation in the disc outside the radius of the bar, as reported by Seidel et al. (2016), fits well within the same picture in which many bars quench star formation within the bars themselves, while the outer discs are still forming stars (e.g. Neumann et al. 2019).
4. Stellar population gradients
4.1. Profiles along the bar major and minor axis
So far, most research on stellar populations in bars has focussed on profiles along the bar major axis compared to either the disc (e.g. Sánchez-Blázquez et al. 2011; Fraser-McKelvie et al. 2019) or the bar minor axis (Seidel et al. 2016). Before we present our results of a different approach, we first show gradients of ages and metallicities along the bar major and minor axis for the sake of comparison with previous studies.
We extracted the major and minor axis profiles from pseudo slits of 2″ width on top of the Voronoi-binned 2D mean age and metallicity maps for each galaxy. The observed distance along the axes (Robs) was deprojected to the plane of the galaxy (Rgal) by applying the formula
where i is the inclination of the disc and ΔPA = PAdisc − PAR is the difference between the position angles of the disc and the axis of Robs.
In Appendix B, we explain the derivation of the gradients in more detail and show an example for the galaxy NGC 4303 in Figs. B.1 and B.2. Clear breaks in the major- and minor-axis profiles of age and metallicity are apparent in the inner regions of all galaxies, which is in agreement with Seidel et al. (2016). These authors report breaks commonly at 0.13 ± 0.06 bar length. We find two breaks, which we can visually identify: The first break is typically at or near the position of a nuclear structure, such as a nuclear disc or nuclear ring; afterwards, a transition zone presumably follows (between the regions where the nuclear structure and the bar dominate the measurements), which ends at the second break. The second break in our sample is located, on average, at r = 0.29 ± 0.09 times the bar length. We chose the range between that break and the bar length in order to measure gradients using a linear regression along the bar major and minor axis. The implication is that what we call the “gradient of the minor axis” is typically measured in the disc along the extension of the minor axis. This is illustrated schematically in Fig. 6. The gradients presented in the following were measured along the blue arrows annotated as MA and MI.
 |
Fig. 6. Sketch of a rotating elongated bar in a face-on disc to illustrate the axes along which the stellar population gradients were measured. The solid-line elongated ellipse outlines the bar that rotates counter-clockwise as indicated by the arrow. The dashed lines mark the bar major and minor axes and the dot-dot-dashed circle gives the bar radius. The gradients discussed in Sect. 4.1 were measured along the blue arrows and the gradients in Sect. 4.2 along the green arrows. MA – along the major axis; MI – along the extension of the minor axis; L – from the major axis towards the leading edge of the bar; T – from the major axis towards the trailing edge of the bar. |
In Fig. 7, we present our results. The values are tabulated in Table 2. Light-weighted age gradients are negative with no systematic difference between major and minor axes, yet on average the gradients are steeper on the major axis. Mass-weighted age gradients are flatter as compared to light-weighted ages with a larger scatter between individual objects on the minor axes than on the major axes. The mean mass-weighted values are −0.05 ± 0.32 Gyr kpc−1 for the major axes and −0.27 ± 0.66 Gyr kpc−1 for the minor axes (the errors are standard deviations from the mean). Hence, the age gradient along the major axis is, on average, flatter than on the minor axis.
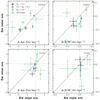 |
Fig. 7. Gradients of deprojected age and metallicity profiles for light- and mass-weighted mean values along the bar major and minor axes. An example of such profiles is shown in Fig. B.2. Gradients were measured between the second inner break and the bar length as seen in the aforementioned figure and as discussed in the text. The minor axes are extended into the disc within the bar radius. Points are grouped into three bins of bar strength Qb. NGC 5248 is an outlier and shown separately. Error bars show standard errors from the linear regressions to the profiles. |
Gradients along the bar major and minor axis.
Light-weighted gradients in [Z/H] are flatter on the major axes with respect to the minor axes and predominantly negative. They are slightly flatter for mass-weighted values with means of +0.02 ± 0.03 dex kpc−1 for the major axes and −0.02 ± 0.06 dex kpc−1 for the minor axes. Six out of nine objects have a positive and close-to-zero mass-weighted metallicity gradient along the major axis.
In addition to comparing the gradients along the major and minor axes, we also separated them according to the bar strengths Qb taken from Díaz-García et al. (2016). This parameter is a measure of the maximum gravitational torque in the bar region. It is commonly used as a criterion to classify bars as either strong or weak. During the evolution of a bar, it usually grows longer and stronger (Athanassoula & Misiriotis 2002; Elmegreen et al. 2007; Gadotti 2011; Díaz-García et al. 2016). In Fig. 7 there is not much difference in the measured gradients between bars of different strengths. However, weaker bars seem to scatter more in the plot than stronger bars. Weak bars are usually smaller and less massive than strong bars. Consequently, the photometrical contrast with the underlying disc is smaller, which could explain the larger scatter. A different explanation is that weaker bars could be younger and they may not have had enough time to “flatten” the gradients.
In general, our results that indicate a flattening along the bar major axis agree with recent results from the literature. In the BaLROG sample, Seidel et al. (2016) found that gradients of age, metallicity, and [α/Fe] abundance along the bar major axis are flatter than the gradients along the minor axis, which are similar to those in discs of an unbarred control sample. In fact, they report a metallicity gradient along the major axis of 0.03 ± 0.07 dex kpc−1, which is very similar to our result. However, their mean gradient along the minor axis is −0.20 ± 0.04 dex kpc−1 and thus much steeper than the one we found in our sample. It is likely an effect of the different radial range over which the minor axis gradient was measured. Here, it was measured between the break at ∼0.29 ± 0.09 × bar length and the full length of the bar. In contrast, they measured it mostly within the width of the bar. A flatter gradient along the bar is also confirmed in Fraser-McKelvie et al. (2019), studying 2D bar and disc regions of 128 strongly barred galaxies from the MaNGA survey (Bundy et al. 2015). Similarly, using long-slit observations, Sánchez-Blázquez et al. (2011) studied two of the bars in Pérez et al. (2009) and found that they are flatter in age and metallicity as compared to the gradients along the major axis of the discs in which they reside.
In summary, we find close-to-zero mass-weighted age and metallicity gradients along the major axis of the bar that indicate the influence of the bar on the stellar populations. However, differences to the gradients along the minor axis are not very large; especially for weaker bars, individual results produce significant scatter.
4.2. Profiles across the width of the bar
The stellar bar as we observe it in 2D projection is a superposition of stars that are trapped in mainly elongated orbits around the galaxy centre. Analyses of orbital structure in the gravitational potential of a barred disc galaxy reveal that bars are built from families of periodic and quasi-periodic orbits with different extents, elongations, and orientations (e.g. Contopoulos & Papayannopoulos 1980; Athanassoula et al. 1983; Pfenniger 1984; Skokos et al. 2002a,b). One of these families is comprised of the x1 orbits, which are elongated parallel to the bar major axis and build the backbone of the bar. Within the x1 family, higher energy orbits are rounder and reach further into the disc and farther away from the bar major axis, whereas lower energy orbits are more elongated and closer to the bar major axis. Our aim is to investigate whether there are differences or trends in stellar populations across different orbits in the x1 family that could help us to understand the formation and evolution of the bar.
4.2.1. Selection of 1D pseudo-cuts
We approached this problem by constructing a series of 1D cuts of 4″ width perpendicular to the bar major axis4. We used four parallel cuts at both sides of the minor axis: a central cut on top of the minor axis, two cuts at the distances of one third and two thirds of the bar length, respectively, and one cut at the end of the bar. The cut at the end of the bar was not computed for the galaxies for which the complete length of the bar is not inside the FOV. Afterwards, every pair of equidistant cuts with respect to the minor axis was averaged in the anti-parallel direction (with the exception of the central common cut). The procedure is illustrated in Fig. 8. This approach ensures averaging the leading edge of a rotating bar with the opposite leading edge, and the trailing edge with the opposite trailing edge5. The result is a set of four profiles going from the leading to the trailing edge, which cuts across the widths of the bar at different distances from the centre.
 |
Fig. 8. Important closed periodic orbits in an analytic rotating bar potential. The bar major axis is horizontal. Orbits elongated parallel to the major axis are members of the x1 family. Orbits elongated perpendicular to the major axis form the x2 and x3 families. Superimposed on the orbits, we show a sketch of the equidistant anti-parallel vectors along which the stellar populations are binned and averaged. The cuts are numbered from 0 to 3, where #0 is crossing the centre of the galaxy and #3 is at the end of the bar. These numbers are found in the following figures and text. |
In Fig. C.1, we show the same 2D maps of light- and mass-weighted mean ages and metallicities for all galaxies, but, here, we show this together with the four aforementioned profiles. Additionally, along the cuts, we plotted Hα densities and the total surface brightness. We also marked the position of dust lanes. A very simplified version of these figures is shown for the galaxy NGC 4981 in Fig. 9. We discuss our method and general results on the basis of this simplified example. For in-depth details of single objects, we refer the reader to Appendix C.
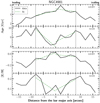 |
Fig. 9. Very simplified and shortened version of Fig. C.1 as an example for NGC 4981. Light- and mass-weighted age and metallicity profiles along cut #2 (see Fig. 8) perpendicular to the bar major axis are shown. The width of the cuts is 4″ and bins are equally spaced every 2″ along the cuts. The two cuts #2 are averaged in the anti-parallel direction as shown in Fig. 8. Vertical lines mark the edges of the bar. Linear regression fits from the major axis to the edges of the bar are shown in green. The slopes of these fits are tabulated in Table 3 and plotted in Figs. 10 and 11. |
The profiles in Fig. 9 show light- and mass-weighted mean age and metallicity along the averaged cut #2 following the annotation in Fig. 8, that is, the cut at 2/3 of the bar length. Gradients were computed from linear regression fits to the profiles from the major axis towards both edges of the bar, which were determined from the lengths and ellipticites of the bar in Table 1 and Herrera-Endoqui et al. (2015). For simplicity, in this method, the shape of the bar is assumed to be rectangular. The difference between this approach and the method described in Sect. 4.1 can be seen in Fig. 6. The gradients described in this sub-section were measured along the green arrows annotated as L and T. This procedure was done for all galaxies. We selected the cut at the distance of two thirds of the bar length to the centre because it is far enough away from the centre to be not contaminated by a central component and it is still well within the bar region.
4.2.2. Age and metallicity gradients
The results are presented in Fig. 10 for ages and Fig. 11 for metallicities. We compare the gradients from the leading to the trailing side as well as the light-weighted and mass-weighted quantities.
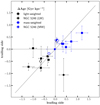 |
Fig. 10. Gradients of light- and mass-weighted mean stellar age profiles along the cut #2 (see Fig. 8) perpendicular to the bar major axes (at 2/3 of the bar length) as shown in Fig. 9, as well as in Fig. C.1 and described in the text. The gradients from the major axes towards the leading (x-axis) and trailing (y-axis) edges of the bars are shown. The sense of rotation was determined assuming that spiral arms are trailing. Empty markers show galaxies for which the rotation is not clear. NGC 5248 is an outlier and shown separately. Error bars show standard errors from the linear regressions to the profiles. |
In the top panel of Fig. 9, we observe that the light-weighted age profile peaks close to the major axis and decreases towards both sides. Furthermore, we see that the gradient is steeper on the leading edge. Interestingly, in the mass-weighted profile, we see exactly the opposite trend. This behaviour is common to almost all galaxies in the sample. It is clearly apparent in Fig. 10, because almost all light-weighted gradients are negative and located in the bottom-left quadrant above the one-to-one line, and because mass-weighted gradients are located in the positive top-right quadrant. Differences between the centre and the edge of the bar can be small, especially in mass-weighted ages (∼2 Gyr in Fig. 9), but they are reliable given the systematic trends across different bars as seen in Fig. 10. The slightly steeper light-weighted gradients on the leading edges correlate with the appearance of Hα on the edges of those bars as can be seen in Fig. C.1. NGC 5248 is a clear outlier similarly to what has been seen in previous plots.
The differences between light-weighted and mass-weighted mean stellar population parameters are simply explained by biases towards different underlying stellar populations. Light-weighted mean ages are biased towards the ages of the youngest and, therefore, more luminous stars. This effect is substantially reduced in mass-weighted quantities, which rather emphasise populations with intermediate to old ages. The negative light-weighted age gradients are a clear indication for the presence of young stellar populations on the edges of the bar with a slight predominance on the leading side. This is in agreement with the general picture that, if there is star formation in a bar, it is preferentially happening on the leading side (e.g. Sheth et al. 2008; Neumann et al. 2019), but this is the first time this is seen in the mean ages of stellar populations. At the same time, the positive mass-weighted gradients indicate that the stellar populations close to the bar major axis are younger than at the edges. This is an important result that will be strengthened by more details pertaining to the SFH and which is discussed in the following section.
Light-weighted metallicity gradients are, on average, shallow and negative with a mean of −0.05 ± 0.05 dex kpc−1 on both sides. Mass-weighted gradients are a bit flatter and mostly positive with a mean of 0.04 ± 0.05 dex kpc−1 on the leading side and 0.01 ± 0.05 dex kpc−1 on the trailing side. Thus, there are no significant differences between the leading and trailing edge.
4.3. An alternative visualisation
An alternative way of visualising the data and results that we discussed in Sects. 3 and 4.2 is shown in light-weighted means for NGC 4643 as an example in Fig. 12 and for the whole sample in light-weighted and mass-weighted means in Figs. A.1 and A.2, respectively. In these plots, we directly compare [Mg/Fe] with the metallicity and age for each bin within the bar. The points are colour-coded by their shortest distance to the bar major axis normalised by the width of the bar. Bins that are within the nuclear structure close to the centre of the galaxy are shown separately. The radius of the nuclear structure is taken from Gadotti et al. (in prep.). The data presented in these figures is based on the analysis with PPXF since STECKMAP does not provide [Mg/Fe] measurements. Notwithstanding, we remark again that PPXF and STECKMAP return analogous results for these galaxies (Bittner et al., in prep.).
 |
Fig. 12. Comparison between light-weighted [Mg/Fe], metallicity, and age of the stellar populations in the bar of NGC 4643. Each point corresponds to one Voronoi bin as shown in Fig. 5. Bins are coloured by their distance to the bar major axis and only bins within the bar are shown. Bins within the nuclear structure are marked with different symbols and in light blue. These plots are shown for all galaxies in Figs. A.1 and A.2. |
The left panel in Fig. 12 shows some clear trends for NGC 4643 that agree with our previous analysis. As we move away from the bar major axis, the stars become more [Mg/Fe]-enhanced and more metal-poor. In the right panel we see that the stars in this particular bar are predominantly old, even in light-weighted mean ages that are biased towards younger populations. There is a small trend towards older ages as the distance to the major axis increases, but the scatter is large due to the difficulty to separate old populations in the fit. These results agree with the positive age gradient and the negative metallicity gradient perpendicular to the bar major axis tabulated in Table 3.
These trends are observed for the majority of bars as it can be seen in Figs. A.1 and A.2. However, it has to be noted that these figures mix all stars in the bar (except the nuclear structure) and they only separate stars perpendicularly, but not along the bar major axis. Thus, some of the trends that we observed along the clear cuts in Sect. 4.2 might be washed out in particular cases in the figures presented here.
5. Star formation histories
One single observation with the MUSE instrument of a galaxy provides 90 000 spectra, each of which contains information that makes it possible to disentangle, inter alia, the composite of young and old stellar populations, as well as metal-poor and metal-rich. The presentation of the full wealth of information from the spatially resolved SFH of a galaxy is a multi-dimensional problem and illustrating important aspects in the best way is a challenge. Two-dimensional maps of mean ages and metallicities, as shown in Sect. 3, are projections that keep the spatial information but average the parameters along the axis of time. In this sub-section, we present how stars of different ages shape the stellar bars that we observe. In the figures of SFH, we use the same spatial binning scheme along the cuts perpendicular to the bar major axis as presented previously.
The SFHs are shown for NGC 4981, as an example, along the four cuts in four different panels in Fig. 13. The last panel shows the profile at the end of the bar. In this panel, we see a very young and an old population with not much variation across the cut, which highlights that there is not much difference between the ends of the bar and the disc. In the Hα maps in Fig. 2, in fact, we see ongoing star formation at the end of the bar in NGC 4981, which is in agreement with the very young populations seen in the SFH. We now address the second and third panel, both of which contain information with less contamination from the nuclear structure (first panel) and the outer disc (last panel). The plots present clear evidence of a very young stellar population in the main disc, which is seen here as bright features of less than 1 Gyr left and right to the edges of the bar. Additionally, we recognise a “V-shape” in the ages above 2 Gyr, where stars at intermediate ages between 2 and 8 Gyr are more concentrated close to the major axis, while the oldest population (> 8 Gyr) is spread across the whole spatial range. This feature is not exclusive for this galaxy, and it can be seen in at least five out of nine galaxies in our sample (IC 1438, NGC 4643, NGC 4981, NGC 6902, NGC 7755). Plots of SFHs for the complete set of galaxies can be found in Fig. D.1. A consequence of this V-shape structure in the SFH is a positive age gradient from the major axis towards the edges of the bar that we did indeed observe for all but one galaxy in the mass-weighted mean ages in Fig. 10.
 |
Fig. 13. SFHs of NGC 4981 along the cuts illustrated in the sketch in Fig. 8. and in the Fig. C.1. Each panel shows one of the four cuts. The x-axis shows the distance to the bar major axis along the cut and the y-axis shows the age of the population. The fraction of stellar mass that is at a certain position and was formed at a certain time is colour-coded. The mass was normalised within each spatial bin (vertically in this diagram). The mass fractions were further divided by the size of the bin on the y-axis to correct for non-equally spaced bins on the linear age axis. White vertical lines mark the edges of the bar. Red lines are plotted on top to indicate the V-shape discussed in the text. |
These results indicate that intermediate age stellar populations are concentrated on more elongated orbits closer to the bar major axis than older stellar populations. They are consistent with the findings from idealised thin (kinematically cold and young) plus thick (kinematically hot and old) disc N-body galaxy simulations in Fragkoudi et al. (2017). In their Fig. 2, they show that the colder component forms a strong and thin bar, while the hotter component forms a weaker and rounder bar (see also Wozniak 2007; Athanassoula et al. 2017; Debattista et al. 2017; Fragkoudi et al. 2018). We further explore the parallels between our results from observations with simulations in Sect. 6.1.
6. Discussion
6.1. The origin of the V-shaped age distribution: Input from cosmological simulations
As discussed in Sect. 5, the SFHs along the cuts perpendicular to the major axis of the bar, shown in Fig. 13, have a distinctive V-shape when examining age versus distance perpendicular to the major axis of the bar. To better understand the origin of this V-shaped age distribution, we explore the SFHs in bars in the Auriga magneto-hydrodynamical cosmological zoom-in simulations (Grand et al. 2017). These are simulations of isolated Milky Way mass halos (1012 − 2 × 10¹² M⊙), which run from redshift z = 127 to z = 0, with a comprehensive galaxy formation model (see Grand et al. 2017 and references therein for more details on the simulations). These simulations form disc-dominated galaxies with a significant fraction of 2/3 at redshift z = 0 having prominent long-lived bars, with properties similar to those of barred galaxies in the local Universe (see Blázquez-Calero et al. 2020; Fragkoudi et al. 2019).
In the top left panel of Fig. 14, we show a face-on mass-weighted age map of one Auriga galaxy (Au18), where we clearly see a prominent bar from the surface density contours. We traced pseudo-slits perpendicular to the major axis of the bar in three different locations, as we did for the TIMER observations, and calculated the mean age of stars along the slits. These are shown in the top right panel of the figure, where we see that within the bar region (horizontal solid lines) there is a dip towards younger ages along the bar major axis. In the second row of the figure, we plotted the SFH in each slit, with the leftmost panel corresponding to the black slit and the rightmost panel corresponding to the light grey slit (outer part of the bar). We see that inside the white solid lines, which outline the edge of the bar, there is a characteristic V-shape as the one seen in our observations. Therefore the simulations show a similar V-shaped age distribution inside the bar region as the observations do6.
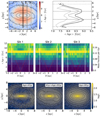 |
Fig. 14. Results from Auriga simulations. Top-left panel: face-on mass-weighted age map of halo 18 from the Auriga sample, over-plotted with three vertical lines that indicate the cuts used to extract the data shown in the other panels. The bar major axis is horizontal. Top-right panel: mean stellar age profiles along the cuts. Middle row: SFH diagrams for each of the cuts (the left panel corresponds to the dark slit and the rightmost panel corresponds to the light grey slit). The axis and the colour-coding are the same as in our observations shown in Fig. 13. The white solid lines mark the edges of the bar and the red dashed line indicates the V-shape that we discuss in the main text. Bottom row: face-on surface density projections of stars in the bar in three different age bins as indicated in the top right corner of each panel. We see that younger ages cluster along the bar major axis compared to older ages which have a rounder shape. |
To understand the origin of the V-shape, in the bottom panel of Fig. 14, we show the face-on surface density projections of stars in the model in the following three different age bins: for stars younger than 4 Gyr (left), stars with ages between 4 and 8 Gyr (middle), and stars older than 8 Gyr (right panel). We see that the youngest population has an elongated bar shape, much more so than the oldest population which is rounder. This difference in the shape of the bar according to the age and kinematics of the underlying population is shown using idealised simulations in Fragkoudi et al. (2017) and Athanassoula et al. (2017), and has been termed “kinematic fractionation” by Debattista et al. (2017). Therefore we see that the younger populations are more clustered along the bar major axis than the oldest populations due to kinematic fractionation, giving rise to the V-shape we see in the observations.
6.2. Stellar population properties within the bar radius in cosmological simulations
In this sub-section, we expand our comparison of barred galaxies between TIMER observations and Auriga simulations. We now focus on the spatially resolved 2D stellar population properties that are presented in Sect. 3 and we compare them to the simulations shown in Fig. 3 of Fragkoudi et al. (2019). The latter shows face-on views of ages, metallicities, and [α/Fe]-abundances of the inner region (< 5 kpc) of five simulated galaxies.
The authors find that the stellar populations along the bar major axis and at the ends of the bar tend to be younger than populations offset from the bar major axis, which leads to the V-shape in the SFH diagrams that we have already discussed. In our 2D light-weighted age maps (our Fig. 3), this effect is observed in younger stellar populations that are seen at the ends of the bar, although this is not so conspicuous in the mass-weighted maps (Fig. E.1) presumably because these maps include the additional uncertainties from the light-to-mass conversion and because small differences in very old ages are difficult to measure. On the other hand, our light-weighted age maps do not clearly show older populations on the edges of the bar as these maps are dominated by very young populations from recent and ongoing star formation outside the bar. Instead, our mass-weighted maps, which highlight older stellar populations better, show older populations on the edges of the bar in at least IC 1438 and NGC 7755 (although, admittedly, this effect is not as clear in the other galaxies). However, as discussed above, the effect is observed in the SFH diagrams as well as along the averaged 1D cuts perpendicular to the major axis.
Furthermore, in the simulations, the authors see that bars are more metal-rich than the surrounding discs. This is in good agreement with what we find in the maps of light-weighted metallicities (Fig. 4). Finally, we find that α-abundances in the simulations also agree very well with our results. Stars of low-α mainly cluster along the bar major axis, while the surrounding disc shows higher α-enhancement.
6.3. V-shaped age distribution: Where the time of bar formation fits in
The excellent physical spatial resolution of the TIMER data allowed us, for the first time, to provide observational evidence for a separation of stellar populations by the bar, as it was recently predicted from simulations. In this concept, initially co-planar cold-and-young and hot-and-old stellar populations are mapped into bar-like orbits according to their velocity dispersion, with colder populations getting trapped on more elongated orbits, as opposed to hotter populations, which get trapped on rounder orbits.
It is still an open question as to if and how stars, which form after the bar, get separated. The key for the morphological separation is the kinematics of the stellar populations or the gas out of which they form, since the bar doesn’t have a different gravitational pull on stars just because they are young or old. One possibility is that gas settles into dynamically colder configurations over time and thus stars form in more elongated orbits. An interesting question is whether there is a second mechanism in which a star that forms in cold orbits would heat, for example through interactions, and therefore migrate to higher energy orbits, that is, to rounder bar orbits that are further away from the bar major axis.
To shed light on these mechanisms, it would be very interesting to determine the time of bar formation for the galaxies in this sample. This is, in fact, one of the main goals of the TIMER project and it is currently a work in progress. The result gives us a horizontal line on the SFHs shown in Figs. 13 and D.1. Everything above that line formed before the bar and everything below the line formed after bar formation. It would be interesting to see how much of the V-shape is on either side and whether the V-shape is continuous before and after the formation of the bar.
6.4. Stellar population gradients
Comparing gradients of stellar population properties, such as age and metallicity, along different axes is a great way to analyse and quantify the distribution of stellar populations. However, when comparing different results, it is very important to be precise about where and how these gradients were derived.
In our work, we measured gradients along four different axes: (1) MA – along the major axis of the bar between the inner break of the profile (to mask contamination from nuclear structures) and the bar radius, (2) MI – along the extension of the minor axis in the main disc between the inner break and the bar radius, (3) L – along a cut perpendicular to the major axis but offset from the minor axis between the major axis and leading edge of the bar, and (4) T – same as (3) but towards the trailing edge of the bar. This is illustrated in a very simplified way in Fig. 6.
We found that on average the mass-weighted age gradient along MA is slightly negative yet shallow and it is negative and steeper along MI. However, the gradients are positive along L and T. Together, they build a picture in which a bar that is younger along the major axis and older towards its edges is embedded in an even younger main disc. The same can be observed in the top-row panels in Fig. 14 in the simulated barred galaxy. We speculate that the bar-disc contrast is due to continuous star formation in the outer disc, while star formation has been mainly quenched within the bar. This picture is supported by the Hα maps that show ongoing star formation mainly in the outer disc and very little in the bar. The gradient within the bar region is explained by younger stars being trapped in progressively more elongated orbits as discussed in the previous sub-section. Furthermore, the [Mg/Fe]-enhancement that is discussed in Sect. 3.3 also fits well in this explanation. We found that [Mg/Fe] along bars is lower than in the main disc within the bar radius – a region that is often called the SFD. It is likely to be populated by old stars from the main disc and, partially, old stars on rounder bar orbits. In the disc outside the bar radius, however, and due to continuous star formation, we expect to find a lower [Mg/Fe]-enhancement than in the bar, as reported by Seidel et al. (2016).
With respect to a comparison between the major and minor axis or disc, we found mostly slightly shallower age and metallicity gradients along the major axis, which is in agreement with the results from Sánchez-Blázquez et al. (2011), Seidel et al. (2016) and Fraser-McKelvie et al. (2019). This result indicates enhanced radial flattening along the bar, which is likely due to radial movements of stars along very elongated orbits close to the bar major axis. It demonstrates the impact of bars in the radial distribution of stellar populations in galaxies. However, the differences that we observe are smaller than previously reported.
7. Conclusions
We have conducted a detailed analysis of spatially resolved stellar populations in galaxy bars within the TIMER project. We have combined mean ages and metallicities, SFHs, and [Mg/Fe] abundance ratios with Hα measurements as a star formation tracer. We have shown 2D maps as well as averages over pseudo-slits along and perpendicular to the bar major axis that helped us to separate stellar populations across the width of the bars. We have further compared our observational results with cosmological zoom-in simulations from the Auriga project. Our main results can be summarised as follows:
-
Diagrams of SFHs that are perpendicular to the bar major axes in the MUSE TIMER observations show noticeable V-shapes in the intermediate to old population (> 2 Gyr), which also manifest themselves in positive gradients in profiles of mass-weighted mean ages from the major axis outwards. The same shapes are found in the barred galaxies from the cosmological zoom-in simulations of the Auriga project. These are likely the result of younger and kinematically colder stars being trapped on more elongated orbits – at the onset of the bar instability – thus forming a thinner component of the bar seen face-on, and older and kinematically hotter stars forming a thicker and rounder component of the bar. The shapes can also be due to star formation after bar formation, where young stars form on elongated orbits in the bar region.
-
We show the imprints of typical star formation processes in barred galaxies on the young age distribution (< 2 Gyr) in the stellar populations. Light-weighted mean stellar ages decrease from the major axis towards the edges of the bar with a stronger decrease towards the leading side. This behaviour is especially observed for galaxies that show traces of Hα on the edges of the bar. A stronger effect on the leading side is in accordance with stronger star formation in that region. Furthermore, none of the galaxies in our sample show significant Hα in the bar except for the presence in central components, such as nuclear discs or nuclear rings, at the ends or at the edges of the bar. This result is explained by recent and ongoing star formation in the main disc and in small amounts at the edges of the bar, but not in the region of the bar close to the major axis, which is probably caused by shear.
-
In general, we find stellar populations in the bars to be more metal-rich than in the discs when light-weighted; however, there are notable exceptions, for instance, NGC 4371 and NGC 4984. Except for a prominent peak in the very centre, mass-weighted gradients of mean [Z/H] in the bar are mostly positive yet very shallow along the major axis and across the width of the bar. They are on average slightly negative along the extension of the minor axis in the disc. The gradients become more negative, but still shallow, for light-weighted means.
-
Mass-weighted age gradients are negative along both main axes of the bar, but they are shallower along the major axis, which is likely due to orbital mixing in the bar. In general, stellar populations in bars are older than in the discs.
-
Bars are less [Mg/Fe]-enhanced than the surrounding disc. The region of the disc that we probed is mostly within the radius of the bar, which is often called the “star formation desert”. We find that [Mg/Fe] is larger in bars than in the inner secularly-built structures but lower than in the SFD. This is an indication of a more prolonged or continuous formation of stars that shape the bar structure as compared to shorter formation episodes in the surrounding SFD.
While the work presented in this article concerns stellar population properties of nine of the barred galaxies in the TIMER project (those for which our observations cover more than 80% of the bar), further studies within the collaboration are being conducted to investigate the connection between bars and the growth of nuclear discs. These studies, which will explore in detail the inner parts of all barred galaxies of the TIMER sample, will be published in forthcoming papers.
Using 3.6 μm images from Spitzer, bar lengths were measured visually, while orientation and ellipticity were determined interactively by visually marking the object and fitting ellipses to the marked points. See Herrera-Endoqui et al. (2015) for more details.
Au18 experiences a significant merger around tlookback = 8.5 Gyr (see Fragkoudi et al. 2019; Grand et al. 2020), causing a burst of star formation, which can be clearly seen in its SFH as a horizontal line at ∼8.5 Gyr in Fig. 14. However, this feature is not relevant for this study here as each galaxy has its own merger history. Instead, here, we focus on the V-shaped SFH in the slits.
Acknowledgments
We thank Vincenzo Fiorenzo for carefully reading the manuscript and providing a constructive referee report that helped to improve the paper. Based on observations collected at the European Organisation for Astronomical Research in the Southern Hemisphere under ESO programmes 097.B-0640(A) and 060.A-9313(A). The Science, Technology and Facilities Council is acknowledged by JN for support through the Consolidated Grant Cosmology and Astrophysics at Portsmouth, ST/S000550/1. JMA acknowledges support from the Spanish Ministerio de Economia y Competitividad (MINECO) by the grant AYA2017-83204-P. J.F-B, AdLC and PSB acknowledge support through the RAVET project by the grant AYA2016-77237-C2-1-P and AYA2016-77237-C3-1-P from the Spanish Ministry of Science, Innovation and Universities (MCIU) and through the IAC project TRACES which is partially supported through the state budget and the regional budget of the Consejería de Economía, Industria, Comercio y Conocimiento of the Canary Islands Autonomous Community. FAG acknowledges financial support from CONICYT through the project FONDECYT Regular Nr. 1181264, and funding from the Max Planck Society through a Partner Group grant.
References
- Aguerri, J. A. L., Méndez-Abreu, J., & Corsini, E. M. 2009, A&A, 495, 491 [NASA ADS] [CrossRef] [EDP Sciences] [Google Scholar]
- Alonso, S., Coldwell, G., Duplancic, F., Mesa, V., & Lambas, D. G. 2018, A&A, 618, A149 [NASA ADS] [CrossRef] [EDP Sciences] [Google Scholar]
- Athanassoula, E. 1992, MNRAS, 259, 328 [NASA ADS] [CrossRef] [Google Scholar]
- Athanassoula, E. 2013, in Bars and Secular Evolution in Disk Galaxies: Theoretical Input, eds. J. Falcón-Barroso, & J. H. Knapen (Cambridge: Cambridge University Press), 305 [CrossRef] [Google Scholar]
- Athanassoula, E., & Misiriotis, A. 2002, MNRAS, 330, 35 [NASA ADS] [CrossRef] [Google Scholar]
- Athanassoula, E., Bienayme, O., Martinet, L., & Pfenniger, D. 1983, A&A, 127, 349 [NASA ADS] [Google Scholar]
- Athanassoula, E., Rodionov, S. A., Peschken, N., & Lambert, J. C. 2016, ApJ, 821, 90 [NASA ADS] [CrossRef] [Google Scholar]
- Athanassoula, E., Rodionov, S. A., & Prantzos, N. 2017, MNRAS, 467, L46 [NASA ADS] [CrossRef] [Google Scholar]
- Bacon, R., Copin, Y., Monnet, G., et al. 2001, MNRAS, 326, 23 [NASA ADS] [CrossRef] [Google Scholar]
- Bacon, R., Accardo, M., Adjali, L., et al. 2010, in Ground-based and Airborne Instrumentation for Astronomy III, Proc. SPIE, 7735, 773508 [CrossRef] [Google Scholar]
- Bacon, R., Conseil, S., Mary, D., et al. 2017, A&A, 608, A1 [NASA ADS] [CrossRef] [EDP Sciences] [Google Scholar]
- Baldwin, J. A., Phillips, M. M., & Terlevich, R. 1981, PASP, 93, 5 [NASA ADS] [CrossRef] [EDP Sciences] [Google Scholar]
- Bauer, J. S., & Widrow, L. M. 2019, MNRAS, 486, 523 [CrossRef] [Google Scholar]
- Berrier, J. C., & Sellwood, J. A. 2016, ApJ, 831, 65 [CrossRef] [Google Scholar]
- Binney, J., & Tremaine, S. 1987, Galactic Dynamics (Princeton: Princeton University Press) [Google Scholar]
- Bittner, A., Falcón-Barroso, J., Nedelchev, B., et al. 2019, A&A, 628, A117 [NASA ADS] [CrossRef] [EDP Sciences] [Google Scholar]
- Blázquez-Calero, G., Florido, E., Pérez, I., et al. 2020, MNRAS, 491, 1800 [NASA ADS] [Google Scholar]
- Bose, S., Dong, S., Kochanek, C. S., et al. 2018, ApJ, 862, 107 [NASA ADS] [CrossRef] [Google Scholar]
- Bundy, K., Bershady, M. A., Law, D. R., et al. 2015, ApJ, 798, 7 [NASA ADS] [CrossRef] [Google Scholar]
- Buta, R. 1986, ApJS, 61, 609 [NASA ADS] [CrossRef] [Google Scholar]
- Buta, R., & Combes, F. 1996, Fund. Cosmic Phys., 17, 95 [Google Scholar]
- Buta, R. J., Sheth, K., Athanassoula, E., et al. 2015, ApJS, 217, 32 [NASA ADS] [CrossRef] [Google Scholar]
- Calzetti, D., Armus, L., Bohlin, R. C., et al. 2000, ApJ, 533, 682 [NASA ADS] [CrossRef] [Google Scholar]
- Cappellari, M. 2017, MNRAS, 466, 798 [NASA ADS] [CrossRef] [Google Scholar]
- Cappellari, M., & Copin, Y. 2003, MNRAS, 342, 345 [NASA ADS] [CrossRef] [Google Scholar]
- Cappellari, M., & Emsellem, E. 2004, PASP, 116, 138 [NASA ADS] [CrossRef] [Google Scholar]
- Cheung, E., Trump, J. R., Athanassoula, E., et al. 2015, MNRAS, 447, 506 [NASA ADS] [CrossRef] [Google Scholar]
- Coelho, P., & Gadotti, D. A. 2011, ApJ, 743, L13 [NASA ADS] [CrossRef] [Google Scholar]
- Contopoulos, G., & Papayannopoulos, T. 1980, A&A, 92, 33 [NASA ADS] [Google Scholar]
- de Lorenzo-Cáceres, A., Vazdekis, A., Aguerri, J. A. L., Corsini, E. M., & Debattista, V. P. 2012, MNRAS, 420, 1092 [NASA ADS] [CrossRef] [Google Scholar]
- de Lorenzo-Cáceres, A., Falcón-Barroso, J., & Vazdekis, A. 2013, MNRAS, 431, 2397 [NASA ADS] [CrossRef] [Google Scholar]
- de Lorenzo-Cáceres, A., Sánchez-Blázquez, P., Méndez-Abreu, J., et al. 2019, MNRAS, 484, 5296 [CrossRef] [Google Scholar]
- Debattista, V. P., Mayer, L., Carollo, C. M., et al. 2006, ApJ, 645, 209 [NASA ADS] [CrossRef] [Google Scholar]
- Debattista, V. P., Ness, M., Gonzalez, O. A., et al. 2017, MNRAS, 469, 1587 [NASA ADS] [CrossRef] [Google Scholar]
- Di Matteo, P., Haywood, M., Combes, F., Semelin, B., & Snaith, O. N. 2013, A&A, 553, A102 [NASA ADS] [CrossRef] [EDP Sciences] [Google Scholar]
- Díaz-García, S., Salo, H., Laurikainen, E., & Herrera-Endoqui, M. 2016, A&A, 587, A160 [NASA ADS] [CrossRef] [EDP Sciences] [Google Scholar]
- Donohoe-Keyes, C. E., Martig, M., James, P. A., & Kraljic, K. 2019, MNRAS, 489, 4992 [CrossRef] [Google Scholar]
- Elmegreen, B. G., Elmegreen, D. M., Knapen, J. H., et al. 2007, ApJ, 670, L97 [NASA ADS] [CrossRef] [Google Scholar]
- Erwin, P. 2018, MNRAS, 474, 5372 [NASA ADS] [CrossRef] [Google Scholar]
- Eskridge, P. B., Frogel, J. A., Pogge, R. W., et al. 2000, AJ, 119, 536 [NASA ADS] [CrossRef] [Google Scholar]
- Falcón-Barroso, J., Bacon, R., Bureau, M., et al. 2006, MNRAS, 369, 529 [NASA ADS] [CrossRef] [Google Scholar]
- Fragkoudi, F., Athanassoula, E., & Bosma, A. 2016, MNRAS, 462, L41 [NASA ADS] [CrossRef] [Google Scholar]
- Fragkoudi, F., Di Matteo, P., Haywood, M., et al. 2017, A&A, 606, A47 [NASA ADS] [CrossRef] [EDP Sciences] [Google Scholar]
- Fragkoudi, F., Di Matteo, P., Haywood, M., et al. 2018, A&A, 616, A180 [NASA ADS] [CrossRef] [EDP Sciences] [Google Scholar]
- Fragkoudi, F., Grand, R. J. J., Pakmor, R., et al. 2019, MNRAS, submitted [arXiv:1911.06826] [Google Scholar]
- Fraser-McKelvie, A., Merrifield, M., Aragón-Salamanca, A., et al. 2019, MNRAS, 488, L6 [CrossRef] [Google Scholar]
- Friedli, D., Benz, W., & Kennicutt, R. 1994, ApJ, 430, L105 [NASA ADS] [CrossRef] [Google Scholar]
- Gadotti, D. A. 2011, MNRAS, 415, 3308 [NASA ADS] [CrossRef] [Google Scholar]
- Gadotti, D. A., Seidel, M. K., Sánchez-Blázquez, P., et al. 2015, A&A, 584, A90 [NASA ADS] [CrossRef] [EDP Sciences] [Google Scholar]
- Gadotti, D. A., Sánchez-Blázquez, P., Falcón-Barroso, J., et al. 2019, MNRAS, 482, 506 [Google Scholar]
- Galloway, M. A., Willett, K. W., Fortson, L. F., et al. 2015, MNRAS, 448, 3442 [NASA ADS] [CrossRef] [Google Scholar]
- George, K., Subramanian, S., & Paul, K. T. 2019, A&A, 628, A24 [CrossRef] [EDP Sciences] [Google Scholar]
- Goulding, A. D., Matthaey, E., Greene, J. E., et al. 2017, ApJ, 843, 135 [NASA ADS] [CrossRef] [Google Scholar]
- Grand, R. J. J., Kawata, D., & Cropper, M. 2012, MNRAS, 421, 1529 [CrossRef] [Google Scholar]
- Grand, R. J. J., Kawata, D., & Cropper, M. 2015, MNRAS, 447, 4018 [NASA ADS] [CrossRef] [Google Scholar]
- Grand, R. J. J., Gómez, F. A., Marinacci, F., et al. 2017, MNRAS, 467, 179 [NASA ADS] [Google Scholar]
- Grand, R. J. J., Kawata, D., Belokurov, V., et al. 2020, MNRAS, submitted [arXiv:2001.06009] [Google Scholar]
- Greggio, L., Renzini, A., & Daddi, E. 2008, MNRAS, 388, 829 [NASA ADS] [CrossRef] [Google Scholar]
- Hakobyan, A. A., Karapetyan, A. G., Barkhudaryan, L. V., et al. 2016, MNRAS, 456, 2848 [NASA ADS] [CrossRef] [Google Scholar]
- Halle, A., Di Matteo, P., Haywood, M., & Combes, F. 2015, A&A, 578, A58 [NASA ADS] [CrossRef] [EDP Sciences] [Google Scholar]
- Halle, A., Di Matteo, P., Haywood, M., & Combes, F. 2018, A&A, 616, A86 [NASA ADS] [CrossRef] [EDP Sciences] [Google Scholar]
- Haywood, M., Lehnert, M. D., Di Matteo, P., et al. 2016, A&A, 589, A66 [NASA ADS] [CrossRef] [EDP Sciences] [PubMed] [Google Scholar]
- Herrera-Endoqui, M., Díaz-García, S., Laurikainen, E., & Salo, H. 2015, A&A, 582, A86 [NASA ADS] [CrossRef] [EDP Sciences] [Google Scholar]
- Ho, L. C., Filippenko, A. V., & Sargent, W. L. W. 1997, ApJ, 487, 591 [NASA ADS] [CrossRef] [Google Scholar]
- James, P. A., & Percival, S. M. 2016, MNRAS, 457, 917 [NASA ADS] [CrossRef] [Google Scholar]
- James, P. A., & Percival, S. M. 2018, MNRAS, 474, 3101 [NASA ADS] [CrossRef] [Google Scholar]
- James, P. A., Bretherton, C. F., & Knapen, J. H. 2009, A&A, 501, 207 [NASA ADS] [CrossRef] [EDP Sciences] [Google Scholar]
- Khoperskov, S., Haywood, M., Di Matteo, P., Lehnert, M. D., & Combes, F. 2018, A&A, 609, A60 [NASA ADS] [CrossRef] [EDP Sciences] [Google Scholar]
- Kim, W.-T., Seo, W.-Y., Stone, J. M., Yoon, D., & Teuben, P. J. 2012, ApJ, 747, 60 [NASA ADS] [CrossRef] [Google Scholar]
- Kroupa, P. 2001, MNRAS, 322, 231 [NASA ADS] [CrossRef] [Google Scholar]
- Leaman, R., Fragkoudi, F., Querejeta, M., et al. 2019, MNRAS, 488, 3904 [CrossRef] [Google Scholar]
- Li, Z., Shen, J., & Kim, W.-T. 2015, ApJ, 806, 150 [NASA ADS] [CrossRef] [Google Scholar]
- Maiolino, R., & Mannucci, F. 2019, A&ARv, 27, 3 [NASA ADS] [CrossRef] [Google Scholar]
- Masters, K. L., Nichol, R. C., Hoyle, B., et al. 2011, MNRAS, 411, 2026 [NASA ADS] [CrossRef] [Google Scholar]
- Masters, K. L., Nichol, R. C., Haynes, M. P., et al. 2012, MNRAS, 424, 2180 [NASA ADS] [CrossRef] [Google Scholar]
- Matteucci, F. 1994, A&A, 288, 57 [NASA ADS] [Google Scholar]
- McDermid, R. M., Alatalo, K., Blitz, L., et al. 2015, MNRAS, 448, 3484 [NASA ADS] [CrossRef] [Google Scholar]
- Méndez-Abreu, J., de Lorenzo-Cáceres, A., Gadotti, D. A., et al. 2019, MNRAS, 482, L118 [NASA ADS] [CrossRef] [Google Scholar]
- Menéndez-Delmestre, K., Sheth, K., Schinnerer, E., Jarrett, T. H., & Scoville, N. Z. 2007, ApJ, 657, 790 [NASA ADS] [CrossRef] [Google Scholar]
- Minchev, I., & Famaey, B. 2010, ApJ, 722, 112 [NASA ADS] [CrossRef] [Google Scholar]
- Neumann, J., Gadotti, D. A., Wisotzki, L., et al. 2019, A&A, 627, A26 [CrossRef] [EDP Sciences] [Google Scholar]
- Ocvirk, P., Pichon, C., Lançon, A., & Thiébaut, E. 2006a, MNRAS, 365, 46 [NASA ADS] [CrossRef] [Google Scholar]
- Ocvirk, P., Pichon, C., Lançon, A., & Thiébaut, E. 2006b, MNRAS, 365, 74 [NASA ADS] [CrossRef] [Google Scholar]
- Oh, S., Oh, K., & Yi, S. K. 2012, ApJS, 198, 4 [Google Scholar]
- Pérez, I., & Sánchez-Blázquez, P. 2011, A&A, 529, A64 [NASA ADS] [CrossRef] [EDP Sciences] [Google Scholar]
- Pérez, I., Sánchez-Blázquez, P., & Zurita, A. 2007, A&A, 465, L9 [NASA ADS] [CrossRef] [EDP Sciences] [Google Scholar]
- Pérez, I., Sánchez-Blázquez, P., & Zurita, A. 2009, A&A, 495, 775 [NASA ADS] [CrossRef] [EDP Sciences] [Google Scholar]
- Pfenniger, D. 1984, A&A, 134, 373 [NASA ADS] [Google Scholar]
- Pietrinferni, A., Cassisi, S., Salaris, M., & Castelli, F. 2004, ApJ, 612, 168 [NASA ADS] [CrossRef] [Google Scholar]
- Pietrinferni, A., Cassisi, S., Salaris, M., & Castelli, F. 2006, ApJ, 642, 797 [NASA ADS] [CrossRef] [Google Scholar]
- Pietrinferni, A., Cassisi, S., Salaris, M., Percival, S., & Ferguson, J. W. 2009, ApJ, 697, 275 [NASA ADS] [CrossRef] [Google Scholar]
- Pietrinferni, A., Cassisi, S., Salaris, M., & Hidalgo, S. 2013, A&A, 558, A46 [NASA ADS] [CrossRef] [EDP Sciences] [Google Scholar]
- Piner, B. G., Stone, J. M., & Teuben, P. J. 1995, ApJ, 449, 508 [NASA ADS] [CrossRef] [Google Scholar]
- Pinna, F., Falcón-Barroso, J., Martig, M., et al. 2019, A&A, 623, A19 [NASA ADS] [CrossRef] [EDP Sciences] [Google Scholar]
- Press, W. H., Teukolsky, S. A., Vetterling, W. T., & Flannery, B. P. 1992, Numerical Recipes in FORTRAN. The Art of Scientific Computing (Cambridge: Cambridge University Press) [Google Scholar]
- Rautiainen, P., & Salo, H. 2000, A&A, 362, 465 [NASA ADS] [Google Scholar]
- Renaud, F., Bournaud, F., Emsellem, E., et al. 2015, MNRAS, 454, 3299 [NASA ADS] [CrossRef] [Google Scholar]
- Sánchez-Blázquez, P., Ocvirk, P., Gibson, B. K., Pérez, I., & Peletier, R. F. 2011, MNRAS, 415, 709 [NASA ADS] [CrossRef] [Google Scholar]
- Sánchez-Blázquez, P., Rosales-Ortega, F. F., Méndez-Abreu, J., et al. 2014, A&A, 570, A6 [NASA ADS] [CrossRef] [EDP Sciences] [Google Scholar]
- Sarzi, M., Falcón-Barroso, J., Davies, R. L., et al. 2006, MNRAS, 366, 1151 [NASA ADS] [CrossRef] [Google Scholar]
- Seidel, M. K., Falcón-Barroso, J., Martínez-Valpuesta, I., et al. 2016, MNRAS, 460, 3784 [NASA ADS] [CrossRef] [Google Scholar]
- Sellwood, J. A. 2014, Rev. Mod. Phys., 86, 1 [NASA ADS] [CrossRef] [Google Scholar]
- Sellwood, J. A., & Binney, J. J. 2002, MNRAS, 336, 785 [NASA ADS] [CrossRef] [Google Scholar]
- Sheth, K., Vogel, S. N., Regan, M. W., et al. 2002, AJ, 124, 2581 [NASA ADS] [CrossRef] [Google Scholar]
- Sheth, K., Elmegreen, D. M., Elmegreen, B. G., et al. 2008, ApJ, 675, 1141 [NASA ADS] [CrossRef] [Google Scholar]
- Sheth, K., Regan, M., Hinz, J. L., et al. 2010, PASP, 122, 1397 [NASA ADS] [CrossRef] [Google Scholar]
- Skokos, C., Patsis, P. A., & Athanassoula, E. 2002a, MNRAS, 333, 847 [NASA ADS] [CrossRef] [Google Scholar]
- Skokos, C., Patsis, P. A., & Athanassoula, E. 2002b, MNRAS, 333, 861 [NASA ADS] [CrossRef] [Google Scholar]
- Sormani, M. C., Binney, J., & Magorrian, J. 2015, MNRAS, 449, 2421 [NASA ADS] [CrossRef] [Google Scholar]
- Thomas, D., Greggio, L., & Bender, R. 1999, MNRAS, 302, 537 [NASA ADS] [CrossRef] [Google Scholar]
- Valdes, F., Gupta, R., Rose, J. A., Singh, H. P., & Bell, D. J. 2004, ApJS, 152, 251 [NASA ADS] [CrossRef] [Google Scholar]
- Vazdekis, A., Sánchez-Blázquez, P., Falcón-Barroso, J., et al. 2010, MNRAS, 404, 1639 [NASA ADS] [Google Scholar]
- Vazdekis, A., Coelho, P., Cassisi, S., et al. 2015, MNRAS, 449, 1177 [NASA ADS] [CrossRef] [Google Scholar]
- Walcher, C. J., Coelho, P. R. T., Gallazzi, A., et al. 2015, A&A, 582, A46 [NASA ADS] [CrossRef] [EDP Sciences] [Google Scholar]
- Weilbacher, P. M., Streicher, O., Urrutia, T., et al. 2012, in Software and Cyberinfrastructure for Astronomy II, Proc. SPIE, 8451, 84510B [CrossRef] [Google Scholar]
- Wozniak, H. 2007, A&A, 465, L1 [NASA ADS] [CrossRef] [EDP Sciences] [Google Scholar]
Appendix A: Alternative comparison of stellar ages, metallicities, and [Mg/Fe] abundances
In Sect. 3, we present 2D spatially resolved maps of stellar population properties in the form of Voronoi-binned maps and we analyse trends along 1D pseudo-slits in Sect. 4.2. These results can also been shown in a different format, which we want to employ in this appendix in Figs. A.1 and A.2. An example for NGC 4643 is presented in Fig. 12 and general trends in the sample are discussed in Sect. 4.3.
Appendix B: Details on mean ages and metallicities along the bar major and minor axis
As discussed in Sect. 4.1, we derived mean age and metallicity profiles along the bar major and minor axis for all galaxies in the sample. Here, we show one example in Fig. B.2 and discuss a few more details of the procedure.
The 2D Voronoi-binned maps of mean ages and metallicities derived with STECKMAP are starting points. On these maps, we determined the position of the major and minor axis of the bar, shown in Fig. B.1. It is important to note that these axes are not exactly perpendicular to each other on the maps since we required them to be at 90° on the deprojected galaxy plane. The deprojection scales were derived from the relative PAs of the axes to the PA of the disc and from the inclination. The average profile was then calculated within pseudo-slits of 2″ width in bins of 2″ distance along the slit.
 |
Fig. B.1. Sketch to visualise the procedure for extracting age and metallicity profiles along the deprojected bar major and minor axis. Here, a map of light-weighted Voronoi-binned mean ages from NGC 4303 is shown. Pseudo-slits that were used to extract the profile of the major axis (black stripe) and minor axis (grey stripe) are overplotted. |
An example of these profiles is shown in Fig. B.2 for NGC 4303. The distance r along each profile to the centre is the deprojected distance in the galaxy plane and it was divided by the deprojected length of the bar. Two clear breaks are noticeable in all four profiles of this galaxy. The inner break coincides with the position of a nuclear lens component (Herrera-Endoqui et al. 2015). Afterwards, a transition zone leading to a second break follows. These breaks are observed in all of our galaxies. In order to measure the slope of each profile (the results of which are shown in Fig. 7), we decided to use the range of the profile between the second break and the length of the bar. We note that the profiles along the minor axis do not stop at the edge of the bar but continue into the disc.
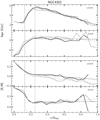 |
Fig. B.2. Mass- and light-weighted mean age and metallicity profiles along the bar major (black) and minor (grey) axis, extended into the disc and normalised by the bar length. This is an example for galaxy NGC 4303. The vertical dashed line shows the position of the nuclear lens component (Herrera-Endoqui et al. 2015) and coincides with the first break in the profile. The vertical dotted line marks the position of the second break. |
Appendix C: Details on mean ages and metallicities perpendicular to the bar major axis
In Fig. C.1 we present our detailed analysis of ages and metallicities along four cuts perpendicular to the bar major axis for the complete sample. The main results from the gradients of these profiles are discussed in Sect. 4.2.
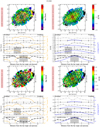 |
Fig. C.1. Light- and mass-weighted mean ages and metallicities. The figure is split into four quarters. On the left we show ages and on the right we show [Z/H]. Top and bottom: light-weighted and mass-weighted values, respectively. In each quarter, we show a 2D map of Voronoi-binned mean values overplotted with an outline of the bar (black ellipse), the bar major axis (solid line), the minor axis (dashed line), and outlines of the cuts from which we derived the profiles shown below (empty rectangles). Below each map, in four panels, we plotted the averaged profiles extracted from the corresponding cuts shown in the map. The shades of grey of the profiles correspond to the grey of the rectangles in the map. Hα (orange line), total surface brightness (blue line), and the approximate position of dust lines (grey area) are also shown. Vertical grey dotted lines mark the edge of the bar assuming, for simplicity, a rectangular shape. Further details can be found in the text. |
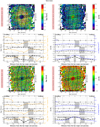 |
Fig. C.1. continued. |
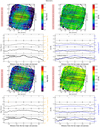 |
Fig. C.1. continued. |
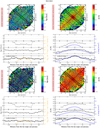 |
Fig. C.1. continued. |
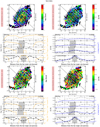 |
Fig. C.1. continued. |
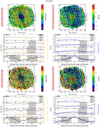 |
Fig. C.1. continued. |
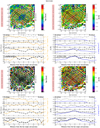 |
Fig. C.1. continued. |
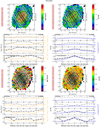 |
Fig. C.1. continued. |
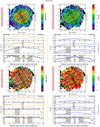 |
Fig. C.1. continued. |
We start with the 2D maps of light- and mass-weighted mean ages and metallicities as derived from STECKMAP in the same way as we did for the extraction of major and minor axis profiles described in the previous appendix. On these maps we define the bar major and minor axis in projection as previously outlined. In addition to a central cut along the bar minor axis, we define three pairs of cuts equally spaced to both sides of the minor axis, such that the last cuts are at the end of the bar. The cuts have a width of 4″ and there are equally spaced bins along the cut every 2″. Stripes of the same colour in the figures were averaged in anti-parallel direction. The motivation and a sketch are presented in Sect. 4.2.
Additionally, along the cuts, we plotted Hα densities and the total surface brightness. The former was measured along the same cuts from the Hα maps in Fig. 2. The latter was extracted from the total flux within each Voronoi bin during the measurement of the stellar kinematics with PPXF (see Sect. 2.3). For convenience and in order not to overload the figure, we only show Hα in the panels on the left side and only the total surface brightness on the right side, but both can equally be considered for the opposite side as well.
Dust lanes are signatures of cold gas inflows; they are clearly present for most of the galaxies in this sample and can be seen as dark features in the colour maps in Fig. 2 of Paper I. In our figures, we mark them for reference purposes as grey shaded areas at the approximate position along the profiles.
In Fig. C.1, we present detailed results from this analysis separately for every galaxy in the sample. We do not show individual error bars on the age and metallicity profiles since an estimation of the uncertainties of the fits with STECKMAP was not performed for all bins within all galaxies. As mentioned in the main text, general uncertainties were studied for a set of 5000 spectra from the TIMER data in Appendix A of Paper I. Typical values are 0.5 − 1 Gyr for age, and 0.005 − 0.010 for metallicity.
Appendix D: Details on star formation histories
Star formation histories were derived along the same four cuts perpendicular to the bar major axis for the complete sample. An example is shown for NGC 4981 in Fig. 13, where we also highlighted the apparent V-shape. In Fig. D.1, we show the SFH for all galaxies in the sample. Each row shows one object. The V-shape appears in the SFH plots when the edges of the bar are clearly dominated by very old stellar populations, while close to the major axis (x = 0 in these plots), there is a significant fraction of intermediate-age populations. This shape, sometimes more V-like and sometimes more U-like, can be seen in the galaxies IC 1438, NGC 4643, NGC 4981, NGC 6902, and NGC 7755.
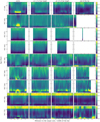 |
Fig. D.1. SFHs of the complete sample. Details of the figure are the same as in Fig. 13. The four panels are shown here from left to right in one row for each galaxy. In some cases, the colour bar is stretched in order to show fainter details that allow one to recognise the V-shape discussed in the main text. |
Appendix E: Mass-weighted maps of mean ages and metallicities
In this appendix, we present maps of mean stellar ages and metallicities for all galaxies of the sample as in Figs. 3 and 4, but here we show the mass-weighted means.
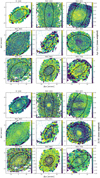 |
Fig. E.1. Same as Figs. 3 and 4, but for mass-weighted mean age (top nine panels) and metallicity (bottom nine panels). |
All Tables
All Figures
 |
Fig. 1. S4G images at 3.6 μm for the complete sample. The black squares show the approximate MUSE FOV. |
| In the text | |
 |
Fig. 2. Dust-corrected Hα maps for the complete sample. Only fluxes with a S/NHα > 5 and S/NHβ > 5 are shown. Black ellipses outline the approximate extent of the galaxy bar. NGC 4371 does not have any Hα above the S/N cut. |
| In the text | |
 |
Fig. 3. Light-weighted maps of mean stellar ages. Contours of the surface brightness distribution from the MUSE whitelight images are shown in white. Black ellipses outline the approximate extent of the bars. |
| In the text | |
 |
Fig. 4. Light-weighted maps of mean stellar metallicities. Contours of the surface brightness distribution from the MUSE whitelight images are shown in white. Black ellipses outline the approximate extent of the bars. |
| In the text | |
 |
Fig. 5. Spatially resolved Voronoi-binned maps of light-weighted [Mg/Fe]. Contours of the surface brightness distribution from the MUSE whitelight images are shown in white. The positions of the bars are shown in black and approximated by ellipses. |
| In the text | |
 |
Fig. 6. Sketch of a rotating elongated bar in a face-on disc to illustrate the axes along which the stellar population gradients were measured. The solid-line elongated ellipse outlines the bar that rotates counter-clockwise as indicated by the arrow. The dashed lines mark the bar major and minor axes and the dot-dot-dashed circle gives the bar radius. The gradients discussed in Sect. 4.1 were measured along the blue arrows and the gradients in Sect. 4.2 along the green arrows. MA – along the major axis; MI – along the extension of the minor axis; L – from the major axis towards the leading edge of the bar; T – from the major axis towards the trailing edge of the bar. |
| In the text | |
 |
Fig. 7. Gradients of deprojected age and metallicity profiles for light- and mass-weighted mean values along the bar major and minor axes. An example of such profiles is shown in Fig. B.2. Gradients were measured between the second inner break and the bar length as seen in the aforementioned figure and as discussed in the text. The minor axes are extended into the disc within the bar radius. Points are grouped into three bins of bar strength Qb. NGC 5248 is an outlier and shown separately. Error bars show standard errors from the linear regressions to the profiles. |
| In the text | |
 |
Fig. 8. Important closed periodic orbits in an analytic rotating bar potential. The bar major axis is horizontal. Orbits elongated parallel to the major axis are members of the x1 family. Orbits elongated perpendicular to the major axis form the x2 and x3 families. Superimposed on the orbits, we show a sketch of the equidistant anti-parallel vectors along which the stellar populations are binned and averaged. The cuts are numbered from 0 to 3, where #0 is crossing the centre of the galaxy and #3 is at the end of the bar. These numbers are found in the following figures and text. |
| In the text | |
 |
Fig. 9. Very simplified and shortened version of Fig. C.1 as an example for NGC 4981. Light- and mass-weighted age and metallicity profiles along cut #2 (see Fig. 8) perpendicular to the bar major axis are shown. The width of the cuts is 4″ and bins are equally spaced every 2″ along the cuts. The two cuts #2 are averaged in the anti-parallel direction as shown in Fig. 8. Vertical lines mark the edges of the bar. Linear regression fits from the major axis to the edges of the bar are shown in green. The slopes of these fits are tabulated in Table 3 and plotted in Figs. 10 and 11. |
| In the text | |
 |
Fig. 10. Gradients of light- and mass-weighted mean stellar age profiles along the cut #2 (see Fig. 8) perpendicular to the bar major axes (at 2/3 of the bar length) as shown in Fig. 9, as well as in Fig. C.1 and described in the text. The gradients from the major axes towards the leading (x-axis) and trailing (y-axis) edges of the bars are shown. The sense of rotation was determined assuming that spiral arms are trailing. Empty markers show galaxies for which the rotation is not clear. NGC 5248 is an outlier and shown separately. Error bars show standard errors from the linear regressions to the profiles. |
| In the text | |
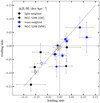 |
Fig. 11. Same as Fig. 10, but for gradients of mean stellar metallicities. |
| In the text | |
 |
Fig. 12. Comparison between light-weighted [Mg/Fe], metallicity, and age of the stellar populations in the bar of NGC 4643. Each point corresponds to one Voronoi bin as shown in Fig. 5. Bins are coloured by their distance to the bar major axis and only bins within the bar are shown. Bins within the nuclear structure are marked with different symbols and in light blue. These plots are shown for all galaxies in Figs. A.1 and A.2. |
| In the text | |
 |
Fig. 13. SFHs of NGC 4981 along the cuts illustrated in the sketch in Fig. 8. and in the Fig. C.1. Each panel shows one of the four cuts. The x-axis shows the distance to the bar major axis along the cut and the y-axis shows the age of the population. The fraction of stellar mass that is at a certain position and was formed at a certain time is colour-coded. The mass was normalised within each spatial bin (vertically in this diagram). The mass fractions were further divided by the size of the bin on the y-axis to correct for non-equally spaced bins on the linear age axis. White vertical lines mark the edges of the bar. Red lines are plotted on top to indicate the V-shape discussed in the text. |
| In the text | |
 |
Fig. 14. Results from Auriga simulations. Top-left panel: face-on mass-weighted age map of halo 18 from the Auriga sample, over-plotted with three vertical lines that indicate the cuts used to extract the data shown in the other panels. The bar major axis is horizontal. Top-right panel: mean stellar age profiles along the cuts. Middle row: SFH diagrams for each of the cuts (the left panel corresponds to the dark slit and the rightmost panel corresponds to the light grey slit). The axis and the colour-coding are the same as in our observations shown in Fig. 13. The white solid lines mark the edges of the bar and the red dashed line indicates the V-shape that we discuss in the main text. Bottom row: face-on surface density projections of stars in the bar in three different age bins as indicated in the top right corner of each panel. We see that younger ages cluster along the bar major axis compared to older ages which have a rounder shape. |
| In the text | |
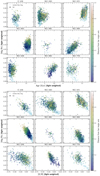 |
Fig. A.1. Same as Fig. 12, but for the complete sample. |
| In the text | |
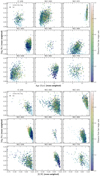 |
Fig. A.2. Same as Fig. A.1, but mass-weighted. |
| In the text | |
 |
Fig. B.1. Sketch to visualise the procedure for extracting age and metallicity profiles along the deprojected bar major and minor axis. Here, a map of light-weighted Voronoi-binned mean ages from NGC 4303 is shown. Pseudo-slits that were used to extract the profile of the major axis (black stripe) and minor axis (grey stripe) are overplotted. |
| In the text | |
 |
Fig. B.2. Mass- and light-weighted mean age and metallicity profiles along the bar major (black) and minor (grey) axis, extended into the disc and normalised by the bar length. This is an example for galaxy NGC 4303. The vertical dashed line shows the position of the nuclear lens component (Herrera-Endoqui et al. 2015) and coincides with the first break in the profile. The vertical dotted line marks the position of the second break. |
| In the text | |
 |
Fig. C.1. Light- and mass-weighted mean ages and metallicities. The figure is split into four quarters. On the left we show ages and on the right we show [Z/H]. Top and bottom: light-weighted and mass-weighted values, respectively. In each quarter, we show a 2D map of Voronoi-binned mean values overplotted with an outline of the bar (black ellipse), the bar major axis (solid line), the minor axis (dashed line), and outlines of the cuts from which we derived the profiles shown below (empty rectangles). Below each map, in four panels, we plotted the averaged profiles extracted from the corresponding cuts shown in the map. The shades of grey of the profiles correspond to the grey of the rectangles in the map. Hα (orange line), total surface brightness (blue line), and the approximate position of dust lines (grey area) are also shown. Vertical grey dotted lines mark the edge of the bar assuming, for simplicity, a rectangular shape. Further details can be found in the text. |
| In the text | |
 |
Fig. C.1. continued. |
| In the text | |
 |
Fig. C.1. continued. |
| In the text | |
 |
Fig. C.1. continued. |
| In the text | |
 |
Fig. C.1. continued. |
| In the text | |
 |
Fig. C.1. continued. |
| In the text | |
 |
Fig. C.1. continued. |
| In the text | |
 |
Fig. C.1. continued. |
| In the text | |
 |
Fig. C.1. continued. |
| In the text | |
 |
Fig. D.1. SFHs of the complete sample. Details of the figure are the same as in Fig. 13. The four panels are shown here from left to right in one row for each galaxy. In some cases, the colour bar is stretched in order to show fainter details that allow one to recognise the V-shape discussed in the main text. |
| In the text | |
 |
Fig. E.1. Same as Figs. 3 and 4, but for mass-weighted mean age (top nine panels) and metallicity (bottom nine panels). |
| In the text | |
Current usage metrics show cumulative count of Article Views (full-text article views including HTML views, PDF and ePub downloads, according to the available data) and Abstracts Views on Vision4Press platform.
Data correspond to usage on the plateform after 2015. The current usage metrics is available 48-96 hours after online publication and is updated daily on week days.
Initial download of the metrics may take a while.


