Fig. C.1.
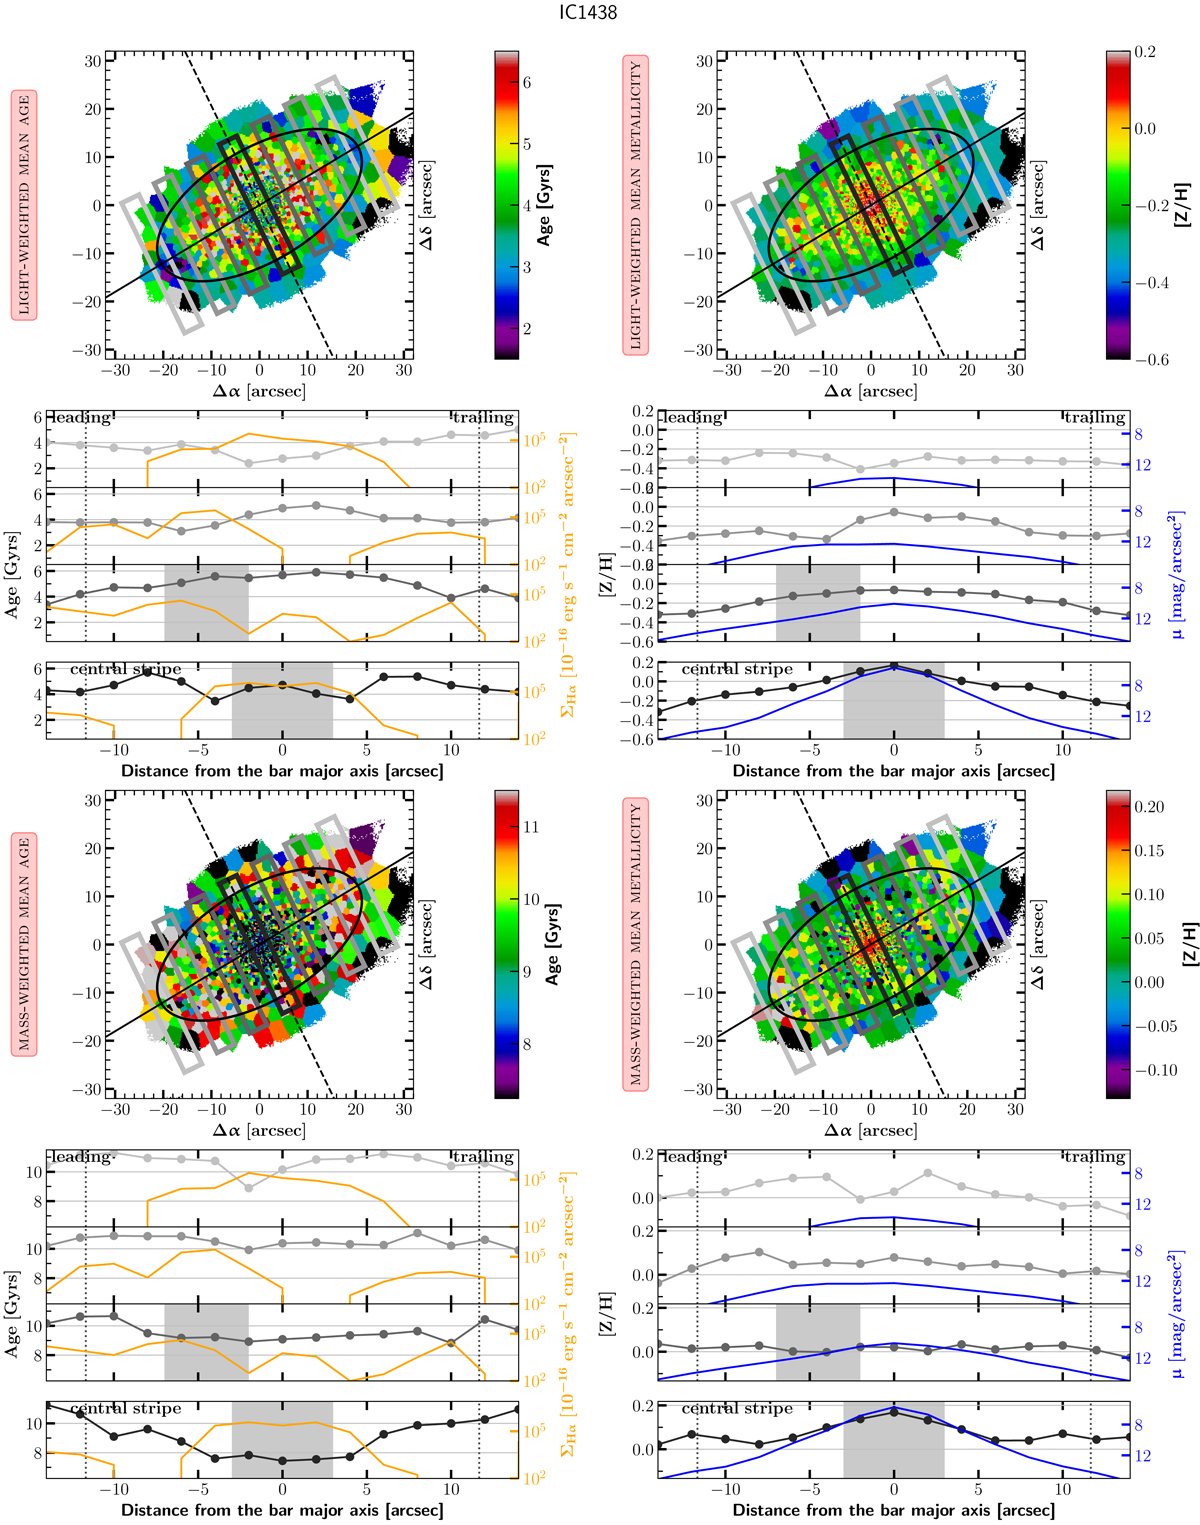
Light- and mass-weighted mean ages and metallicities. The figure is split into four quarters. On the left we show ages and on the right we show [Z/H]. Top and bottom: light-weighted and mass-weighted values, respectively. In each quarter, we show a 2D map of Voronoi-binned mean values overplotted with an outline of the bar (black ellipse), the bar major axis (solid line), the minor axis (dashed line), and outlines of the cuts from which we derived the profiles shown below (empty rectangles). Below each map, in four panels, we plotted the averaged profiles extracted from the corresponding cuts shown in the map. The shades of grey of the profiles correspond to the grey of the rectangles in the map. Hα (orange line), total surface brightness (blue line), and the approximate position of dust lines (grey area) are also shown. Vertical grey dotted lines mark the edge of the bar assuming, for simplicity, a rectangular shape. Further details can be found in the text.
Current usage metrics show cumulative count of Article Views (full-text article views including HTML views, PDF and ePub downloads, according to the available data) and Abstracts Views on Vision4Press platform.
Data correspond to usage on the plateform after 2015. The current usage metrics is available 48-96 hours after online publication and is updated daily on week days.
Initial download of the metrics may take a while.