Fig. 13.
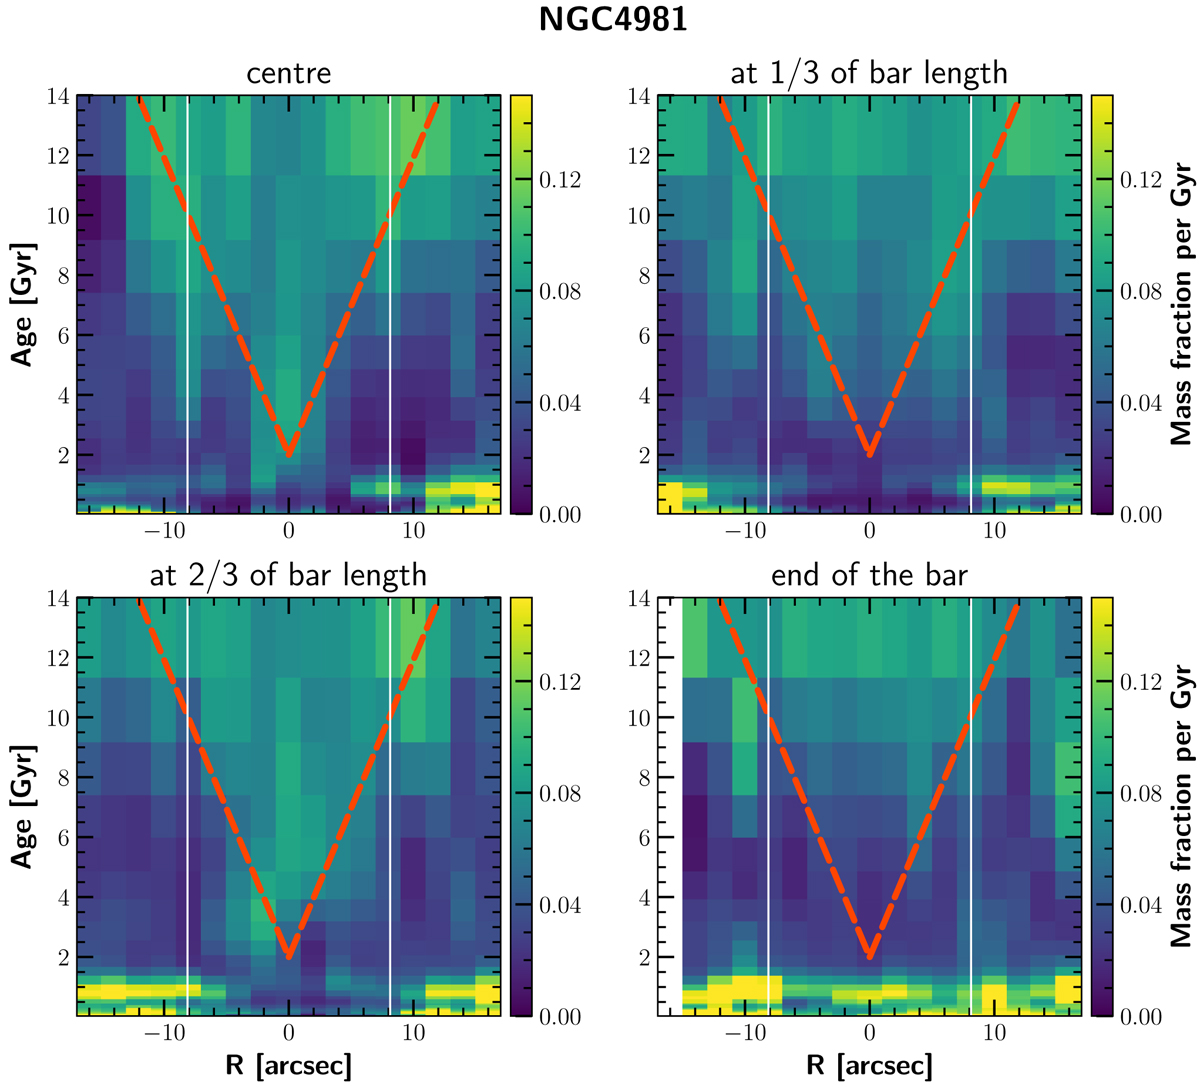
SFHs of NGC 4981 along the cuts illustrated in the sketch in Fig. 8. and in the Fig. C.1. Each panel shows one of the four cuts. The x-axis shows the distance to the bar major axis along the cut and the y-axis shows the age of the population. The fraction of stellar mass that is at a certain position and was formed at a certain time is colour-coded. The mass was normalised within each spatial bin (vertically in this diagram). The mass fractions were further divided by the size of the bin on the y-axis to correct for non-equally spaced bins on the linear age axis. White vertical lines mark the edges of the bar. Red lines are plotted on top to indicate the V-shape discussed in the text.
Current usage metrics show cumulative count of Article Views (full-text article views including HTML views, PDF and ePub downloads, according to the available data) and Abstracts Views on Vision4Press platform.
Data correspond to usage on the plateform after 2015. The current usage metrics is available 48-96 hours after online publication and is updated daily on week days.
Initial download of the metrics may take a while.