Fig. 6.
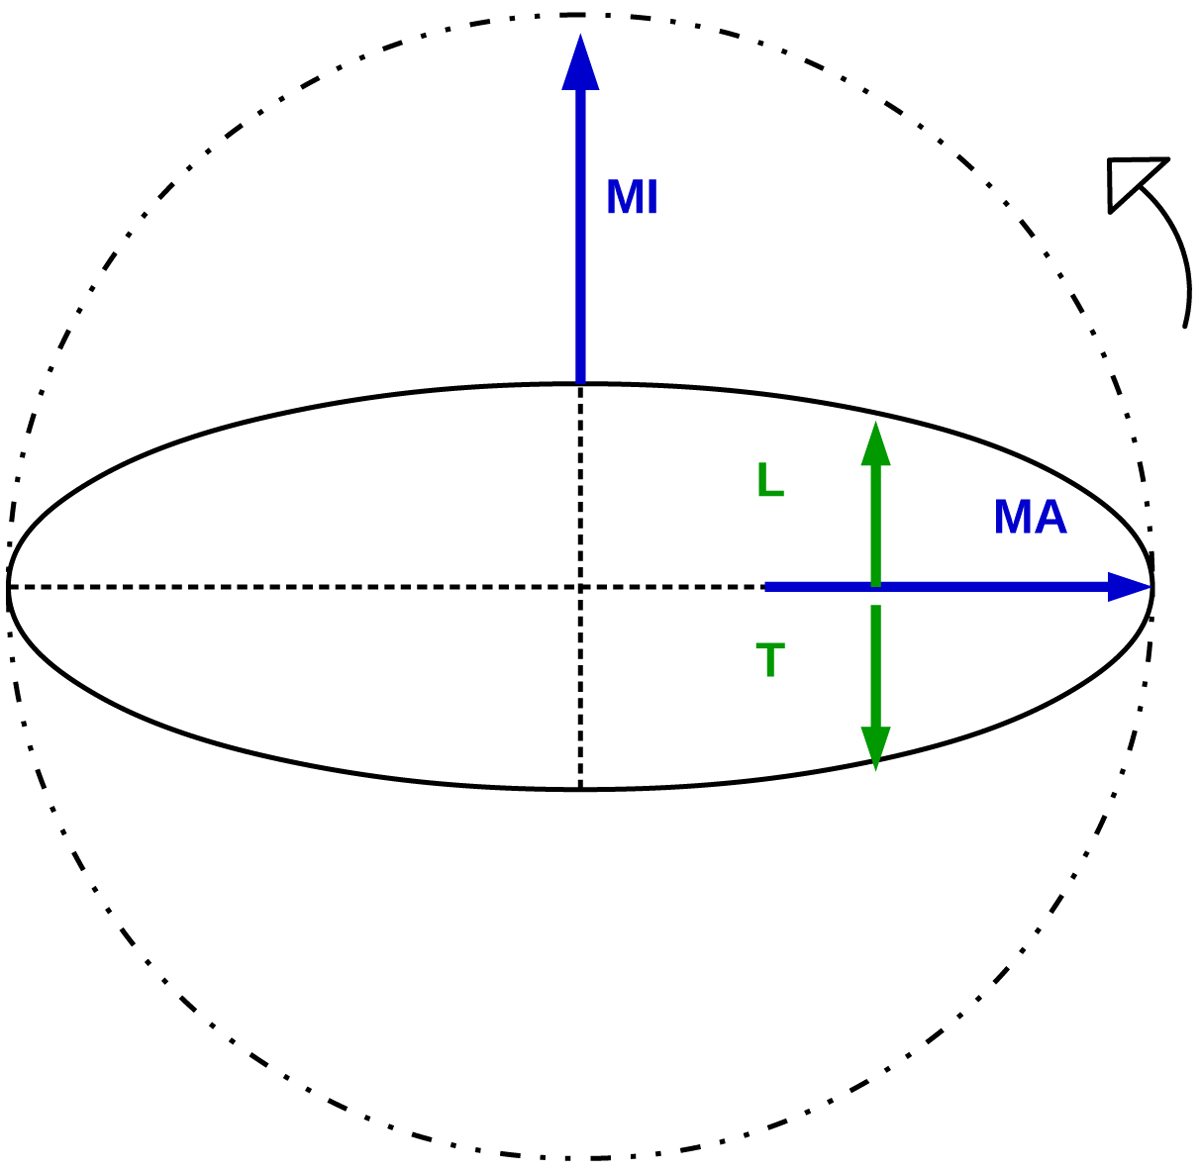
Sketch of a rotating elongated bar in a face-on disc to illustrate the axes along which the stellar population gradients were measured. The solid-line elongated ellipse outlines the bar that rotates counter-clockwise as indicated by the arrow. The dashed lines mark the bar major and minor axes and the dot-dot-dashed circle gives the bar radius. The gradients discussed in Sect. 4.1 were measured along the blue arrows and the gradients in Sect. 4.2 along the green arrows. MA – along the major axis; MI – along the extension of the minor axis; L – from the major axis towards the leading edge of the bar; T – from the major axis towards the trailing edge of the bar.
Current usage metrics show cumulative count of Article Views (full-text article views including HTML views, PDF and ePub downloads, according to the available data) and Abstracts Views on Vision4Press platform.
Data correspond to usage on the plateform after 2015. The current usage metrics is available 48-96 hours after online publication and is updated daily on week days.
Initial download of the metrics may take a while.