Fig. B.2.
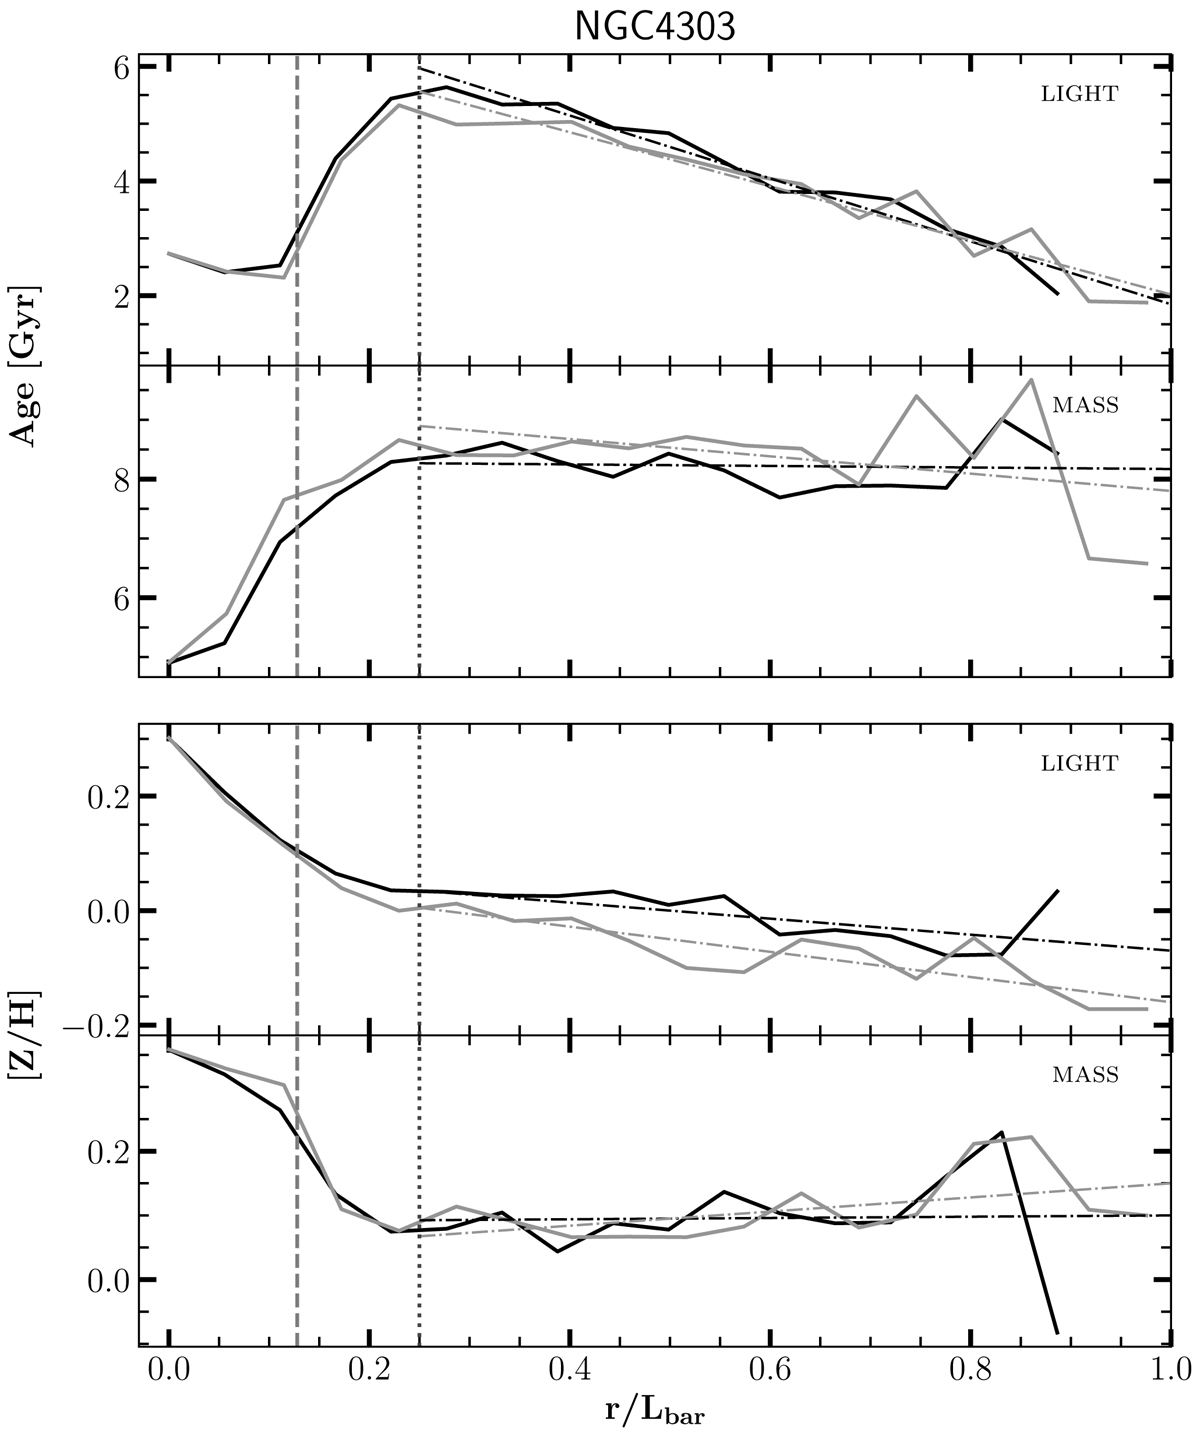
Mass- and light-weighted mean age and metallicity profiles along the bar major (black) and minor (grey) axis, extended into the disc and normalised by the bar length. This is an example for galaxy NGC 4303. The vertical dashed line shows the position of the nuclear lens component (Herrera-Endoqui et al. 2015) and coincides with the first break in the profile. The vertical dotted line marks the position of the second break.
Current usage metrics show cumulative count of Article Views (full-text article views including HTML views, PDF and ePub downloads, according to the available data) and Abstracts Views on Vision4Press platform.
Data correspond to usage on the plateform after 2015. The current usage metrics is available 48-96 hours after online publication and is updated daily on week days.
Initial download of the metrics may take a while.