Free Access
Fig. 3.
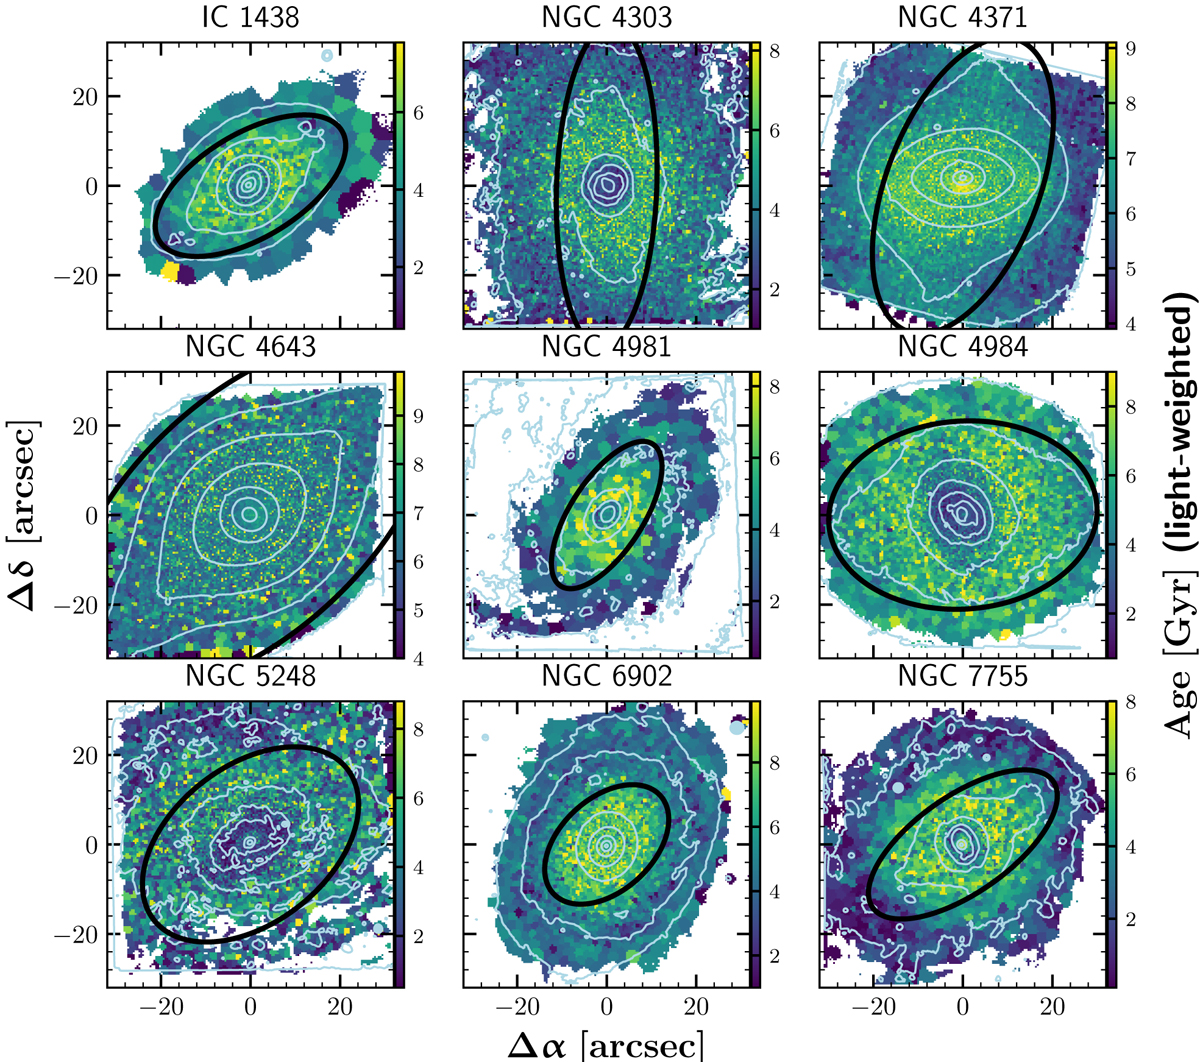
Light-weighted maps of mean stellar ages. Contours of the surface brightness distribution from the MUSE whitelight images are shown in white. Black ellipses outline the approximate extent of the bars.
Current usage metrics show cumulative count of Article Views (full-text article views including HTML views, PDF and ePub downloads, according to the available data) and Abstracts Views on Vision4Press platform.
Data correspond to usage on the plateform after 2015. The current usage metrics is available 48-96 hours after online publication and is updated daily on week days.
Initial download of the metrics may take a while.