Fig. 14.
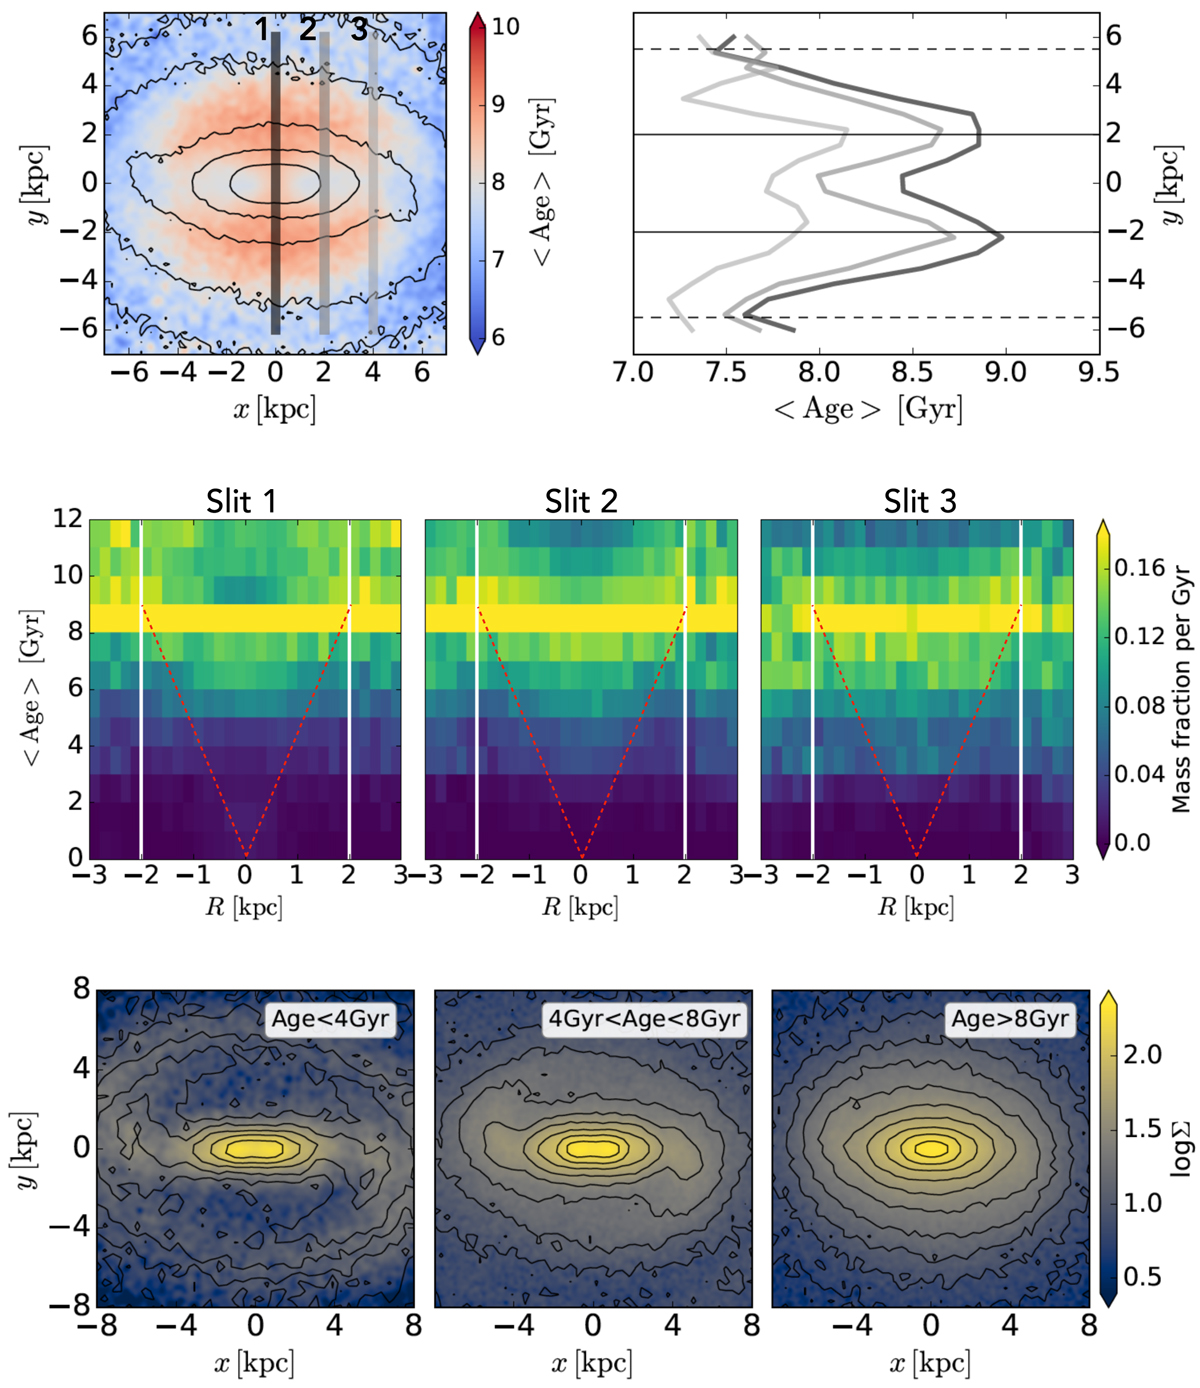
Results from Auriga simulations. Top-left panel: face-on mass-weighted age map of halo 18 from the Auriga sample, over-plotted with three vertical lines that indicate the cuts used to extract the data shown in the other panels. The bar major axis is horizontal. Top-right panel: mean stellar age profiles along the cuts. Middle row: SFH diagrams for each of the cuts (the left panel corresponds to the dark slit and the rightmost panel corresponds to the light grey slit). The axis and the colour-coding are the same as in our observations shown in Fig. 13. The white solid lines mark the edges of the bar and the red dashed line indicates the V-shape that we discuss in the main text. Bottom row: face-on surface density projections of stars in the bar in three different age bins as indicated in the top right corner of each panel. We see that younger ages cluster along the bar major axis compared to older ages which have a rounder shape.
Current usage metrics show cumulative count of Article Views (full-text article views including HTML views, PDF and ePub downloads, according to the available data) and Abstracts Views on Vision4Press platform.
Data correspond to usage on the plateform after 2015. The current usage metrics is available 48-96 hours after online publication and is updated daily on week days.
Initial download of the metrics may take a while.