| Issue |
A&A
Volume 637, May 2020
|
|
|---|---|---|
| Article Number | A57 | |
| Number of page(s) | 12 | |
| Section | Extragalactic astronomy | |
| DOI | https://doi.org/10.1051/0004-6361/201937380 | |
| Published online | 14 May 2020 | |
VLBI observations of the H2O gigamaser in TXS 2226-184
INAF – Osservatorio Astronomico di Cagliari, Via della Scienza 5, 09047 Selargius, CA, Italy
e-mail: This email address is being protected from spambots. You need JavaScript enabled to view it.
Received:
20
December
2019
Accepted:
20
March
2020
Abstract
Context. Outside the Milky Way the most luminous H2O masers at 22 GHz, called megamasers because of their extreme luminosity with respect to the Galactic and extragalactic H2O masers associated with star formation, are mainly detected in active galactic nuclei. In the case of the H2O maser detected in the nuclear region of the galaxy TXS 2226-184, the term gigamaser was used for the first time. However, the origin of this very luminous H2O maser emission has never been investigated in detail.
Aims. We study the nature of the 22 GHz H2O gigamaser in TXS 2226-184 by measuring its absolute position for the first time at milliarcsecond resolution, by comparing the morphology and characteristics of the maser emission on very long baseline interferometry (VLBI) scales after about 20 years, and by trying to detect its polarized emission.
Methods. We observed the 22 GHz H2O maser emission toward TXS 2226-184 three times: the very first time with the NRAO Very Long Baseline Array (VLBA, epoch 2017.45) and the next two times with the European VLBI Network (EVN, epochs 2017.83 and 2018.44). The first two epochs (2017.45 and 2017.83) were observed in phase-reference mode, while the last epoch (2018.44) was observed in full-polarization mode, but not in phase-reference mode to increase the on-source integration time. We also retrieved and analyzed the VLBA archival data at 22 GHz of TXS 2226-184 observed in epoch 1998.40.
Results. We detected six H2O maser features in epoch 2017.45 (VLBA), one in epoch 2017.83 (EVN), and two in epoch 2018.44 (EVN). All but one are red-shifted with respect to the systemic velocity of TXS 2226-184; we detected only one blue-shifted maser feature and it is the weakest one. All the H2O maser features but the blue-shifted one are composed of two components with very different linewidths. For the first time we were able to measure the absolute position of the H2O maser features with errors below 1 milliarcsec. No linear and circular polarization was detected.
Conclusions. We were able to associate the H2O maser features in TXS 2226-184 with the most luminous radio continuum clump reported in the literature. The comparison between epochs 1998.40 and 2017.45 reveals a difference in the morphology and velocity of the maser features that can be justified accounting for maser variability.
Key words: masers / galaxies: active / galaxies: nuclei / radio lines: galaxies / polarization
© ESO 2020
1. Introduction
Water masers at 22 GHz are commonly detected on Galactic and extragalactic scales. In the Milky Way they are mainly detected toward massive young stellar objects (YSOs) associated with molecular outflows. Outside our Galaxy most of them are detected in active galactic nuclei (AGN), the so-called megamasers (L > 10 L⊙), and in starburst galaxies, known as kilomasers (L < 10 L⊙)1.
Water masers associated with AGN have been related to three distinct phenomena: (i) the nuclear accretion disk (with the characteristic triple-peak pattern), where they can be used to trace the disk geometry and to measure the rotation velocity and the enclosed nuclear mass (for recent cases see Gao et al. 2017 and Zhao et al. 2018); (ii) radio jets, where they are the result of an interaction between the jet(s) and an encroaching molecular cloud (shocks) or due to an accidental overlap along the line of sight between a cloud and the radio continuum of the jet, providing important information about the evolution of jets and their hotspots (only a few sources of this kind have been studied in detail: NGC 1052: e.g., Claussen et al. 1998; NGC 1068: e.g., Gallimore et al. 2001; Mrk 348: Peck et al. 2003); (iii) nuclear outflows, tracing the velocity and geometry of nuclear winds at <1 pc from the nucleus (Greenhill et al. 2003, for the Circinus galaxy).
Furthermore, by modeling the polarized emission of H2O masers it is possible to provide precise measurements of the 3D geometry (linear polarization, Pl) and strength (circular polarization, PV) of the magnetic field (e.g., Nedoluha & Watson 1992). For example, very long baseline interferometry (VLBI) studies of the H2O maser polarization in the Galactic YSO W3(H2O) have revealed an extremely high percentage of Pl (∼40%; Goddi et al. 2017). However, only three extragalactic sources have been investigated to detect polarized emission of H2O masers: NGC 4258 (Modjaz et al. 2005), NGC 3079 (Vlemmings et al. 2007), and the Circinus galaxy (McCallum et al. 2007). No Pl and PV were detected in any of these sources (<1%).
To date, more than 3000 galaxies have been searched for H2O maser emission in the local Universe (z < 0.05), and detections have been obtained in about 180 of them (Braatz et al. 2018), the majority being radio-quiet AGN classified as Seyfert 2 (Sy 2) or low ionization nuclear emission-line regions (LINERs). Notably, (almost) no H2O masers have been found in elliptical and/or radio-loud galaxies even though a number of surveys have been performed on different classes of AGN (Tarchi et al. 2012; Henkel et al. 2018). Nevertheless, there are a few exceptions, for example the radio galaxy NGC 1052 at z = 0.005 (Braatz et al. 1994; Claussen et al. 1998; Sawada-Satoh et al. 2008), the FR II galaxy 3C403 at z = 0.06 (Tarchi et al. 2003, 2007), the type 2 QSO SDSS J0804+3607 at z = 0.66 (Barvainis & Antonucci 2005; Bennert et al. 2009), and the type 1 QSO MG J0414+0534 at z = 2.64 (Impellizzeri et al. 2008; Castangia et al. 2011).
Although the limited number of detections does not allow us to arrive at any conclusive assertion, we can point out that the detection of masers in E/radio-loud objects does not seem to be particularly AGN-type dependent. So far, H2O masers have been detected in type 1 and type 2 objects. In general, H2O masers in E/radio-loud objects are more likely associated with radio jets or outflows, although the disk-maser scenario cannot be ruled out a priori. Obviously, VLBI observations are necessary to confidently determine the origin of the emission. However, these measurements have been successfully performed only for the nearest source, NGC 1052 (at 20 Mpc distance), due to the intrinsic weakness or flaring-down of the maser lines in the other cases. In NGC 1052, high resolution observations indicate that the maser clouds are most likely located in front of the jet in a circumnuclear torus (or disk), thus amplifying the continuum seed emission from the jet knots (Sawada-Satoh et al. 2008). Recently, the detection and interferometric follow-up with the Very Long Baseline Array (VLBA) of a megamaser in the lenticular S0 galaxy IRAS 15480-0344 (130 Mpc distance) has been reported by Castangia et al. (2016). In this case an association of (part of) the H2O maser emission with a nuclear jet or outflow is also proposed (Castangia et al. 2019). At a similar distance to that of IRAS 15480-0344, an obvious and interesting case is represented by TXS 2226-184 (see next section for details).
2. Galaxy TXS 2226-184
TXS 2226-184, located at distance of 107.1 Mpc (derived assuming H0 = 70 km s−1 Mpc−1, Kuo et al. 2018) and with a systemic velocity of Vlsr, radio = 7270 km s−1 (Taylor et al. 2002), has been optically classified as an elliptical/S0 galaxy (Koekemoer et al. 1995), even though Falcke et al. (2000) proposed an alternative classification as a possible later-type galaxy. Furthermore, TXS 2226-184 is spectroscopically identified as a LINER (Bennert et al. 2004), which is a signature of an AGN or a nuclear starburst. Even though the radio core is relatively weak (or heavily obscured), the symmetric and tight structure of the nuclear radio emission is seemingly produced by a jet (position angle PA = −36°) that extends over ∼100 pc oriented at a large angle to the line of sight (Taylor et al. 2004).
TXS 2226-184 hosts one of the most luminous known extragalactic H2O maser sources, the so-called gigamaser, with an isotropic luminosity of 6100 L⊙ (Koekemoer et al. 1995). The maser line is broad (∼90 km s−1) and the bulk of the emission is red-shifted (Vlsr, radio = 7300−7500 km s−1) with respect to the velocity of the galaxy (Koekemoer et al. 1995). In addition, the observations of the H2O gigamaser over a period of years have revealed an uncommon stability of the emission (e.g., Braatz et al. 2003). Because of the extreme brightness of the H2O maser emission and of its broad width, Taylor et al. (2004) suggest, among other options, that the gigamaser might be associated with a jet that drives shocks into a molecular cloud; this is supported by the distribution of the H I absorption that they detected toward the center of the galaxy.
Ball et al. (2005) observed the gigamaser with the VLBA and identified seven clumps of H2O maser emission that are mainly distributed linearly northeast to southwest with PA = +25°. They also detected two blue-shifted maser clumps: one along the linear distribution (the most southwest clump) and the other, which is the bluest one (Vlsr, radio = 7100 km s−1), at about 7 mas (∼3.5 pc) southeast from the linear distribution. They also reported that in two of the maser clumps they detected a systemic position-velocity gradient. The observations were not conducted in phase-reference mode; therefore, Ball et al. (2005) were not able to provide absolute positions of the maser clumps. Furthermore, no information on the absolute positions is available in the literature to date. Ball et al. (2005) associate the linearly distributed maser clumps with a parsec-scale, edge-on rotating disk, whereas the isolated blue-shifted clump might be associated with a jet. In addition, no 22 GHz continuum emission was detected by Ball et al. (2005).
To further investigate the nature of the H2O gigamaser in TXS 2226-184 by providing the absolute position of the maser, and to compare the spatial distribution of the maser features (clumps) after about 20 years, we decided to observe TXS 2226-184 again with the VLBA (one epoch) and the European VLBI Network (EVN; two epochs) at 22 GHz. While the VLBA epoch and the first EVN epoch were observed in phase-reference mode in order to measure the absolute positions of the maser features, the second EVN epoch was performed in full polarization mode in order to attempt the detection of polarized maser emission. We report the VLBA and EVN observations and the corresponding analysis in Sect. 3, including the VLBA archival data of Ball et al. (2005). The results are instead described in Sect. 4 and discussed in Sect. 5.
3. Observations and analysis
In the following we describe the observations, the calibration, and the analysis of the four different VLBI epochs: the VLBA archival data (epoch 1998.40), the new VLBA epoch, and the two EVN epochs, the latest of which observed in full polarization mode. In addition, we also describe the archival data of the single-dish observations made with the Green Bank Telescope (GBT), to which we refer in our discussion.
3.1. Archival data: VLBA data epoch 1998.40
In order to recover more details than those reported in Ball et al. (2005) and for comparison with the results of our recent observations (see Sects. 3.3–3.5), we retrieved the VLBA dataset of the project BG0082 (presented in Ball et al. 2005) from the National Radio Astronomy Observatory (NRAO)2 data archive.
The 22 GHz H2O maser emission (rest frequency: 22.23508 GHz) was observed toward TXS 2226-184 (named IRAS 22265 in BG0082) with ten antennas of the VLBA for a total observing time of 8.65 h on May 27, 1998. The observing setup consisted of eight single-polarization subbands of 8 MHz, six of which were contiguous: subbands from 1 to 6 were set in left circular polarization (LCP) and subbands 7 and 8 in right circular polarization (RCP); in addition, subbands 2 and 4 were centered at the same frequencies of subbands 3 and 5, respectively. The total covered velocity (Vlsr, radio) range is of 650 km s−1, i.e., from 6942 km s−1 to 7592 km s−1. Each subband was correlated with 256 channels, implying a channel width of ∼30 kHz (0.45 km s−1). For more observational details, see Table 1.
Observational details.
The data were calibrated using the Astronomical Image Processing System (AIPS). Since the data are from the 1990s, some preliminary steps were necessary before proceeding with the current standard calibration. We had to pre-process the external VLBA calibration files bg082cal.vlba and vlba_gains.key by using the AIPS task VLOG. This task creates external files needed for generating the AIPS tables TY, FG, and GC that contain information on system temperatures (tsys), flags, and gains, respectively. We first performed the a priori calibration that consists of parallactic angle and amplitude corrections; then the bandpass, the delay, rate, and phase calibrations were performed on the fringe-finder calibrator 3C454.3 (peak flux density = 3.9 Jy beam−1; rms = 18.7 mJy beam−1) that was observed for 5 min every ∼25 min. Before shifting the frequency with the AIPS task CVEL to take the rotation of the correlation center into account, we applied all the calibration solutions to TXS 2226-184. Because the H2O maser was bright enough we decided to self-calibrate the peak flux channel and transfer the phase solutions to all channels and subbands. Before producing the final image cube we glued together, by using the AIPS task UJOIN, the subbands 1, 2+3, 4+5, 6, 7, and 8, where 2+3 indicates the average of the identical subbands 2 and 3, and 4+5 of the identical subbands 4 and 5. From the image cube produced using the AIPS task IMAGR, we identified the 22 GHz H2O maser features using the process described in Surcis et al. (2011) considering a maser detection threshold of 3σ. No phase-reference source was observed, hence no absolute position estimation was possible.
3.2. Archival data: GBT data epoch 2010.94
To compare the single-dish profile of the 22 GHz H2O maser with the profiles of the H2O maser features detected with the interferometers used in this work, we retrieved a dataset from the GBT archive. This was observed on December 9, 2010, under project name AGBT10C_013. Observations were performed in total power nod mode, using two of the seven beams of the K-band focal plane array (KFPA) receiver with dual circular polarization. The spectrometer was configured with two 200 MHz IFs, each with 8192 channels, yielding a channel spacing of 24 kHz, corresponding to ∼0.3 km s−1 at the frequency of 22 GHz. The first spectral window was centered at the frequency corresponding to the recessional velocity of the galaxy and the second was offset by 180 MHz to the red, for a total frequency coverage of 380 MHz (∼5100 km s−1 at 22 GHz). The data were reduced and analyzed using GBTIDL3. We calibrated the spectra utilizing standard routines and applying the default zenith opacity and gain curve. The uncertainty in this flux calibration procedure is estimated to be no more than 20%. In order to obtain the final spectrum, we averaged the two polarizations and then subtracted a polynomial baseline of one degree from the spectrum.
3.3. New observations: VLBA data epoch 2017.45
We observed the 616−523 H2O maser transition toward TXS 2226-184 with nine antennas of the VLBA on June 12, 2017. The observations were conducted in phase-reference (with cycles phase-calibrator – target of 45 s – 45 s) and spectral mode for a total observing time, including overheads, of 10 h. We did not include geodetic blocks in our observations, which are fundamental to correct the slowly varying term of the tropospheric delay and to improve the astrometric accuracy up to μas (for more details, see Reid & Honma 2014). However, our scientific purpose does not require an astrometric accuracy better than 0.1 mas. We used one dual-polarization baseband of 64 MHz centered at the systemic velocity of the galaxy (Vlsr, radio = 7270 km s−1) to cover a velocity range of about 870 km s−1. A single DiFX correlation pass was performed with 4096 channels that provided a velocity resolution of 0.24 km s−1 (channel width ∼16 kHz). For more observational details see Table 1.
The data were calibrated using AIPS. We first performed the a priori calibration that consists of ionospheric, earth rotation, parallactic angle, and amplitude corrections. The bandpass calibration was performed on the phase-reference source J2232-1659, while the delay and phase calibrations were performed on the fringe-finder 3C345. Then we self-calibrated the phase-reference source J2232-1659 (peak flux density = 145.9 mJy beam−1; rms = 1.6 mJy beam−1) and the final solutions were transferred to the TXS 2226-184 data before shifting the frequency with the AIPS task CVEL. We note that the uncertainties for the right ascension (α2000) and declination (δ2000) of the absolute position of J2232-1659 are 0.291 mas and 0.409 mas, respectively (see Goddard Space Flight Center VLBI group, February 23, 20154). We self-calibrated an average of 20 channels around the peak of the brightest maser feature (7404.4 km s−1) to improve the phase solutions, which does not affect the application of the solutions transferred from J2232-1659. A comparison of the brightest maser feature before and after applying the self-calibrated solutions shows no position difference. Before producing the final image cube with the AIPS task IMAGR (field 0.2 arcsec × 0.2 arcsec), we subtracted the continuum in the uv-plane using the AIPS task UVLSF by least-squares fitting the baseline in the free-line channels. We identified the 22 GHz H2O maser features using the process described in Surcis et al. (2011) (detection threshold > 3σ). We determined the absolute positions of the identified maser features by using the AIPS task JMFIT. The Gaussian fit error of JMFIT is on the order of 0.1–0.4 mas depending on the maser feature; in addition, the uncertainty due to the thermal noise calculated before applying the self-calibration (Reid & Honma 2014) was on the order of 0.01–0.05 mas. Since we did not correct the slow term of the tropospheric delay, we decided to consider conservative position errors equal to half the beam projected along α2000 and δ2000, which are ±0.2 mas and ±0.7 mas, respectively.
We made a continuum map to attempt the detection of any 22 GHz continuum emission of the nuclear region of TXS 2226-184 by averaging the channels that do not show any maser emission.
3.4. New observations: EVN data epoch 2017.83
The H2O maser transition at 22.23508 GHz was also observed with five of the EVN5 antennas on October 29, 2017. Similarly to the VLBA observations (see Sect. 3.3), we performed phase-referenced spectral observations with phase-calibrator – target cycles of 45 s – 45 s. Similarly to the VLBA observations of epoch 2017.45, we did not include geodetic blocks. Here, we used two subbands of 32 MHz each (435 km s−1) with an overlap between them of 10 MHz to avoid problems with the edges of the subbands. Therefore, we covered a total velocity range of ∼650 km s−1, which is enough to fully detect the broad maser emission (∼200 km s−1). The total observation time including the overheads was 7 h. The data were correlated with the EVN software correlator (SFXC, Keimpema et al. 2015) at the Joint Institute for VLBI ERIC (JIVE) using 2048 channels per subband (channel width ∼16 kHz ∼0.2 km s−1 at 22 GHz). Further observational details are reported in Table 1. During our observations an issue with the Digital Base Band Converter (DBBC) firmware affected the participating antennas, in case of 2 Gbps recording and/or 32 MHz subbands, leading to incorrect very low amplitudes (e.g., Burns et al. 2019).
The data were calibrated with AIPS. After applying the a priori calibration obtained from the JIVE pipeline, we performed the bandpass calibration and the fringe-fitting on the calibrators J2232-1659 and 3C454.3, respectively. We self-calibrated the phase-reference source J2232-1659 that showed a peak flux density of 33.5 mJy beam−1 and a continuum rms of 0.3 mJy beam−1, which are much lower than those measured with the VLBA. We note that the theoretical noise between the two observations are identical within 10%. However, the low amplitudes are expected, as mentioned above, because of the technical issue encountered during the EVN session 3/2017. Therefore, to correct the EVN amplitudes we assumed that the flux of J2232-1659 was constant between June and October 2017. This leads us to determine that all the amplitudes in the EVN dataset need to be multiplied by a factor of 4.35, similar to what was estimated by other EVN projects observed during the same session (R.A. Burns, priv. comm.). Therefore, for 3C454.3 we measured a corrected peak flux of 7.9 Jy beam−1.
With the AIPS task CVEL we shifted the frequency after applying the phase solutions from the phase-reference calibrator to TXS 2226-184. Before producing the image cube we glued the two subbands together by using the AIPS task UJOIN; the final dataset has a bandwidth of ∼52 MHz (∼650 km s−1) centered at the velocity 7327.0 km s−1. Similarly to the VLBA data reduction, before producing the image cubes we subtracted the continuum in the uv-plane using the AIPS task UVLSF. We unsuccessfully tried to self-calibrate the brightest maser channels. We searched for maser features by using the process described in Surcis et al. (2011) (detection threshold >3σ), and we determined the absolute position by fitting the brightest maser spot of each maser feature with the AIPS task JMFIT. Also in this case we considered conservative position errors equal to half the beam projected along α2000 and δ2000, which are ±0.5 mas and ±1.9 mas, respectively.
We averaged the channels without H2O maser emission to produce the continuum map of the nuclear region of TXS 2226-184.
3.5. New observations: EVN data epoch 2018.44
In an attempt to detect polarized emission from an extra-galactic H2O maser for the first time, we performed a second EVN epoch in full polarization mode. This epoch was observed with seven of the EVN antennas on June 9, 2018. To avoid the DBBC firmware issue that affected epoch 2017.83, we used four subbands of 16 MHz each (∼217 km s−1) with an overlap between them of 5 MHz. Therefore, we covered a total velocity range of ∼660 km s−1. Because the main objective of these observations was to detect polarized H2O maser emission, for which typical linear and circular polarization fractions in Galactic maser are of a few percent (e.g., Surcis et al. 2011), to maximize our on-source time we did not observe the phase-reference calibrator as done in epoch 2017.83. We increased the observation time of TXS 2226-184 up to about 4 h, i.e., one hour more than in epoch 2017.83, and we observed the polarization calibrator J2202+4216 every hour. By including the overheads, the total observation time was 6 h. The data in this case were also correlated with the SFXC at the JIVE, but this time generating all four polarization combinations (RR, LL, RL, LR) by using 4096 channels per subband (channel width ∼4 kHz ∼0.05 km s−1). The narrow channel width is necessary in order to properly measure the Zeeman-splitting from the circularly polarized spectra of the maser features in case circular polarization is detected. The observational details are reported in Table 1.
The data were calibrated using AIPS by following the procedure described in Surcis et al. (2011); after applying the a priori calibration obtained from the JIVE pipeline, we performed the bandpass, delay, phase, and polarization calibration on the polarization calibrator J2202+4216. After applying the solutions to TXS 2226-184, first we shifted the frequency using the AIPS task CVEL and we glued the four subbands together similarly as we did in epoch 2017.83, then we successfully self-calibrated 90 spectral channels (∼350 kHz ∼ 4.5 km s−1) around the peak of the brightest maser feature (7398.9 km s−1). Finally we imaged the I, Q, U, and V Stokes cubes (rms ≈ 5 mJy beam−1). The Q and U cubes were combined using the AIPS task COMB to produce cubes of linearly polarized intensity ( ) and polarization angle (
 ). The searching for maser features was performed using the process described in Surcis et al. (2011) (detection threshold > 3σ).
Also for this EVN epoch we averaged the channels without H2O maser emission to produce the continuum map of the nuclear region of TXS 2226-184.
4. Results
Here we report separately the results obtained from the four VLBI epochs in chronological order.
4.1. VLBA epoch 1998.40
We identified three (red-shifted with respect to the systemic velocity) out of the seven H2O maser features reported by Ball et al. (2005). We named them TXS.B01–TXS.B03, and they are shown in Fig. 1 (left panel) and their parameters are listed in Table 2. Blue-shifted maser features did not emerge at 3σ in our image cube, neither at the velocity reported by Ball et al. (2005), i.e., Vlsr, radio = 7100 km s−1 and Vlsr, radio = 7200 km s−1, nor at the positions indicated by Ball et al. (2005) (blue circles in Fig. 2). However, we note that the velocities reported by Ball et al. (2005) are at the edges of the subbands where the response of the backend is not linear and hence more sensitive to small differences in data reduction and/or analysis. The H2O maser features are linearly distributed from northeast (the least red-shifted and luminous feature) to southwest (the most red-shifted and luminous feature) with a position angle of PA = +26° ±16° (see Fig. 2). No position-velocity gradients are observed. From a multiple Gaussian fit (see Fig. 1) we determined that the most luminous maser features (TXS.B01 and TXS.B02) are composted of two broad Gaussian components (see Table 2) with respect to typical individual maser features associated with AGN disks or star formation sites. One component is much broader than the other, and both components have linewidths (ΔvL) greater than 20 km s−1, including TXS.B03. We note that the Gaussian component number 4 of feature TXS.B02 shows a ΔvL that is two times the second broadest one (component number 1 of TXS.B01; see Table 2). The least luminous H2O maser feature TXS.B03 (LH2O = 366 L⊙) is instead composed of only one relatively narrow Gaussian component (ΔvL ≈ 26 km s−1). No continuum emission has been detected above a 1σ noise level of 0.5 mJy beam−1 (in the map produced averaging the line-free channels).
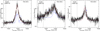 |
Fig. 1. Total intensity spectra (I) of the H2O maser features detected toward TXS 2226-184 with the VLBA in epoch 1998.40. The thick blue lines are the Gaussian fit of the different components that are labeled in blue (see Table 2), the dashed red line is the combination of the Gaussian components for each maser feature. The dashed black line indicates the systemic velocity of the galaxy in the radio convention (i.e., 7270 km s−1). |
Parameters of the 22 GHz H2O maser features detected toward TXS 2226-184 in epoch 1998.40.
4.2. VLBA epoch 2017.45
We detected six H2O maser features in epoch 2017.45, their profiles are plotted in Fig. 3 and their linear distribution (PA = +28° ±12°) is shown in Fig. 2 (right panel). The maser features are listed in Table 3 where we report the absolute position, the results of the multiple Gaussian fit, and the isotropic luminosity. The most red-shifted maser features are located at the center of the distribution (TXS.V01–TXS.V03), where the most luminous maser feature TXS.V02 is detected (LH2O = 537 L⊙). The other (less) red-shifted maser features (TXS.V05 and TXS.V04) are located to the northeast and the only blue-shifted maser feature (TXS.V06), which is the least luminous (LH2O = 79 L⊙), is located to the southwest. Also in this case no position-velocity gradients are observed. From the multiple Gaussian fit we find that all the red-shifted maser features are composed of two Gaussian components, one of which is very narrow (2.9 km s−1 ≤ ΔvL ≤ 13.2 km s−1), while the other is broad (34.7 km s−1 ≤ ΔvL ≤ 50 km s−1; see Table 3 and Fig. 3). TXS.V06 is the only one composed of one Gaussian component. No continuum emission has been detected at the 1σ level (rms = 0.4 mJy beam−1).
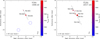 |
Fig. 2. View of the H2O maser features detected toward TXS 2226-184 with the VLBA in epoch 1998.40 (left panel) and in epoch 2017.45 (right panel). Triangles identify H2O maser features whose side length is scaled logarithmically according to their peak flux density (Tables 2 and 3). The 40 mJy beam−1 symbol is plotted for comparison in both panels. Maser local standard of rest radial velocities are indicated by color (the velocity of the galaxy is |
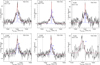 |
Fig. 3. Total intensity spectra (I) of the H2O maser features detected toward TXS 2226-184 with the VLBA in epoch 2017.45 after a boxcar smoothing of ten channels. The thick blue lines are the Gaussian fit of the different components that are labeled in blue (see Table 3), the dashed red line is the combination of the fit of the components of each maser feature. The dashed black line indicates the systemic velocity of the galaxy in the radio convention (i.e., 7270 km s−1). |
Parameters of the 22 GHz H2O maser features detected toward TXS 2226-184 in epochs 2017.45 (VLBA), 2017.83 and 2018.44 (EVN).
4.3. EVN epoch 2017.83
One H2O maser feature (named TXS.E01) was detected with the EVN in epoch 2017.83. It is listed in Table 3 and its spectrum is shown in Fig. 4 (left panel). TXS.E01 is red-shifted with respect to the systemic velocity of the galaxy and its absolute position is  and
and  . This maser feature does not show any position-velocity gradient. The multiple Gaussian fit of its spectrum reveals that the maser feature (LH2O = 491 L⊙) is composed of two Gaussian components with similar peak flux densities (∼24 mJy beam−1). The narrowest one (ΔvL = 4.6 km s−1) is centered at 7398.8 km s−1, and the other one (ΔvL = 68.9 km s−1) at 7396.5 km s−1. No continuum emission has been detected at the 1σ level (rms = 0.2 mJy beam−1).
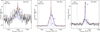 |
Fig. 4. Total intensity spectra (I) of the H2O maser features detected toward TXS 2226-184 in epochs 2017.83 (first panel on the left) and 2018.44 (second and third panels) with the EVN after a boxcar smoothing of ten channels. A channel averaging was performed in epoch 2018.44 in order to have comparable spectral width between the two EVN epochs. The thick blue lines are the Gaussian fit of the different components labeled in blue (see Table 3), the dashed red line is the combination of the fit of the components of each maser feature. The dashed black line indicates the systemic velocity of the galaxy in the radio convention (i.e., 7270 km s−1). |
4.4. EVN epoch 2018.44
In epoch 2018.44 we detected two H2O maser features (TXS.W01 and TXS.W02), which are listed in Table 3; instead of the absolute position, here we report the relative position with respect to the maser feature used to self-calibrate the data, i.e., TXS.W01. Neither maser feature shows a position-velocity gradient. Their spectra are shown in Fig. 4. Both maser features are red-shifted with respect to the systemic velocity of the galaxy and are aligned from northeast (7357.6 km s−1) to southwest (7402.5 km s−1, the most red-shifted). Again the maser spectra are better fit by two Gaussian components, one narrow (5.0 km s−1 ≤ ΔvL ≤ 7.4 km s−1) and one wide (36.6 km s−1 ≤ ΔvL ≤ 43.7 km s−1). In the case of TXS.W01 (LH2O = 480 L⊙) the peak flux of components 14 and 15 are close, while for TXS.W02 (LH2O = 94 L⊙) there is a large difference between the two components 16 and 17. None of the maser features showed a signature of polarized emission, neither linearly nor circularly polarized ( and
and  ). No continuum emission has been detected at the 1σ level (rms = 0.2 mJy beam−1).
5. Discussion
In the following we compare the different epochs and we discuss the possible origin of the 22 GHz H2O maser emission in light of the new findings. Regarding the VLBA epoch 1998.40, we discuss the results obtained by our calibration and analysis, and refer only marginally to those reported in Ball et al. (2005).
5.1. Comparison between epochs
Before comparing the results obtained from epoch 1998.40 with those from the most recent epochs, we briefly discuss the contribution provided by the EVN epochs 2017.83 and 2018.44.
The only maser feature (TXS.E01) detected during the EVN observations in epoch 2017.83 does not add significant information to the maser distribution in addition to what we already have from the VLBA epoch 2017.45. This is mainly due to the lower spatial resolution (the beam is almost three times larger) and to the higher spectral noise (see Table 1). Furthermore, the amplitude uncertainty due to the technical problem that affected the EVN observations in epoch 2017.83 prevents us from studying the flux variation on a timescale of months over the three most recent epochs. However, the results of this EVN epoch still play an important part in our discussion. Although many of the H2O maser features detected with the VLBA in epoch 2017.45 are undetected with the EVN in epoch 2017.83 due to the high noise that hides them below our detection threshold, the registered absolute position of TXS.E01 agrees with those measured for the maser features detected with the VLBA. This consistency is evident in Fig. 6, where we have overplotted the absolute positions of the H2O maser features detected with the VLBA in epoch 2017.45 (crosses) on the contour map of the brightest maser spot of TXS.E01.
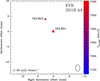 |
Fig. 5. View of the H2O maser features detected toward TXS 2226-184 with the EVN in epoch 2018.44. Same symbols as in Fig. 2. In absence of absolute position measurements the relative positions of all maser features are evaluated considering the brightest maser feature (TXS.W01) as reference. |
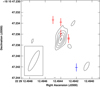 |
Fig. 6. Comparison of the absolute positions measured for TXS.E01 (contour plot of the peak channel) and for TXS.V01–TXS.V06 (crosses). Contours are 2, 3, 4, 5, 6 × 21.75 mJy beam−1 and on the bottom left corner the EVN beam size is shown (see Table 1). Red crosses indicate the red-shifted H2O maser features with respect to the systemic velocity of the galaxy ( |

The maser features detected during the EVN epoch 2018.44 confirm the presence of the persistent linear distribution of the maser features over time. In particular, we can state that TXS.W01 is produced by the blending of the features TXS.V01–V03, seen by comparing ΔvL and the velocity range, and that TXS.W02 is related to TXS.V05, although their relative position with respect to the corresponding brightest maser features is a bit different (in epoch 2018.44 it is larger). We also note that the blending of maser features is expected because of the beam shape of epoch 2018.44, which is elongated toward the northeast. Furthermore, we note a small velocity difference between TXS.W02 and TXS.V05. However, both of these inconsistencies might be due to the small difference in beam size between the two epochs. It is more important instead that the profile morphology of the maser features detected with the EVN (Fig. 4), even though they are the result of a blending of several maser features detected during the VLBA observations, confirms those observed for TXS.V01–TXS.V05 (see Fig. 3). All spectra are composed of two Gaussian components, one much narrower than the other, as observed for the red-shifted maser features with the VLBA in epoch 2017.45. Of course the last EVN epoch also indicates the absence of a strong magnetic field able to produce a circularly polarized emission. Therefore, the EVN results from the two epochs firmly confirm the results that we obtained with the VLBA in epoch 2017.45. From now on our discussion is focused on the two VLBA epochs (1998.40 and 2017.45).
We summed the 11 Gaussian components obtained by fitting the six maser features detected with the VLBA in epoch 2017.45; the resultant profile is shown as red dot-dashed line in Fig. 7. Here, we also show the spectrum of the H2O gigamaser detected with the GBT in epoch 2010.94. We can see that the two profiles are consistent with each other, even though the fluxes are different. This might be due to the different spatial resolution of the two observations and, more importantly, to the criteria we chose to identify the H2O maser features in the VLBA data cube and the way the spectra are extracted from the VLBI image cube (see Sect. 3.3). The only obvious difference between the two profiles is the emission at 7300 km s−1 in the GBT profile that is not recovered in the VLBA profile. This emission might either be produced by many H2O maser features below our detection threshold of 3σ or be completely resolved out in the VLBI observations.
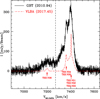 |
Fig. 7. Comparison between the total intensity spectra (I) of the H2O gigamaser detected toward TXS 2226-184 with the GBT in epoch 2010.94 (black histogram) and the combination (red dot-dashed line) of the 11 Gaussian components determined for the six H2O maser features (TXS.V01–TXS.V06) detected with the VLBA in epoch 2017.45. The red arrows indicate the velocities of the total intensity peak of the different maser features (see Table 3). The dashed black line indicates the systemic velocity of the galaxy in the radio convention (7270 km s−1). |
Thanks to the similar beam size and spectral resolution we can now compare the two VLBA epochs 1998.40 and 2017.45. There are two times more H2O maser features detected in epoch 2017.45 than in epoch 1998.40, even though the total luminosity is comparable. We note that the difference of spectral line noise at the two epochs is only of 1.5 mJy beam−1 km s−1 (see Tables 2 and 3). This suggests that the maser activity after about 20 years has not changed significantly, as seen from the single-dish observations (e.g., Braatz et al. 2003). At both epochs the maser features are linearly distributed with the same position angle (PA1998.40 = +26° ±16° and PA2017.45 = +28° ±12°). A blue-shifted maser feature is detected only in epoch 2017.45 and its luminosity (∼80 L⊙) is still much higher than the nominal threshold (10 L⊙) used to classify an extragalactic H2O maser as kilomaser or megamaser (see Sect. 1). Although we did not detect this blue-shifted maser feature in epoch 1998.40, its relative position with respect to the other red-shifted maser features coincides with the position indicated by Ball et al. (2005).
The morphologies of the line profiles between the two epochs are quite different, even though almost every maser line is fitted by two Gaussian components. In epoch 1998.40 the Gaussian components are all broader than in epoch 2017.4. In particular the ΔvL of the broadest components of the maser features are on average double than those of the broadest components in epoch 2017.45, and the ΔvL of the narrowest components of the maser features are on average four times larger than those of the narrowest components in epoch 2017.45. Therefore, the maser features appear on average to become narrower. Considering the ratio of the linewidths of the two components within the same maser feature, we have that in epoch 1998.40 there is a factor of three between the narrow and the broad components, while in epoch 2017.45 this ratio is between 4 and 17. In particular, the narrow components in epoch 2017.45 show a particularly small linewidth on the order of a few km s−1. The difference in linewidth between the two epochs might be due either to a further amplification of the maser emission (e.g., increase in the number of H2O molecules with a population inversion) but still within the unsaturated regime, or to the characteristic of the gas that the maser features are tracing (e.g., Gray 2012).
Another aspect is the difference in the peak velocities of the Gaussian components between the two epochs. This difference can be seen by comparing Table 2 and Table 3, but it is more evident in Fig. 8. Here we plot the peak flux densities of the Gaussian components as a function of their peak velocities for the two epochs (red triangles for epoch 1998.40 and black squares for epoch 2017.45). The horizontal bars indicate the linewidth (ΔvL) of the Gaussian components and the vertical lines the mean velocity of each maser group at the two epochs (red for epoch 1998.40 and black for epoch 2017.45). We grouped the maser features as follow: TXS.B01 and TXS.V01–V03 are part of the central group and TXS.B03 and TXS.V04–V05 are part of the north group. The two Gaussian components of feature TXS.B02 show a peak velocity difference of ∼40 km s−1; therefore, for the calculation of the mean velocities we split them between the two groups according to their peak velocity (component 4 in the north group and component 3 in the central group). The blue-shifted maser feature TXS.V06 is not considered here. The mean velocities are: for the north group (dashed lines) 7354.8 km s−1 and 7362.6 km s−1 in epochs 1998.40 and 2017.45, respectively; and 7393.6 km s−1 and 7403.7 km s−1 for the central group (dotted lines) in epochs 1998.40 and 2017.45, respectively. The velocity difference is +7.8 km s−1 and +10.1 km s−1 for the north and central groups, respectively, suggesting a possible acceleration of the gas in the last 20 years or, more likely, maser variability. That is, the brightest maser features observed in 2017.45 were weaker in 1998.40 and viceversa. This might explain the relative prominence of the individual features at the two different epochs. A systematic “acceleration” caused by a technical problem in data acquisition and/or during the data reduction is unlikely because of the large number of spectral channels involved (∼40).
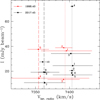 |
Fig. 8. Peak flux densities vs peak velocities of the Gaussian components fitted to the H2O maser features detected in epochs 1998.40 (red triangles) and 2017.45 (black squares). The segments represent the ΔvL of the Gaussian components. The dashed and dotted lines indicate the mean velocities of the north (TXS.B03 and TXS.V04–V05) and the central (TXS.B01 and TXS.V01–V03) groups of the H2O maser features, respectively, at the two different epochs. The two components (3 and 4) of TXS.B02 are considered part of the intermediate gas between the two groups, and therefore have been separated for the calculation of the mean velocities. The numbers correspond to the fitted Gaussian components, as reported in Tables 2 and 3 (see Sect. 5.1 for more details). |
5.2. Nature of the (giga)maser
Taylor et al. (2004) presented the 1.4 GHz radio continuum emission map of the nuclear region of TXS 2226-184 at a resolution of 20 × 12 mas (the phase-reference calibrator was J2236-1706 at a distance from TXS 2226-184 of  ). This shows several clumps of emission that they supposed originated from a jet extending over 100 pc with a PAoutflow = −36°. They discussed the nature of the gigamaser in TXS 2226-184 by considering three different scenarios without knowing the exact position of the maser emission, but favoring the jet nature of the H2O maser. For the first time we are able to provide the absolute position of the maser emission and, more importantly, to compare the position of the maser distribution with the continuum emission observed by Taylor et al. (2004) with a relative accuracy of 10 mas (assuming position errors equal of half-beam of the continuum emission since no position errors were reported in the paper). The H2O maser features detected with the VLBA in epoch 2017.45 are overplotted on the 1.4 GHz radio continuum emission in Fig. 9; the error bars of the absolute positions are also shown. The H2O maser emission originates close to the most luminous north clump; in particular, the red-shifted maser features seem to follow very closely the morphology of the radio continuum emission at 3σ and the blue-shifted maser feature follows the emission at 6σ. Taylor et al. (2004) measured toward that clump H I absorption at the systemic velocity of TXS 2226-184 with an optical depth in the interval 0.4 < τ < 0.6. From their Fig. 1 and knowing the maser’s position, we find that the maser emission is associated with the gas with the largest τ, as expected.
 |
Fig. 9. Continuum emission of 1.4 GHz from the nuclear region of TXS 2226-184 as observed with the VLBA in 2002 (Taylor et al. 2004). Contours are −1, 1, 2, 4, 6, 8, …, 26 × 3σ, where σ = 43.23 μJy beam−1. The red and blue crosses indicate the positions of the red-shifted and blue-shifted H2O masers with respect to the systemic velocity of the galaxy ( |

From standard maser theory, the population inversion in the H2O molecules, which is necessary to produce the maser emission at 22 GHz, is due to the passage of a shock through the molecular gas (e.g., Gray 2012). The 22 GHz H2O masers are therefore detected in the post-shocked gas (e.g., Goddi et al. 2017). Because in TXS 2226-184 the maser features are located at the edge of the 3σ continuum emission, it is possible that the shock originates from the continuum emission and expands outward (see panel A of Fig. 10). Taking into account the peak flux density of the maser features (Col. 5 of Table 6) and the velocity difference along the line of sight between the velocities of the maser features (Col. 6 of Table 6) and the velocity of the nuclear region of TXS 2226-184, which we assume to be equal to the recessional velocity of the galaxy (7270 km s−1), we can speculatively try to locate the masers in the 3D space (panel B of Fig. 10). We represent the molecular gas where the maser emission arises as a regular ellipsoid, i.e., with the same section from all lateral points of view. The ellipsoid is larger than the 3σ contour of the continuum emission because we assume that the gas extends at least to where the maser features arise. We also assumed that the axis of the ellipsoid moves at the velocity of the nuclear region of TXS 2226-184; therefore, the red-shifted maser features are located farther away from the observer than the blue-shifted feature. Following this, we sketch the possible locations of the amplification paths of the maser features in panel B of Fig. 10; however, we do not have any indication of how deep they go into the ellipsoid. We assumed in Fig. 10 that the brighter the maser feature is, the more embedded in the ellipsoid it is because of the longer maser amplification path. Nevertheless, the length of the segments in panel B of Fig. 10 do not represent the real length of the maser amplification paths; any estimation of these paths is impossible with the information we have at the moment, but it helps the reader to visualize our idea. Of course this is one of the possible explanations of the pumping of the maser features. It might also be plausible that the shock does not have any relation with the continuum emission. In this case the shock might originate somewhere to the southeast of the most luminous north clump and might move toward it (i.e., the shock shapes the continuum emission, but it is not part of it).
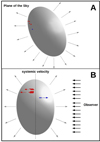 |
Fig. 10. Sketch of the proposed location of the H2O maser features. The gray ellipsoid represents the molecular gas where the maser emission originates; the gray arrows around the ellipsoid show the directions of the shock that inverted the population of the maser levels. Panel A: location of the maser features, as projected on the plane of the sky (see Fig. 9). Shown are the red-shifted maser features (TXS.V01 – TXS.V05) with respect to the systemic velocity of the galaxy (red dots) and the blue-shifted maser feature (TXS.V06) (blue dot). Panel B: proposed location of the maser features as seen from the east, i.e., with the observer’s point of view on the right (black arrows). The red and blue segments are respectively the amplification paths of the red-shifted maser feature (TXS.V01 – TXS.V05) and the blue-shifted maser feature (TXS.V06). The length of the segments are not physical; the different length indicates the different peak flux density (see Table 6). The size and direction of the red and blue arrows (pointing left and right, respectively) indicate the velocity difference between the maser features and the systemic velocity (dotted vertical line) of the galaxy. |
Although we were able to finally determine the absolute position of the H2O maser features in TXS 2226-184, the position of the nucleus of the galaxy is still uncertain. In the literature it is reported that the most luminous 22 GHz H2O masers (the megamasers) are associated with AGNs, either with their accretion disk (called disk-type maser; e.g., NGC 4258, Miyoshi et al. 1995) or, less commonly (possibly because less investigated), with the jet (jet-type maser; e.g., Mrk 348, Peck et al. 2003) or the outflow (e.g., Circinus; Greenhill et al. 2003). In both cases the masers could show a linear distribution on the plane of the sky, but what mainly distinguishes them, apart from the relative orientation with respect to the continuum emission produced by the disk or the jet, is the single-dish line profile (e.g., Tarchi et al. 2012). In the disk-type profile three groups of narrow lines (<10 km s−1; e.g., NGC 4258, Humphreys et al. 2013, and references therein) are observed: one at the systemic velocity, and one each blue- and red-shifted from this. Generally, the velocity separation between the systemic lines to the others is on the order of hundreds km s−1 (e.g., Pesce et al. 2015). However, one or two groups of them might be undetected (e.g., NGC 4388, Kuo et al. 2011). For the jet-type maser only one group of lines is observed and usually they are much wider than the disk-type lines (e.g., Gallimore et al. 2001; Henkel et al. 2005). Therefore, we cannot determine where the center of the AGN is located from the maser emission. What we can do instead is to discuss the two most plausible scenarios.
Following Taylor et al. (2004), if the continuum emission is due to a two-sided jet then we can assume that the AGN (i.e., the black hole) is located in the gap between the two largest continuum emissions (case I). In this case the maser features cannot trace the disk, but they trace a shock due to the jet (jet-like maser). This shock can be either the one we discussed above and showed in Fig. 10, which we think is produced by a “bubble” that originates from the jet, or is produced by the shock that hits the gas from southeast of the north clump. Alternatively, if the black hole is located where the optical depth is larger, therefore in the most luminous north clump (Taylor et al. 2004) (case II), two options are viable: the black hole is at the center of the continuum emission (case IIa) or the black hole is where the H2O maser features arise (case IIb). In case IIa the ellipsoid of Fig. 10 is the jet, or outflow, that is ejected from the black hole, and consequently our idea described above agrees and we have a new case of jet-type maser. In case IIb the maser features might trace the disk, as suggested by Ball et al. (2005), and we might have a disk-type maser. In this latter case, our Fig. 10 does not apply. From the data at our disposal it is also difficult to assess whether the entire radio continuum emission can be associated with a radio jet and not, partly, with star formation. LINERs are often believed to host prominent nuclear star formation activity. However, the H2O maser features in TXS 2226-184 are so luminous that they can be confidently associated with the AGN activity.
It is possible to think that the profile of the H2O maser features can help to disentangle the nature of the maser. Actually, this adds more uncertainty. The single-dish profile of the H2O maser (Fig. 7) shows only one group of maser features located around the systemic velocity of TXS 2226-184 (200 km s−1) and does not clearly show the other two satellite groups, but this might be due to the weakness of the other two satellite groups. On the other hand, the single-dish profile shows a notable stability over a time span of years (e.g., Braatz et al. 2003), which is rarely found in jet- or outflow-associated masers. These maser types usually display (highly) variable features (Tarchi et al. 2012, and references therein). The maser in TXS 2226-184 seems to resemble more closely the case of the H2O maser found in the gravitationally lensed Quasar MGJ0414+0534 (Impellizzeri et al. 2008), whose nature is still disputed, for which a monthly cadence monitoring of the broad maser line has not shown significant flux-density changes within a 15-months period (Castangia et al. 2011). From the VLBI profile we see for almost each maser feature two components: one very narrow, with ΔvL < 10 km s−1 (typical of disk-type maser), and one very broad, with ΔvL > 20 km s−1 (typical of jet-type maser; see Table 6). We note that with the present data we cannot infer any significant consideration on the acceleration of the maser features due to a Keplerian rotation. From the line profiles and the spatial distribution of the maser features it is very difficult to determine the nature of the 22 GHz H2O maser emission; a combination of the two types might also be the case. However, further observations of different tracers of outflow or jet material at comparable spatial resolution of the VLBI and a better knowledge of the radio continuum in the nucleus (e.g., spectral index) might help to answer the many fundamental questions regarding TXS 2226-184, in particular where the black hole of the AGN and its jet are.
6. Summary
The 22 GHz H2O gigamaser in the galaxy TXS 2226-184 was observed twice in phase-reference mode and once in full polarization mode, for a total of three epochs, with the VLBA and the EVN. We detected six H2O maser features and thanks to the measurements of the absolute positions we were able to associate them with the most luminous radio continuum clump of the nuclear region of the galaxy. But what the maser features actually trace is still uncertain. They might trace either a jet–outflow or the accretion disk of the AGN located in the nuclear region of TXS 2226-184. With the data at our disposal we also cannot completely rule out a possible association with star formation, even though the extreme high luminosity of the maser features seems to be sufficient to exclude it. Furthermore, no polarized maser emission has been detected. Further observations, especially radio continuum observations at different frequencies (e.g., to determine spectral indexes) are necessary to disentangle the possible origins of the 22 GHz H2O maser in TXS 2226-184.
Tarchi et al. (2011; their Sect. 4.2) warned that this distinction should, however, be used with caution.
The NRAO is a facility of the National Science Foundation operated under cooperative agreement by Associated Universities, Inc.
The European VLBI Network is a joint facility of European, Chinese, South African, and other radio astronomy institutes funded by their national research councils.
Acknowledgments
We wish to thank the anonymous referee for the useful suggestions that have improved the paper. The European VLBI Network is a joint facility of independent European, African, Asian, and North American radio astronomy institutes. Scientific results from data presented in this publication are derived from the following EVN project code(s): ES084. We thank G.B. Taylor for providing the FITS file we used to make Fig. 9.
References
- Ball, G. H., Greenhill, L. J., Moran, J. M., Zaw, I., & Henkel, C. 2005, in Future Directions in High Resolution Astronomy, eds. J. Romney, & M. Reid, ASP Conf. Ser., 340, 235 [NASA ADS] [Google Scholar]
- Barvainis, R., & Antonucci, R. 2005, ApJ, 628, L89 [NASA ADS] [CrossRef] [Google Scholar]
- Bennert, N., Schulz, H., & Henkel, C. 2004, A&A, 419, 127 [NASA ADS] [CrossRef] [EDP Sciences] [Google Scholar]
- Bennert, N., Barvainis, R., Henkel, C., & Antonucci, R. 2009, ApJ, 695, 276 [NASA ADS] [CrossRef] [Google Scholar]
- Braatz, J. A., Wilson, A. S., & Henkel, C. 1994, ApJ, 437, L99 [NASA ADS] [CrossRef] [Google Scholar]
- Braatz, J. A., Wilson, A. S., Henkel, C., Gough, R., & Sinclair, M. 2003, ApJS, 146, 249 [NASA ADS] [CrossRef] [Google Scholar]
- Braatz, J., Condon, J., Henkel, C., et al. 2018, in Astrophysical Masers: Unlocking the Mysteries of the Universe, eds. A. Tarchi, M. J. Reid, P. Castangia, et al., IAU Symp., 336, 86 [NASA ADS] [Google Scholar]
- Burns, R. A., Orosz, G., Bayandina, O., et al. 2019, MNRAS, 2756 [Google Scholar]
- Castangia, P., Impellizzeri, C. M. V., McKean, J. P., et al. 2011, A&A, 529, A150 [NASA ADS] [CrossRef] [EDP Sciences] [Google Scholar]
- Castangia, P., Tarchi, A., Caccianiga, A., Severgnini, P., & Della Ceca, R. 2016, A&A, 586, A89 [NASA ADS] [CrossRef] [EDP Sciences] [Google Scholar]
- Castangia, P., Surcis, G., Tarchi, A., et al. 2019, A&A, 629, A25 [NASA ADS] [CrossRef] [EDP Sciences] [Google Scholar]
- Claussen, M. J., Diamond, P. J., Braatz, J. A., Wilson, A. S., & Henkel, C. 1998, ApJ, 500, L129 [NASA ADS] [CrossRef] [Google Scholar]
- Falcke, H., Wilson, A. S., Henkel, C., Brunthaler, A., & Braatz, J. A. 2000, ApJ, 530, L13 [NASA ADS] [CrossRef] [Google Scholar]
- Gallimore, J. F., Henkel, C., Baum, S. A., et al. 2001, ApJ, 556, 694 [NASA ADS] [CrossRef] [Google Scholar]
- Gao, F., Braatz, J. A., Reid, M. J., et al. 2017, ApJ, 834, 52 [NASA ADS] [CrossRef] [Google Scholar]
- Goddi, C., Surcis, G., Moscadelli, L., et al. 2017, A&A, 597, A43 [NASA ADS] [CrossRef] [EDP Sciences] [Google Scholar]
- Gray, M. 2012, Maser Sources in Astrophysics (Cambridge: Cambridge University Press) [CrossRef] [Google Scholar]
- Greenhill, L. J., Booth, R. S., Ellingsen, S. P., et al. 2003, ApJ, 590, 162 [NASA ADS] [CrossRef] [Google Scholar]
- Henkel, C., Peck, A. B., Tarchi, A., et al. 2005, A&A, 436, 75 [NASA ADS] [CrossRef] [EDP Sciences] [Google Scholar]
- Henkel, C., Greene, J. E., & Kamali, F. 2018, in Astrophysical Masers: Unlocking the Mysteries of the Universe, eds. A. Tarchi, M. J. Reid, & P. Castangia, IAU Symp., 336, 69 [NASA ADS] [Google Scholar]
- Humphreys, E. M. L., Reid, M. J., Moran, J. M., Greenhill, L. J., & Argon, A. L. 2013, ApJ, 775, 13 [Google Scholar]
- Impellizzeri, C. M. V., McKean, J. P., Castangia, P., et al. 2008, Nature, 456, 927 [NASA ADS] [CrossRef] [PubMed] [Google Scholar]
- Keimpema, A., Kettenis, M. M., Pogrebenko, S. V., et al. 2015, Exp. Astron., 39, 259 [NASA ADS] [CrossRef] [Google Scholar]
- Koekemoer, A. M., Henkel, C., Greenhill, L. J., et al. 1995, Nature, 378, 697 [NASA ADS] [CrossRef] [Google Scholar]
- Kuo, C. Y., Braatz, J. A., Condon, J. J., et al. 2011, ApJ, 727, 20 [NASA ADS] [CrossRef] [Google Scholar]
- Kuo, C. Y., Constantin, A., Braatz, J. A., et al. 2018, ApJ, 860, 169 [NASA ADS] [CrossRef] [Google Scholar]
- McCallum, J. N., Ellingsen, S. P., & Lovell, J. E. J. 2007, MNRAS, 376, 549 [NASA ADS] [CrossRef] [Google Scholar]
- Miyoshi, M., Moran, J., Herrnstein, J., et al. 1995, Nature, 373, 127 [NASA ADS] [CrossRef] [Google Scholar]
- Modjaz, M., Moran, J. M., Kondratko, P. T., & Greenhill, L. J. 2005, ApJ, 626, 104 [NASA ADS] [CrossRef] [Google Scholar]
- Nedoluha, G. E., & Watson, W. D. 1992, ApJ, 384, 185 [NASA ADS] [CrossRef] [Google Scholar]
- Peck, A. B., Henkel, C., Ulvestad, J. S., et al. 2003, ApJ, 590, 149 [NASA ADS] [CrossRef] [Google Scholar]
- Pesce, D. W., Braatz, J. A., Condon, J. J., et al. 2015, ApJ, 810, 65 [NASA ADS] [CrossRef] [Google Scholar]
- Reid, M. J., & Honma, M. 2014, ARA&A, 52, 339 [NASA ADS] [CrossRef] [Google Scholar]
- Sawada-Satoh, S., Kameno, S., Nakamura, K., et al. 2008, ApJ, 680, 191 [NASA ADS] [CrossRef] [Google Scholar]
- Surcis, G., Vlemmings, W. H. T., Curiel, S., et al. 2011, A&A, 527, A48 [NASA ADS] [CrossRef] [EDP Sciences] [Google Scholar]
- Tarchi, A. 2012, in Cosmic Masers - from OH to H0, eds. R. S. Booth, W. H. T. Vlemmings, & E. M. L. Humphreys, IAU Symp., 287, 323 [NASA ADS] [CrossRef] [Google Scholar]
- Tarchi, A., Henkel, C., Chiaberge, M., & Menten, K. M. 2003, A&A, 407, L33 [NASA ADS] [CrossRef] [EDP Sciences] [Google Scholar]
- Tarchi, A., Brunthaler, A., Henkel, C., et al. 2007, A&A, 475, 497 [NASA ADS] [CrossRef] [EDP Sciences] [Google Scholar]
- Tarchi, A., Castangia, P., Henkel, C., Surcis, G., & Menten, K. M. 2011, A&A, 525, A91 [NASA ADS] [CrossRef] [EDP Sciences] [Google Scholar]
- Taylor, G. B., Peck, A. B., Henkel, C., et al. 2002, ApJ, 574, 88 [NASA ADS] [CrossRef] [Google Scholar]
- Taylor, G. B., Peck, A. B., Ulvestad, J. S., & O’Dea, C. P. 2004, ApJ, 612, 780 [NASA ADS] [CrossRef] [Google Scholar]
- Vlemmings, W. H. T., Bignall, H. E., & Diamond, P. J. 2007, ApJ, 656, 198 [NASA ADS] [CrossRef] [Google Scholar]
- Zhao, W., Braatz, J. A., Condon, J. J., et al. 2018, ApJ, 854, 124 [NASA ADS] [CrossRef] [Google Scholar]
All Tables
Parameters of the 22 GHz H2O maser features detected toward TXS 2226-184 in epoch 1998.40.
Parameters of the 22 GHz H2O maser features detected toward TXS 2226-184 in epochs 2017.45 (VLBA), 2017.83 and 2018.44 (EVN).
All Figures
|
Fig. 1. Total intensity spectra (I) of the H2O maser features detected toward TXS 2226-184 with the VLBA in epoch 1998.40. The thick blue lines are the Gaussian fit of the different components that are labeled in blue (see Table 2), the dashed red line is the combination of the Gaussian components for each maser feature. The dashed black line indicates the systemic velocity of the galaxy in the radio convention (i.e., 7270 km s−1). |
| In the text | |
|
Fig. 2. View of the H2O maser features detected toward TXS 2226-184 with the VLBA in epoch 1998.40 (left panel) and in epoch 2017.45 (right panel). Triangles identify H2O maser features whose side length is scaled logarithmically according to their peak flux density (Tables 2 and 3). The 40 mJy beam−1 symbol is plotted for comparison in both panels. Maser local standard of rest radial velocities are indicated by color (the velocity of the galaxy is |
| In the text | |
|
Fig. 3. Total intensity spectra (I) of the H2O maser features detected toward TXS 2226-184 with the VLBA in epoch 2017.45 after a boxcar smoothing of ten channels. The thick blue lines are the Gaussian fit of the different components that are labeled in blue (see Table 3), the dashed red line is the combination of the fit of the components of each maser feature. The dashed black line indicates the systemic velocity of the galaxy in the radio convention (i.e., 7270 km s−1). |
| In the text | |
|
Fig. 4. Total intensity spectra (I) of the H2O maser features detected toward TXS 2226-184 in epochs 2017.83 (first panel on the left) and 2018.44 (second and third panels) with the EVN after a boxcar smoothing of ten channels. A channel averaging was performed in epoch 2018.44 in order to have comparable spectral width between the two EVN epochs. The thick blue lines are the Gaussian fit of the different components labeled in blue (see Table 3), the dashed red line is the combination of the fit of the components of each maser feature. The dashed black line indicates the systemic velocity of the galaxy in the radio convention (i.e., 7270 km s−1). |
| In the text | |
|
Fig. 5. View of the H2O maser features detected toward TXS 2226-184 with the EVN in epoch 2018.44. Same symbols as in Fig. 2. In absence of absolute position measurements the relative positions of all maser features are evaluated considering the brightest maser feature (TXS.W01) as reference. |
| In the text | |
|
Fig. 6. Comparison of the absolute positions measured for TXS.E01 (contour plot of the peak channel) and for TXS.V01–TXS.V06 (crosses). Contours are 2, 3, 4, 5, 6 × 21.75 mJy beam−1 and on the bottom left corner the EVN beam size is shown (see Table 1). Red crosses indicate the red-shifted H2O maser features with respect to the systemic velocity of the galaxy ( |
| In the text | |
|
Fig. 7. Comparison between the total intensity spectra (I) of the H2O gigamaser detected toward TXS 2226-184 with the GBT in epoch 2010.94 (black histogram) and the combination (red dot-dashed line) of the 11 Gaussian components determined for the six H2O maser features (TXS.V01–TXS.V06) detected with the VLBA in epoch 2017.45. The red arrows indicate the velocities of the total intensity peak of the different maser features (see Table 3). The dashed black line indicates the systemic velocity of the galaxy in the radio convention (7270 km s−1). |
| In the text | |
|
Fig. 8. Peak flux densities vs peak velocities of the Gaussian components fitted to the H2O maser features detected in epochs 1998.40 (red triangles) and 2017.45 (black squares). The segments represent the ΔvL of the Gaussian components. The dashed and dotted lines indicate the mean velocities of the north (TXS.B03 and TXS.V04–V05) and the central (TXS.B01 and TXS.V01–V03) groups of the H2O maser features, respectively, at the two different epochs. The two components (3 and 4) of TXS.B02 are considered part of the intermediate gas between the two groups, and therefore have been separated for the calculation of the mean velocities. The numbers correspond to the fitted Gaussian components, as reported in Tables 2 and 3 (see Sect. 5.1 for more details). |
| In the text | |
|
Fig. 9. Continuum emission of 1.4 GHz from the nuclear region of TXS 2226-184 as observed with the VLBA in 2002 (Taylor et al. 2004). Contours are −1, 1, 2, 4, 6, 8, …, 26 × 3σ, where σ = 43.23 μJy beam−1. The red and blue crosses indicate the positions of the red-shifted and blue-shifted H2O masers with respect to the systemic velocity of the galaxy ( |
| In the text | |
|
Fig. 10. Sketch of the proposed location of the H2O maser features. The gray ellipsoid represents the molecular gas where the maser emission originates; the gray arrows around the ellipsoid show the directions of the shock that inverted the population of the maser levels. Panel A: location of the maser features, as projected on the plane of the sky (see Fig. 9). Shown are the red-shifted maser features (TXS.V01 – TXS.V05) with respect to the systemic velocity of the galaxy (red dots) and the blue-shifted maser feature (TXS.V06) (blue dot). Panel B: proposed location of the maser features as seen from the east, i.e., with the observer’s point of view on the right (black arrows). The red and blue segments are respectively the amplification paths of the red-shifted maser feature (TXS.V01 – TXS.V05) and the blue-shifted maser feature (TXS.V06). The length of the segments are not physical; the different length indicates the different peak flux density (see Table 6). The size and direction of the red and blue arrows (pointing left and right, respectively) indicate the velocity difference between the maser features and the systemic velocity (dotted vertical line) of the galaxy. |
| In the text | |
Current usage metrics show cumulative count of Article Views (full-text article views including HTML views, PDF and ePub downloads, according to the available data) and Abstracts Views on Vision4Press platform.
Data correspond to usage on the plateform after 2015. The current usage metrics is available 48-96 hours after online publication and is updated daily on week days.
Initial download of the metrics may take a while.