Fig. 2.
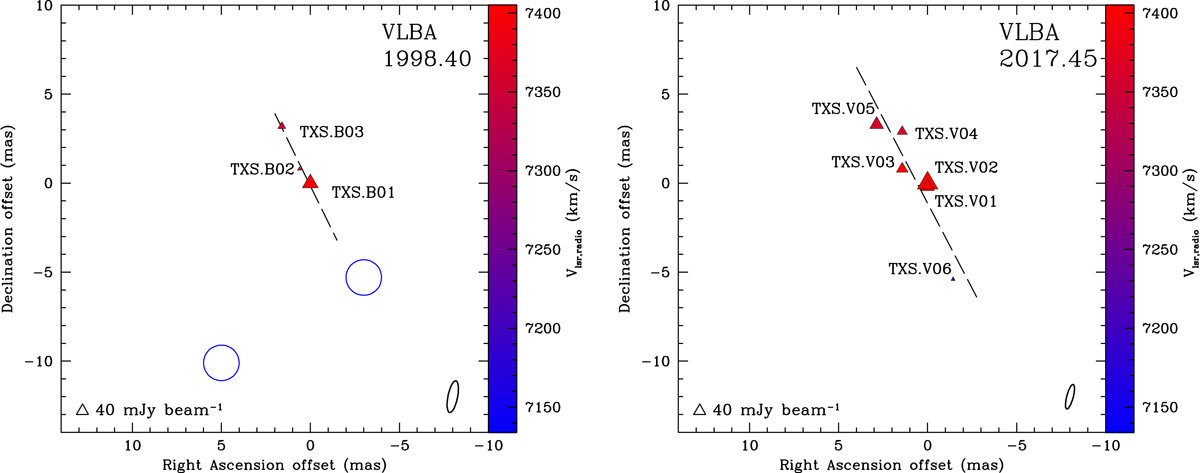
View of the H2O maser features detected toward TXS 2226-184 with the VLBA in epoch 1998.40 (left panel) and in epoch 2017.45 (right panel). Triangles identify H2O maser features whose side length is scaled logarithmically according to their peak flux density (Tables 2 and 3). The 40 mJy beam−1 symbol is plotted for comparison in both panels. Maser local standard of rest radial velocities are indicated by color (the velocity of the galaxy is ![]() km s−1). The beam size (see Table 1) is shown in the bottom right corner. At the distance of the galaxy (i.e., 107.1 Mpc, derived assuming H0 = 70 km s−1 Mpc−1, Kuo et al. 2018) 1 mas corresponds to ∼0.5 pc. Left panel: in absence of absolute position measurements the relative positions of all maser features are evaluated considering the brightest maser feature (TXS.B01) as reference. The two blue circles indicate the area where Ball et al. (2005) detected the blue-shifted maser features and we did not (detection threshold of 3σ). The dashed line is the best least-squares linear fit of the maser distribution (PAH2O = +26° ±16°). Right panel: the reference position is the absolute position of TXS.V02 (see Table 3). The dashed line is the best least-squares linear fit of the maser distribution (PAH2O = +28° ±12°).
km s−1). The beam size (see Table 1) is shown in the bottom right corner. At the distance of the galaxy (i.e., 107.1 Mpc, derived assuming H0 = 70 km s−1 Mpc−1, Kuo et al. 2018) 1 mas corresponds to ∼0.5 pc. Left panel: in absence of absolute position measurements the relative positions of all maser features are evaluated considering the brightest maser feature (TXS.B01) as reference. The two blue circles indicate the area where Ball et al. (2005) detected the blue-shifted maser features and we did not (detection threshold of 3σ). The dashed line is the best least-squares linear fit of the maser distribution (PAH2O = +26° ±16°). Right panel: the reference position is the absolute position of TXS.V02 (see Table 3). The dashed line is the best least-squares linear fit of the maser distribution (PAH2O = +28° ±12°).
Current usage metrics show cumulative count of Article Views (full-text article views including HTML views, PDF and ePub downloads, according to the available data) and Abstracts Views on Vision4Press platform.
Data correspond to usage on the plateform after 2015. The current usage metrics is available 48-96 hours after online publication and is updated daily on week days.
Initial download of the metrics may take a while.