Fig. 8.
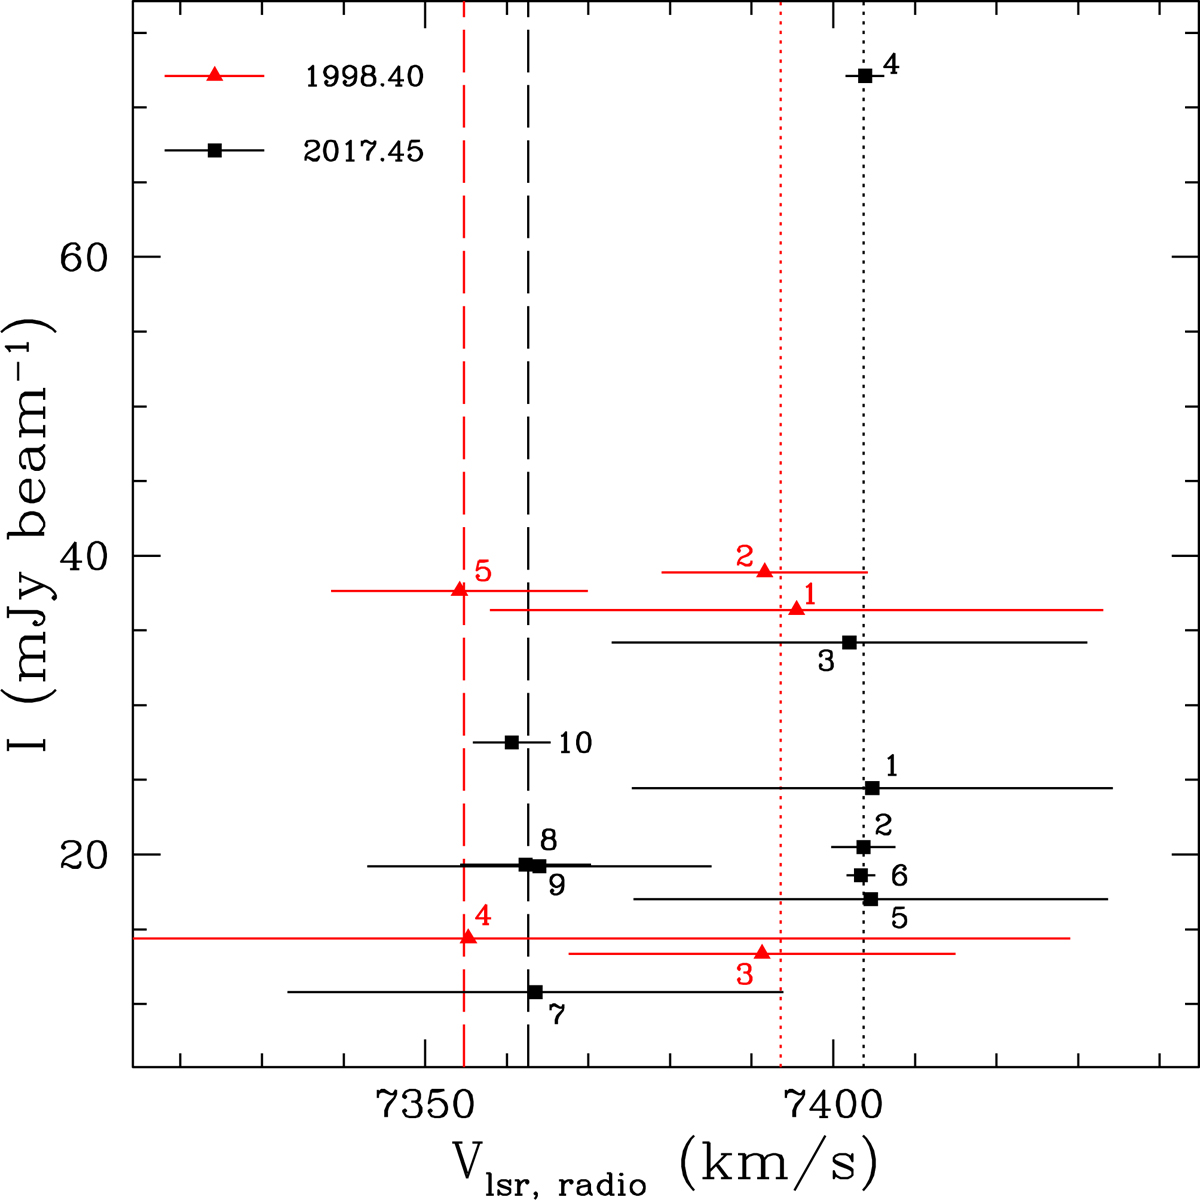
Peak flux densities vs peak velocities of the Gaussian components fitted to the H2O maser features detected in epochs 1998.40 (red triangles) and 2017.45 (black squares). The segments represent the ΔvL of the Gaussian components. The dashed and dotted lines indicate the mean velocities of the north (TXS.B03 and TXS.V04–V05) and the central (TXS.B01 and TXS.V01–V03) groups of the H2O maser features, respectively, at the two different epochs. The two components (3 and 4) of TXS.B02 are considered part of the intermediate gas between the two groups, and therefore have been separated for the calculation of the mean velocities. The numbers correspond to the fitted Gaussian components, as reported in Tables 2 and 3 (see Sect. 5.1 for more details).
Current usage metrics show cumulative count of Article Views (full-text article views including HTML views, PDF and ePub downloads, according to the available data) and Abstracts Views on Vision4Press platform.
Data correspond to usage on the plateform after 2015. The current usage metrics is available 48-96 hours after online publication and is updated daily on week days.
Initial download of the metrics may take a while.