Fig. 9.
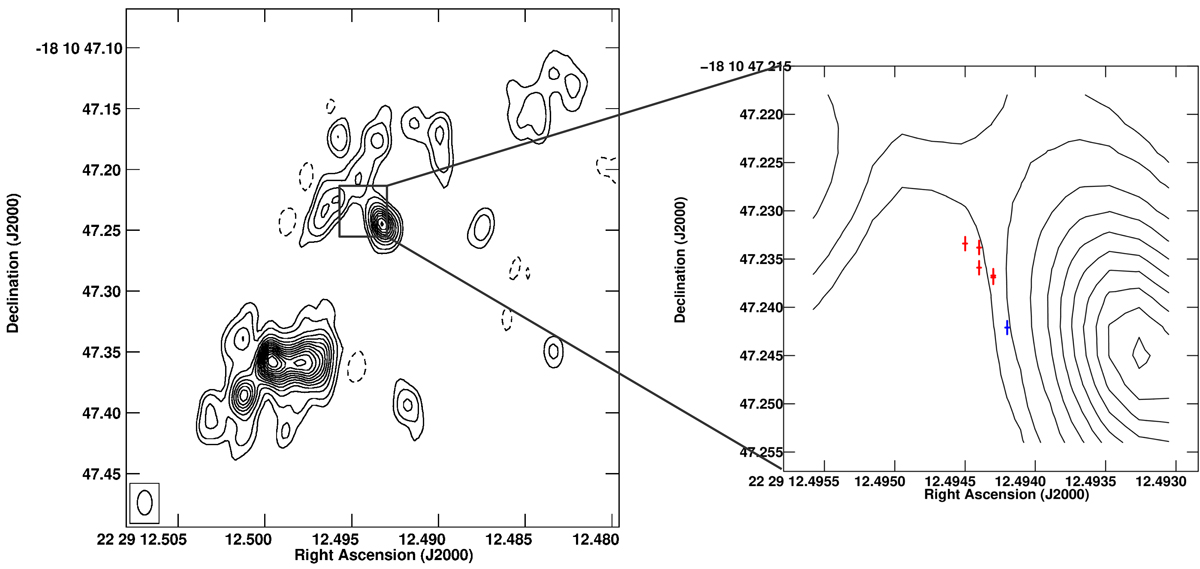
Continuum emission of 1.4 GHz from the nuclear region of TXS 2226-184 as observed with the VLBA in 2002 (Taylor et al. 2004). Contours are −1, 1, 2, 4, 6, 8, …, 26 × 3σ, where σ = 43.23 μJy beam−1. The red and blue crosses indicate the positions of the red-shifted and blue-shifted H2O masers with respect to the systemic velocity of the galaxy (![]() km s−1), respectively, detected with the VLBA in epoch 2017.45 (see Sect. 4.2). The size of each cross corresponds to the absolute position error.
km s−1), respectively, detected with the VLBA in epoch 2017.45 (see Sect. 4.2). The size of each cross corresponds to the absolute position error.
Current usage metrics show cumulative count of Article Views (full-text article views including HTML views, PDF and ePub downloads, according to the available data) and Abstracts Views on Vision4Press platform.
Data correspond to usage on the plateform after 2015. The current usage metrics is available 48-96 hours after online publication and is updated daily on week days.
Initial download of the metrics may take a while.