Fig. 1.
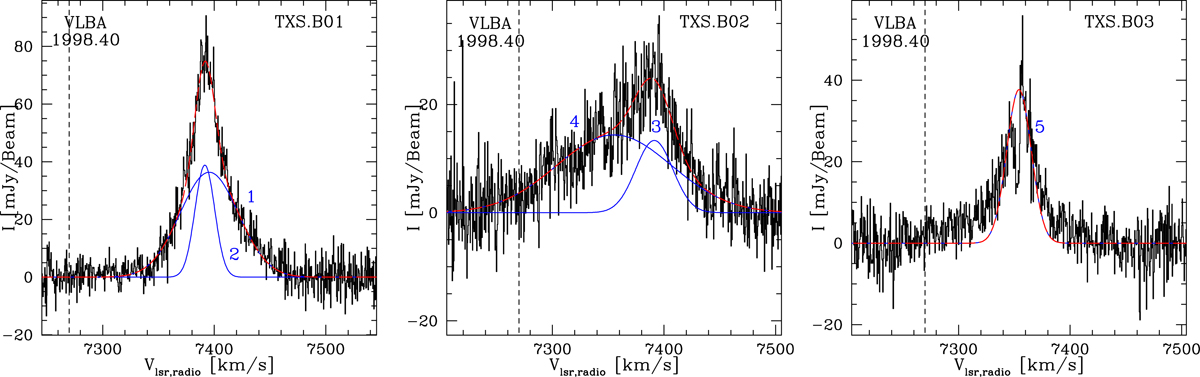
Total intensity spectra (I) of the H2O maser features detected toward TXS 2226-184 with the VLBA in epoch 1998.40. The thick blue lines are the Gaussian fit of the different components that are labeled in blue (see Table 2), the dashed red line is the combination of the Gaussian components for each maser feature. The dashed black line indicates the systemic velocity of the galaxy in the radio convention (i.e., 7270 km s−1).
Current usage metrics show cumulative count of Article Views (full-text article views including HTML views, PDF and ePub downloads, according to the available data) and Abstracts Views on Vision4Press platform.
Data correspond to usage on the plateform after 2015. The current usage metrics is available 48-96 hours after online publication and is updated daily on week days.
Initial download of the metrics may take a while.