Fig. 10.
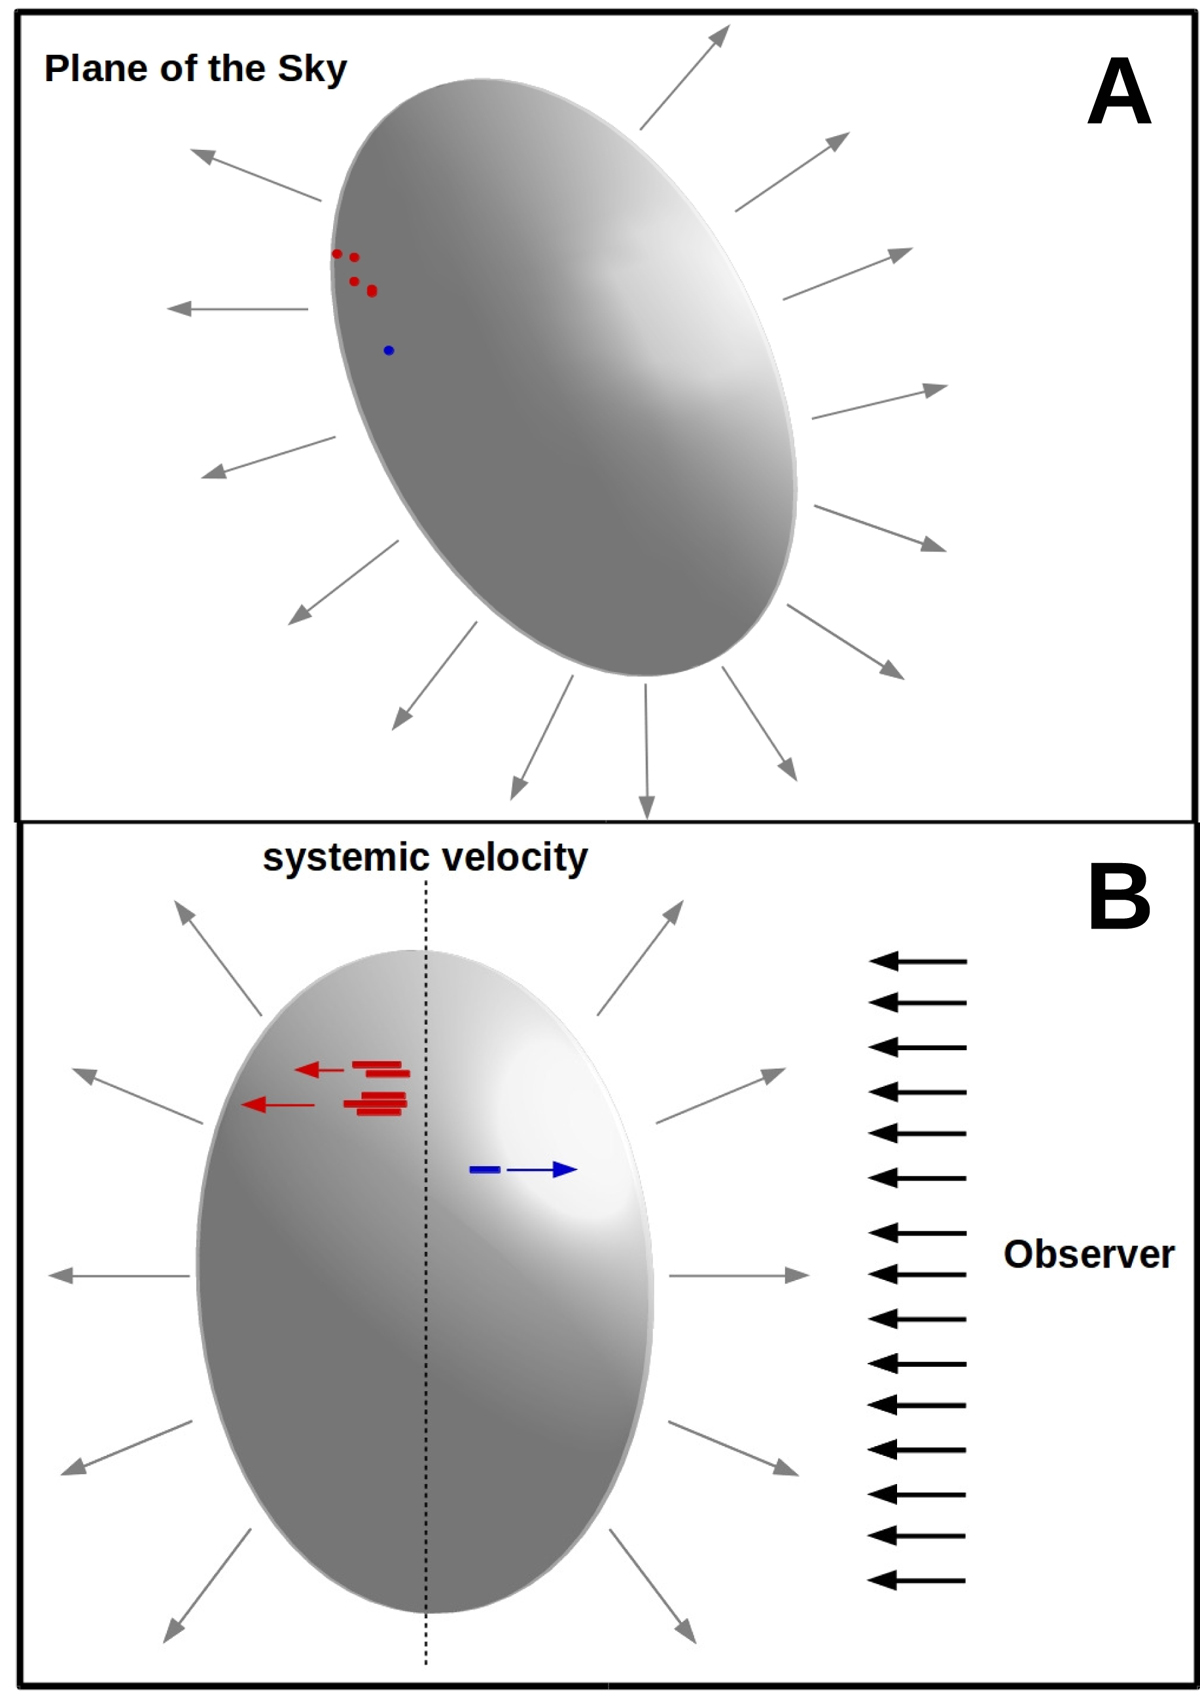
Sketch of the proposed location of the H2O maser features. The gray ellipsoid represents the molecular gas where the maser emission originates; the gray arrows around the ellipsoid show the directions of the shock that inverted the population of the maser levels. Panel A: location of the maser features, as projected on the plane of the sky (see Fig. 9). Shown are the red-shifted maser features (TXS.V01 – TXS.V05) with respect to the systemic velocity of the galaxy (red dots) and the blue-shifted maser feature (TXS.V06) (blue dot). Panel B: proposed location of the maser features as seen from the east, i.e., with the observer’s point of view on the right (black arrows). The red and blue segments are respectively the amplification paths of the red-shifted maser feature (TXS.V01 – TXS.V05) and the blue-shifted maser feature (TXS.V06). The length of the segments are not physical; the different length indicates the different peak flux density (see Table 6). The size and direction of the red and blue arrows (pointing left and right, respectively) indicate the velocity difference between the maser features and the systemic velocity (dotted vertical line) of the galaxy.
Current usage metrics show cumulative count of Article Views (full-text article views including HTML views, PDF and ePub downloads, according to the available data) and Abstracts Views on Vision4Press platform.
Data correspond to usage on the plateform after 2015. The current usage metrics is available 48-96 hours after online publication and is updated daily on week days.
Initial download of the metrics may take a while.