Fig. 4.
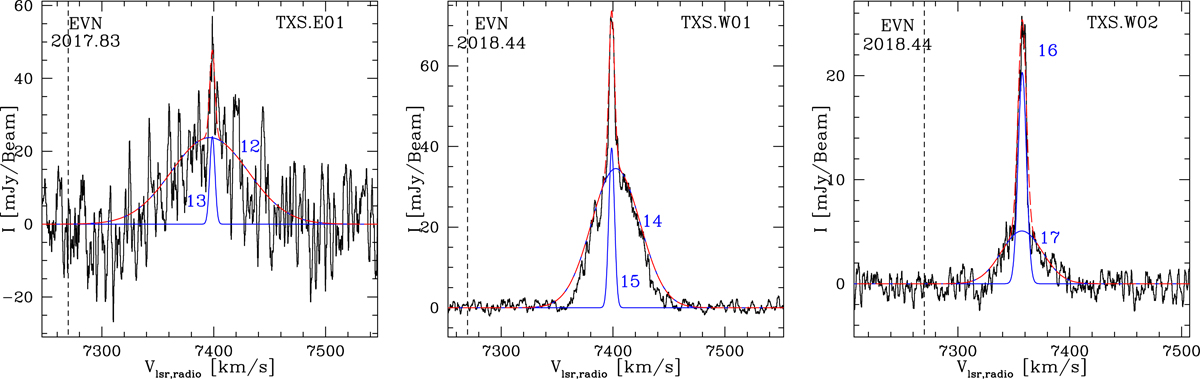
Total intensity spectra (I) of the H2O maser features detected toward TXS 2226-184 in epochs 2017.83 (first panel on the left) and 2018.44 (second and third panels) with the EVN after a boxcar smoothing of ten channels. A channel averaging was performed in epoch 2018.44 in order to have comparable spectral width between the two EVN epochs. The thick blue lines are the Gaussian fit of the different components labeled in blue (see Table 3), the dashed red line is the combination of the fit of the components of each maser feature. The dashed black line indicates the systemic velocity of the galaxy in the radio convention (i.e., 7270 km s−1).
Current usage metrics show cumulative count of Article Views (full-text article views including HTML views, PDF and ePub downloads, according to the available data) and Abstracts Views on Vision4Press platform.
Data correspond to usage on the plateform after 2015. The current usage metrics is available 48-96 hours after online publication and is updated daily on week days.
Initial download of the metrics may take a while.