| Issue |
A&A
Volume 634, February 2020
|
|
|---|---|---|
| Article Number | A26 | |
| Number of page(s) | 15 | |
| Section | Extragalactic astronomy | |
| DOI | https://doi.org/10.1051/0004-6361/201936357 | |
| Published online | 30 January 2020 | |
Properties of galaxies with an offset between the position angles of the major kinematic and photometric axes
1
Main Astronomical Observatory, National Academy of Sciences of Ukraine, 27 Akademika Zabolotnoho St, 03680 Kiev, Ukraine
e-mail: This email address is being protected from spambots. You need JavaScript enabled to view it.
2
Astronomisches Rechen-Institut, Zentrum für Astronomie der Universität Heidelberg, Mönchhofstr. 12–14, 69120 Heidelberg, Germany
3
Instituto de Astrofísica de Andalucía, CSIC, Apdo 3004, 18080 Granada, Spain
4
University of Applied Sciences of Mittelhessen, Campus Friedberg, Department of Mathematics, Natural Sciences and Data Processing, Wilhelm-Leuschner-Straße 13, 61169 Friedberg, Germany
5
Kazan Federal University, 18 Kremlyovskaya St., 420008 Kazan, Russian Federation
Received:
22
July
2019
Accepted:
3
December
2019
Abstract
We derive the photometric, kinematic, and abundance characteristics of 18 star-forming MaNGA galaxies with fairly regular velocity fields and surface brightness distributions and with a large offset between the measured position angles of the major kinematic and photometric axes, ΔPA ≳ 20°. The aim is to examine if there is any other distinctive characteristic common to these galaxies. We found morphological signs of interaction in some (in 11 out of 18) but not in all galaxies. The observed velocity fields show a large variety; the maps of the isovelocities vary from an hourglass-like appearance to a set of straight lines. The position angles of the major kinematic axes of the stellar and gas rotations are close to each other. The values of the central oxygen abundance, radial abundance gradient, and star formation rate are distributed within the intervals defined by galaxies with small (no) ΔPA of similar mass. Thus, we do not find any specific characteristic common to all galaxies with large ΔPA. Instead, the properties of these galaxies are similar to those of galaxies with small (no) ΔPA. This suggests that either the reason responsible for the large ΔPA does not influence other characteristics or the galaxies with large ΔPA do not share a common origin, they can, instead, originate through different channels.
Key words: galaxies: kinematics and dynamics / galaxies: spiral
© ESO 2020
1. Introduction
The position angle of the photometric major axis PAphot usually coincides with (or at least, is close to) the position angle of the kinematic major axis PAkin in disk galaxies. Barnes & Sellwood (2003) estimated that non-axisymmetric features, such as spirals and bars, introduce an average position angle uncertainty of ∼5°. A large offset between the photometric and kinematic position angles is believed to be caused by interactions or mergers of galaxies and, consequently, to be an indicator of such events (Barrera-Ballesteros et al. 2014, 2015; Bloom et al. 2017; Rodrigues et al. 2017). The condition that there is no mismatch between the kinematic and photometric PAs is among the criteria that serve to properly distinquish rotating discs from interacting or merging galaxies (Rodrigues et al. 2017).
Garrido et al. (2005) and Epinat et al. (2008) derived the kinematic position angles for a sample of spiral galaxies from Fabry-Perot observations obtained in the framework of GHASP (Gassendi HAlpha survey of SPirals). They compared their kinematical PAs with the photometric PAs from the HyperLeda1 database and found that the offset between the photometric and kinematic position angles, ΔPA, is observed in both isolated as well as in interacting galaxies. Barrera-Ballesteros et al. (2014, 2015) determined the offsets between the photometric and kinematic position angles for isolated and interacting or merging galaxies measured by the Calar Alto Legacy Integral Field Area (CALIFA) survey (Sánchez et al. 2012; Husemann et al. 2013; García-Benito et al. 2015). They found that ΔPA > 21° for 43% of the interacting or merging galaxies and for 10% of the isolated galaxies in their sample. Graham et al. (2018) found that for 84.5% of the MaNGA (Mapping Nearby Galaxies at Apache Point Observatory, Bundy et al. 2015) spiral galaxies the axes are aligned within 10°.
The presence of a large ΔPA in some isolated galaxies means that an interaction or merger is not the necessary condition for the phenomenon of the large ΔPA. Moreover, the lack of a large ΔPA in a fraction of interacting galaxies means that interactions are not a sufficient condition for the appearance of a large ΔPA in a galaxy, that is, it would seem that not every interaction does result in a remnant with a large ΔPA but that only certain interactions may produce such a galaxy.
Morphology, kinematics, heavy element abundances, and other properties are affected by interactions and mergers during galaxy evolution (e.g., Toomre & Toomre 1972; Veilleux et al. 2002; Rupke et al. 2010a,b; Rich et al. 2012; Larson et al. 2016). If a large offset between the photometric and kinematic position angles is induced by interactions then one can expect that other signs of the interaction can be found in those galaxies as well. We examine the photometric, kinematic, and abundance properties of 18 MaNGA galaxies with a large offset between the position angles of the major kinematic and photometric axes (ΔPA ≳ 20°) in order to ascertain whether their large ΔPA is the only peculiar property of those galaxies or whether other properties are also unusual or at least similar for all these galaxies. It should be emphasized that only galaxies with regular velocity fields (surface brightness distributions) are considered so that a unique major kinematic (photometric) axis can be defined for the object as whole.
The paper is organized in the following way. The data are described in Sect. 2. In Sect. 3 the properties of the galaxies are discussed. Section 4 contains a brief summary.
2. Target galaxies
2.1. Data
The spectroscopic measurements from the SDSS-IV MaNGA survey (Bundy et al. 2015; Albareti et al. 2017) provide the possibility to measure the surface brightness distribution and to determine optical radii and luminosities, to measure the observed gas and stellar velocity fields and to derive kinematic angles, and to measure emission line fluxes and obtain abundance maps. In our previous paper (Pilyugin et al. 2019), we derived rotation curves, surface brightness profiles, and oxygen abundance distributions for star-forming galaxies using the publicly available spectroscopy obtained by the SDSS-IV MaNGA survey. A sample of 147 galaxies with offsets between the position angles of the kinematic and photometric axes ΔPA less than ∼20° were considered to examine the relations between the abundance properties, rotation velocity, and other macroscopic properties, for example, stellar mass (Pilyugin et al. 2019).
Here we will investigate galaxies with a large offset between the position angles of the kinematic and photometric major axes. We selected a sample of MaNGA galaxies to be analyzed by considering their derived gas velocity fields, surface brightnesses, and abundance maps. We selected those galaxies using the following criteria.
– They had to be star-forming galaxies since the characteristics to be analyzed (gas velocities, abundances, star formation rate) are based on emission lines.
– Galaxies measured with a small number of fibers (19 and 37) were excluded from consideration.
We required that the surface brightness distribution and the gas velocity field are rather regular in order be able to obtain reliable values for the position angles of the kinematic and photometric major axes and to be able to establish galactocentric distances for the spaxels in the galaxy image. We also required that the spaxels with measured emission lines and surface brightness need to be distributed across the galactic disks. Under those conditions, the obtained characteristics (e.g., position angles, abundance distribution) can be interpreted as global properties, that is, they can be used to characterize the galaxy as a whole. The galaxy M-8551-09102 was measured up to a radius of 0.70 R25, the galaxy M-8454-12701 up to 0.77 R25, and the spaxels with measured emission lines cover more than ∼0.8 R25 in the other selected galaxies. It should be stressed that only those spaxel spectra where all the used lines ([O II]λ3727+λ3729, Hβ, [O III]λ5007, Hα, [N II]λ6584) were measured with a signal-to-noise ratio S/N > 3 were considered. Therefore, the spaxels with reliably measured spectra may cover less of the radial extent than the radius across which spaxel spectra are available.
We adopted the value of the offset between the position angles of the kinematic and photometric major axes ΔPA = ∼20° as demarcation value between galaxies with small and large ΔPA. Of course, the choice of the demarcation value is somewhat arbitrary. Our final list includes 18 galaxies, which are listed in Table 1.
Properties of our sample of MaNGA galaxies.
Barrera-Ballesteros et al. (2015) found that morpho-kinematic misalignments are related to a particular stage of the merger event (pre-merger, merger, post-merger, remnant). The majority of galaxies with ΔPA > 20° in their sample are classified as galaxies in the merger stage. The median ΔPA is maximum for those galaxies. The velocity field (and the surface brightness distribution) in a galaxy in the merger stage is usually complex and a unique kinematic (photometric) major axis cannot be defined for the object as whole. Such galaxies do not meet our selection criteria. Some of the galaxies of Barrera-Ballesteros et al. (2015) with a large ΔPA show rather regular velocity fields and surface brightness distributions (for example, NGC 6977 and NGC 7738). Those galaxies are classified as galaxies in pre-merger, post-merger, and remnant stages of the merger event (Barrera-Ballesteros et al. 2015). However, the number of galaxies with large misalignments in those merger stages is low; the median misalignments are below or comparable to the demarcation value adopted here. Only a few interacting galaxies of the sample from Barrera-Ballesteros et al. (2015) meet our selection criteria.
The SDSS data base provides values of the stellar masses of its target galaxies determined in different ways. We have chosen the spectroscopic Msp masses of the SDSS and BOSS galaxies (BOSS stands for the Baryon Oscillation Spectroscopic Survey in SDSS-III, see Dawson et al. 2013). The spectroscopic masses, Msp, are the median (50th percentile of the probability distribution function, PDF) of the logarithmic stellar masses from table STELLARMASSPCAWISCBC03 determined by the Wisconsin method (Chen et al. 2012) with the stellar population synthesis models from Bruzual & Charlot (2003).
2.2. Mapping the properties of our galaxies
The spectrum of each spaxel is reduced in the manner described in Zinchenko et al. (2016). Briefly, the stellar background in all spaxels is fitted using the public version of the STARLIGHT code (Cid Fernandes et al. 2005; Mateus et al. 2006; Asari et al. 2007) adapted for execution in the NorduGrid ARC2 environment of the Ukrainian National Grid. To fit the stellar spectra we used 150 synthetic simple stellar population (SSP) spectra from the evolutionary synthesis models by Bruzual & Charlot (2003) with ages from 1 Myr up to 13 Gyr and metallicities of Z = 0.0001, 0.004, 0.008, 0.02, and 0.05. We adopted the reddening law of Cardelli et al. (1989) with RV = 3.1. The resulting stellar radiation contribution was subtracted from the observed spectrum in order to measure and analyze the line emission from the gaseous component. The line intensities were measured using single Gaussian line profile fits on the pure emission spectra.
The total [O III]λλ4959,5007 flux was estimated as 1.33 × [O III]λ5007 instead of the sum of the fluxes of both lines. These lines originate from transitions from the same energy level, so their flux ratio can be determined by the transition probability ratio, which is very close to 3 (Storey & Zeippen 2000). The strongest line, [O III]λ5007, can be measured with higher precision than the weakest one. This is particularly important for high-metallicity H II regions, which have weak high-excitation emission lines. Similarly, the [N II]λλ6548,6584 lines also originate from transitions from the same energy level and the transition probability ratio for those lines is again close to 3 (Storey & Zeippen 2000). Therefore, we estimated its total flux as 1.33 [N II]λ6584. For each spectrum, we measure the fluxes of the [O II]λλ3727,3729, Hβ, [O III]λ5007, Hα, [N II]λ6584, and [S II]λ6717, 6731 lines. The emission line fluxes were corrected for interstellar reddening using the theoretical Hα/Hβ ratio and the reddening function from Cardelli et al. (1989) for RV = 3.1. We assume CHβ = 0.47AV (Lee et al. 2005).
The surface brightness in the SDSS g and r bands for each spaxel was obtained from broadband SDSS images created from the data cube. The measured magnitudes were converted to B-band magnitudes and were corrected for Galactic foreground extinction using the recalibrated AV values of Schlafly & Finkbeiner (2011) reported in the NASA/IPAC Extragalactic Database (NED)3.
The deprojected galaxy plane was divided into rings with a width of one pixel. The position angle of the major photometric axis and the galaxy inclination were assumed to be the same for all the rings, that is, constant within the disc. The pixel coordinates of the photometric center of the galaxy, the inclination angle i, the position angle of the photometric major axis, PAphot, and the observed surface-brightness profile were derived through the best fit to the measured surface-brightness map. The observed surface-brightness profile within a galaxy was fitted by a broken exponential profile for the disc and by a general Sérsic profile for the bulge (Pilyugin et al. 2018). The optical radius of the galaxy R25 was estimated using the obtained fit.
Panel a of Fig. 1 shows the obtained surface brightness distribution across the image of the MaNGA galaxy M-8454-12702 in sky coordinates (pixels). North is up and East to the left. The scale of a pixel is 0.5 arcsec. The value of the surface brightness is color-coded. The circle shows the photometric center of the galaxy, and the solid line indicates the position of the major photometric axis of the galaxy. The obtained surface brightness distributions across the images of the other galaxies of our sample and the positions of the major photometric axes are shown in Figs. A.1–A.17.
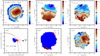 |
Fig. 1. Properties of the MaNGA galaxy M-8454-12701. Panel a: surface brightness distribution across the image of the galaxy in sky coordinates (pixels). The value of the surface brightness is color-coded. The circle shows the photometric center of the galaxy, the solid line indicates the position of the major photometric axis of the galaxy. Panel b: observed (line-of-sight) Hα velocity field in sky coordinates. The plus sign denotes the kinematic center of the galaxy determined from the Hα velocity field. The dashed line indicates the position of the major kinematic (Hα) axis of the galaxy. Panel c: observed stellar velocity field. The triangle denotes the kinematic center of the galaxy determined from the stellar velocity field, and the dotted line indicates the position of the kinematic major (stellar) axis of the galaxy. Panel d: BPT diagram. The symbols are individual spaxels. Solid and long-dashed curves mark the demarcation line between AGNs and H II regions defined by Kauffmann et al. (2003) and Kewley et al. (2001), respectively. The short-dashed line is the dividing line between Seyfert galaxies and LINERs defined by Cid Fernandes et al. (2010). The black points are AGN-like objects according to the dividing line of Kewley et al. (2001). The blue points are the H II-region-like objects according to the dividing line of Kauffmann et al. (2003). The red points are intermediate objects located between the dividing lines of Kauffmann et al. (2003) and Kewley et al. (2001). Panel e: locations of the spaxels with the AGN-like, H II-region-like, and intermediate spectra on the image of the galaxy. Panel f: abundance distribution across the image of the galaxy in sky coordinates (pixels). |
The position angles of the phometric major axes of the MaNGA galaxies based on SDSS photometry are given in the NASA-Sloan-Atlas (NSA)4. To check the validity of the position angles derived here from the MaNGA measurements we compared our values of the position angle with those from the NSA. We took the position angle of the major photometric axis from the NSA Sérsic model structural parameters, which were fit using the SDSS r-band image. Figure 2 shows the absolute value of the difference between the position angle obtained here and that from the NSA, ϵPA, as a function of the inclination angle of the galaxy. We divide our galaxies into two groups, with and without signs of interaction (see below). The ϵPA for the galaxies with interaction signatures are shown by plus signs and those for seemingly non-interacting galaxies are denoted by circles. Inspection of Fig. 2 shows that our PAphot for galaxies without signs of interaction agree with the SDSS-photometry-based values within ∼3° with the one exception of the galaxy M-8145-06103, which is a galaxy with bright spiral arms. The ϵPA for apparently interacting galaxies are larger, within ∼10° for galaxies with inclination angles i ≳ 40° and up to ∼20° for some galaxies with the inclination angles of i ≲ 30°.
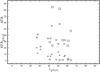 |
Fig. 2. Difference between the position angles of major photometric axis obtained here and those listed in the NASA-Sloan Atlas, ϵPAphot, as a function of the inclination angle of the galaxy for galaxies with (sign plus) and without (circles) signs of interactions. The difference between the position angles of the major photometric and kinematic axes ΔPA obtained here as a function of the inclination angle for galaxies with (crosses) and without (squares) signs of the interaction is also plotted. The absolute values of the differences are shown. |
The measurement of the emission lines provides the gas velocity of each region (spaxel). Panel b of Fig. 1 shows the color-coded observed (line-of-sight) Hα velocity field in the galaxy M-8454-12702 in sky coordinates. The pixel coordinates of the kinematic center of the galaxy, the inclination angle ikin, and the position angle of the kinematic major axis, PAkin are derived through the best fit to the measured velocity field using the standard relation between the observed line-of-sight velocities recorded on a set of pixel coordinates and the kinematic parameters (e.g., Warner et al. 1973; Begeman 1989; de Blok et al. 2008; Oh et al. 2018; Pilyugin et al. 2019). Again the deprojected galaxy plane is divided into annuli with a width of one pixel. The position angle of the major kinematic axis and the galaxy inclination are assumed to be the same for all the rings. The plus symbol in panel b of Fig. 1 shows the gas (Hα) kinematic center of the galaxy; the dashed line indicates the position of the major gas kinematic axis of the galaxy M-8454-12702.
Accurate rotation curves cannot be determined for all of our galaxies because the curves of isovelocities in the measured velocity fields in some galaxies resemble more a set of the straight lines than a set of parabola-like curves (the hourglass-like picture for the rotation disk). That prevents the determination of a reliable value of the kinematic inclination angle of a galaxy. Thus, only the position angles of the gas and stellar kinematic major axis will be considered.
Figure 2 shows the absolute value of the difference between the position angles of the major kinematic and photometric axes, ΔPA, as a function of the inclination angle of a galaxy. The ΔPA for galaxies with signs of an interaction are indicated by crosses and for galaxies without apparent interactions by squares. Inspection of Fig. 2 shows that the ΔPA exceeds significantly the ϵPA for our galaxies with the exception of the galaxy M-8486-12702, which has a small inclination angle.
The fitting of the stellar continuum allows us to estimate the stellar velocity of each spaxel. Panel c of Fig. 1 shows the color-coded observed (line-of-sight) stellar velocity field in the galaxy M-8454-12702 in sky coordinates. The triangle marks the stellar kinematic center of the galaxy. The dotted line indicates the position of the major stellar kinematic axis of the galaxy.
The standard [N II]λ6584/Hα versus [O III]λ5007/Hβ diagram (the BPT classification diagram) suggested by Baldwin et al. (1981) is used to separate different types of emission-line objects according to their main excitation mechanism (that is, starburst or AGN). Panel d of Fig. 1 shows the BPT diagram for the spaxels in the galaxy M-8454-12702. The solid curve is the dividing line suggested by Kauffmann et al. (2003), and the long-dashed curve line is that suggested by Kewley et al. (2001). The objects located in the BPT diagram left of (below) the separation curve of Kauffmann et al. (2003) (blue points) are referred to as objects with H II-region-like spectra, the objects located in the BPT diagram right from (above) the separation curve of Kewley et al. (2001) (black points) are referred to as objects with AGN-like spectra, and the objects located in the BPT diagram between those separation curves (red points) are called objects with intermediate spectra. The short-dashed line is the dividing line between Seyfert galaxies and LINERs defined by Cid Fernandes et al. (2010).
Panel e of Fig. 1 shows the locations of spaxels with AGN-like (black points), H II-region-like (blue points), and intermediate (red points) spectra in the image of the galaxy M-8454-12702.
It has been found that the three-dimensional R calibration from Pilyugin & Grebel (2016) produces reliable abundances for MaNGA galaxies, that is, the R-calibration produces abundances compatible to the Te-based abundance scale and is workable over the whole metallicity scale of H II regions (Pilyugin et al. 2018, 2019; Zinchenko et al. 2019a,b). We use those relations for abundance determinations also here. Panel f of Fig. 1 shows the oxygen abundance distribution across the image of the galaxy M-8454-12702 in sky coordinates (pixels). The value of the oxygen abundance is color-coded.
3. Properties of our sample of MaNGA galaxies
3.1. Morphological signs of an interaction or merger
The morphologies of galaxies are widely used to recognize and classify interacting or merging galaxies and the merger stages (e.g., Toomre & Toomre 1972; Veilleux et al. 2002; Barrera-Ballesteros et al. 2015; Larson et al. 2016). Morphological classification schemes for the merger stages are based on visual appearance. The membership in a close galaxy pair and/or the presence of tails, bridges, or other distortions are considered as signs of an interaction or merger (e.g., Martínez-Delgado et al. 2010; Morales et al. 2018). Those signatures can be considered as external morphological signs of an interaction or merger. Two nuclei and/or a disturbed surface brightness distribution (merger-induced fine structure such as ripples, box-like isophotes, or warped surface brightness features Schweizer & Seitzer 1992) may be considered as internal morphological signs of an interaction or merger. It should be noted that there can be ambiguities in distinguishing between close galaxy pairs and a galaxy with two nuclei due to projection effects.
We examine the images of galaxies as represented by their surface brightness distribution maps in Figs. 1 and A.1–A.17, and their surface brightness profiles in Fig. 3 in order to search for morphological signatures of interactions or mergers in our galaxies.
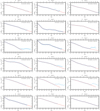 |
Fig. 3. Surface brightness profiles for our sample of MaNGA galaxies. The points denote the observed profile. The line indicates the fit by a broken exponential profile for the disc and by a general Sérsic profile for the bulge. The lower OX axis marks the fractional galactocentric distance normalized to the optical radius, Rg = R/R25. The upper OX axis shows the galactocentric distance expressed in kiloparsecs. |
The surface brightness distribution within a galaxy is fitted by a broken exponential profile for the disc and by a general Sérsic profile for the bulge following to our previous paper (Pilyugin et al. 2018). We use the surface-brightness profile in solar units for the bulge-disc decomposition. The magnitude of the Sun in the B band of the Vega photometric system, B⊙ = 5.45, was taken from Blanton & Roweis (2007). The distances were adopted from NED. The NED distances use flow corrections for Virgo, the Great Attractor, and Shapley Supercluster infall (adopting a cosmological model with H0 = 73 km s−1 Mpc−1, Ωm = 0.27, and ΩΛ = 0.73). Figure 3 shows the surface brightness profiles for our sample of the MaNGA galaxies. The points denote the observed profile. The line indicates the fit by a broken exponential profile for the disc and by a general Sérsic profile for the bulge. The lower OX axis marks the fractional galactocentric distance normalized to the optical radius, Rg = R/R25. The upper OX axis shows the galactocentric distance expressed in kiloparsecs.
Below, we list morphological signs of an interaction or merger in our selected galaxies (or the absence of such signatures).
M-8140-09101. There are no obvious morphological signs of an interaction in this galaxy. However, a faint filamentary structure can be seen in the north-west direction at a projected distance of approximately two diameters of the galaxy in the sky plane. The redshift of this structure is not available, which prevents us from estimating the real separation.
M-8145-06103. M-8145-06103 (= CGCG 148-011) is an Sbc galaxy. There are no obvious morphological signs of an interaction.
M-8146-09102. M-8146-09102 is an isolated galaxy (Argudo-Fernández et al. 2015) without obvious morphological signs of an interaction.
M-8249-06101. M-8249-06101 (=KUG 096+464) is an SBb galaxy. There are no obvious morphological signs of an interaction.
M-8252-12704. M-8252-12704 (=KUG 0940+485) is an Sb galaxy. There are no obvious morphological signs of an interaction.
M-8254-09102. The isophotes of M-8254-09102 are box-like, which is a morphological signature of an interaction.
M-8254-12703. There is a tail in the image of the galaxy, which indicates an interaction.
M-8257-12701. M-8257-12701 (=UGC 6103 = Mrk 161) is an SBc galaxy. The spot (a second nucleus) in the surface brightness distribution (as well as in the Hα and stellar velocity fields, and in the abundance distribution) can be seen in the image of M-8257-12701 toward the north from the center. This may be the projection of a close companion (the difference between the values of the line-of sight velocity of the center of the galaxy and the spot is around 70 km s−1, that is, is comparable to the variation of values of the line-of-sight velocity in M-8257-12701 due to its rotation) or it could be a second nucleus if the companion was already captured and is now located within the main galaxy. In any case, this is a morphological sign of an interaction.
M-8320-06104. M-8320-06104 (=Mrk 795) is an Sc galaxy. The optical image of M-8320-06104 is noticeably disturbed, which is a morphological indication of an interaction.
M-8329-06104. M-8329-06104 (=PGC 50739) is an SBbc galaxy and a member of the close galaxy pair UGC 9098 (PGC 50739 + PGC 50738). Thus this galaxy is likely interacting.
M-8450-06102. M-8450-06102 (=CGCG 126-052) is an Scd galaxy. There is a rise in the surface profile in the outer part of the galaxy. This may be interpreted as a sign of an interaction.
M-8451-12703. M-8451-12703 (=KUG 1053+434) is an SBc galaxy. The isophotes are box-like, which is a morphological sign of an interaction.
M-8454-12701. The Scd galaxy M-8454-12701 (= KUG 1012+444) is a member of a pair. The components of the pair are very close to each other on the sky plane, they almost overlap. Hence this galaxy can be classified as an likely interacting one.
M-8483-06103. There is a tail, which is a morphological sign of an interaction.
M-8486-12702. The inner isophotes are box-like. There is a rise in the surface brightness profile in the outer parts of the galaxy. Those are the morphological indications of an interaction.
M-8547-06102. There are no obvious morphological signs of an interaction.
M-8551-09102. There are no obvious morphological signs of an interaction.
M-8568-12703. The galaxy M-8568-12703 is a member of a galaxy pair. The components of the pair are very close to each other on the sky plane, they overlap. The north-east part of the image (X < 40 and Y > 50 pixel) is not included in the determinations of the kinematic and photometric axes. This galaxy can be classified as interacting one.
Thus, morphological signatures of an interaction are visible in 11 out of 18 galaxies of our sample. There are no obvious morphological signs of an interaction in the remaining 7 galaxies of our sample, and those galaxies are not members of close galaxy pairs. It should be noted that Hernandez-Jimenez et al. (2015) found a misaglignment of 58° between the photometric and kinematic axes in the main galaxy of a pair where the main component is 20 times more luminous than the secondary.
Simulations of interactions and mergers of galaxies were carried out in many works (Walker et al. 1996; Naab & Burkert 2003; Bournaud et al. 2004; Springel & Hernquist 2005; Robertson et al. 2006; Governato et al. 2007; Lotz et al. 2008; Hopkins et al. 2009a,b; Zinchenko et al. 2015; Rodriguez-Gomez et al. 2017, among many others). It is established that the observed properties of the interaction or merger remnants depend on the characteristics of progenitors, the geometry of the collision, and the merger stage. The properties of the merger remnant depend strongly on the mass ratio of the progenitors. Major galaxy mergers with mass ratios in the range 1:1–3:1 lead to the formation of boxy or disky elliptical galaxies, mergers with mass ratios in the intermediate range 4:1–10:1 result in peculiar galaxies with the morphology of disk galaxies but kinematics closer to that of elliptical systems, and minor mergers with mass ratios below 10:1 result in disturbed spiral galaxies.
The properties of the merger remnant are also determined by the gas fraction of the progenitors. When the gas fraction of the progenitors is low then the remnants structurally and kinematically resemble elliptical galaxies. If the progenitor galaxies are gas-rich then a prominent pre-existing disc can survive, that is, both major and minor mergers can produce a disc-dominated galaxy. Rodriguez-Gomez et al. (2017) considered the influence of mergers on the galaxy morphology using the Illustris simulation. They found that mergers play a dominant role in shaping the morphology of massive galaxies and the mergers do not seem to play any significant role in determining the morphology of galaxies with masses below ∼1011 M⊙.
To summarize, the result (remnant) of an interaction or merger is dependent on a set of parameters such as the mass ratio of progenitors, the gas fraction in the progenitors, the geometry of the collision, etc. One may expect that some specific type of interaction or merger (with a range of properties of the progenitors and/or with a range of parameters of the collision) results in a large offset between the position angles of the photometric and kinematic major axes. In our current study, we do not find any morphological signature of interactions or mergers common to all our galaxies. It should be noted that the possible disparity between the time scales on which an offset between the position angles of the photometric and kinematic major axes and any other sign of an interaction or merger can occur makes it difficult to establish the combination of the required effects of an interaction that result in a large offset between the position angles of the photometric and kinematic major axes.
3.2. Shape of the isovelocity curves
We do not find a unique shape for the isovelocity curves in our galaxies with a large ΔPA. Instead, the isovelocity curves of the measured velocity fields in some galaxies are more or less close to a set of parabolic curves (the hourglass-like picture for a rotating disc) while in other galaxies the curves of isovelocities resemble more closely straight lines.
There is no correpondence between the shape of the isovelocity curves and the presence (lack) of the signs of galaxy interactions. The hourglass-like picture of the isovelocity curves can be found in both galaxies with (for example, M-8483-06103) and without (for example, M-8146-09102) interaction signatures. Straight-line isovelocity curves can be also found in galaxies with (for example, M-8547-09102) and without (for example, M-8140-09101) signs of interactions.
3.3. Stellar versus gas rotation
Figure 4 shows the position angle of the major axis of the stellar rotation, PAstar, as a function the position angle of the major axis of the gas rotation, PAgas. Inspection of Fig. 4 and Table 1 shows that the difference between the position angles of the gas and stellar rotations is within around 10° for our galaxies, with one exception (the difference is 22° in the case of the galaxy M-8140-09101).
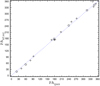 |
Fig. 4. Position angle of the major axis of the stellar rotation PAstar versus position angle of the major axis of the gas rotation PAgas for our sample of the MaNGA galaxies. The circles stand for data for galaxies without signs of an interaction, and the plus signs denote galaxies with signs of an interaction. The line represents one-to-one correspondence between these tracers of rotation. |
In general, the agreement between the position angles of the gas and stellar rotations of galaxies is not surprising. Chen et al. (2016), Jin et al. (2016) found that only 10 out of 489 blue MaNGA galaxies show misaligned gas and stellar rotation by more than 30°. Duckworth et al. (2019) found that gas and stellar rotation to be misaligned by more than 30° in only 9 out of 1005 late-type MaNGA galaxies and in 85 out of 204 early-type MaNGA galaxies. Bryant et al. (2019) measured the PAs of the stellar and gas rotation axes in a sample of galaxies from the Sydney-AAO Multi-object Integral field spectrograph (SAMI) Galaxy Survey. They found that the gas and stellar rotation are misaligned by more than 30° in 5 ± 1% in late-type galaxies but the misalignment fraction is 45 ± 6% in early-type galaxies.
Thus, our galaxies with large offset between the position angles of the major kinematic and photometric axes do not show a large offset between the position angles of the major kinematic gas and stellar axes, that is, from this point of view, their behavior is similar to the usual galaxies.
3.4. Evolution status
Many works have been devoted to the study of the star formation rate vs. stellar mass of galaxies (SFR – M) diagram during the last decade (Noeske et al. 2007; Brinchmann et al. 2004; Whitaker et al. 2014; Renzini & Peng 2015; Lin et al. 2017; Belfiore et al. 2018; Sánchez et al. 2018, among many others). It was found that majority of galaxies fall in two distinct bands in this diagram: the band of galaxies with high SFR, which was named the star-forming main sequence or simply main sequence, and the band of galaxies with low (if any) SFR, which is called red and dead, quiescent, or quenched sequence. The region between these two bands is populated by fewer galaxies, this region is usually called the green valley. The position of a galaxy in the SFR – M diagram indicates its evolutionary status.
The star-forming galaxies are located within a rather narrow band in the SFR – M diagram. The dispersion in the SFRs is ∼0.2–0.3 dex (e.g., Speagle et al. 2014; Sánchez et al. 2018). However, the differences in the mean SFR in star-forming galaxies of a given stellar mass obtained in different works can be as large as a factor of two to three depending on the adopted stellar mass and SFR diagnostics, that is, the assumed stellar initial mass function, the conversion relation for estimates of the SFR, and the correction for extinction (Speagle et al. 2014).
Is there any difference in the positions of galaxies with large ΔPA in the SFR – M diagram as compared to other star-forming galaxies? We estimate the current star formation rate from the Hα luminosity of a galaxy LHα using the calibration relation of Kennicutt (1998) reduced by Brinchmann et al. (2004) for the Kroupa initial mass function (Kroupa 2001)
 (1)
(1)
Firstly, the Hα luminosity of a galaxy LHα was determined as the sum of the Hα luminosities of the spaxels with H II-region-like spectra only. The spaxels with AGN-like and intermediate spectra (located in the BPT diagram right (above) the separation curve of Kauffmann et al. 2003) were rejected. Since the Hα flux from spaxels with AGN-like and intermediate spectra may contain a star-forming component (e.g., Belfiore et al. 2018), the SFR estimated for the Hα luminosities of spaxels with H II-region-like spectra only can be considered as a lower limit of the star formation rate, SFRll. Further, the MaNGA spectroscopic measurements do not extend to optical radius for many galaxies. In those cases, our determinations of the star formation rates are affected by this finite extent of the available data. However, the aperture corrections for MaNGA galaxies are small and not applying them has no impact on the determined star formation rates (Belfiore et al. 2018).
Panel a of Fig. 5 shows the SFRll as a function of stellar mass for MaNGA galaxies. The plus signs denote galaxies with ΔPA > 20° and with the signs of interactions considered here. The circles denote galaxies with ΔPA > 20° and without interaction signatures. The gray points mark galaxies with ΔPA < 20° from Pilyugin et al. (2019).
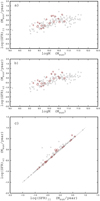 |
Fig. 5. Panel a: lower limit of the star formation rate, SFRll, as a function of stellar mass for MaNGA galaxies. The plus signs denote galaxies with ΔPA > 20° and with signs of an interaction. The circles denote galaxies with ΔPA > 20° and without signs of an interaction. The gray points mark galaxies with ΔPA < 20° from Pilyugin et al. (2019). Panel b: same as panel a but for the upper limit of the star formation rate, SFRul. Panel c: comparison between the SFRul and SFRll for those galaxies. The line is that of equal values. |
Next, the Hα luminosity of our galaxies, LHα, is determined as the sum of the Hα luminosities of all the spaxels. The SFR estimated in such a way can be considered as an upper limit of the present-day star formation rate, SFRul. Panel b of Fig. 5 shows the SFRul as a function of stellar mass for our MaNGA galaxies. Panel c of Fig. 5 shows the SFRul as a function of SFRll. Again, the plus signs denote galaxies with ΔPA > 20° and with signs of an interaction, the circles show galaxies with ΔPA > 20° and without visible interaction signatures, and the gray points mark galaxies with ΔPA < 20°.
Inspection of Fig. 5 shows that the spaxels with H II-region-like spectra provide a dominant contribution to the Hα luminosity in the bulk of the galaxies of our sample. The spaxels with AGN-like and intermediate spectra make an appreciable contribution to the Hα luminosity in massive galaxies that are AGN hosts. The positions of those galaxies in the SFR – M diagram are shifted toward the green valley. This is in agreement with results from Sánchez et al. (2018).
Examination of Fig. 5 shows that the galaxies with ΔPA > 20° are located in the same area in the SFR – M diagram as the galaxies with ΔPA < 20°, that is, the galaxies with ΔPA > 20° lie within the main sequence outlined by galaxies with ΔPA < 20°. However, galaxies with signs of an interaction show on average higher SFRs in comparison to galaxies of the same mass without interaction signatures.
3.5. Central oxygen abundance
The radial oxygen abundance distribution in a galaxy is traditionally described by a straight line of the form
 (2)
(2)
where (O/H)* ≡ 12+log(O/H)(R) is the oxygen abundance at the fractional radius Rg (normalized to the optical radius R25), (O/H) ≡ 12+log(O/H)0 is the intersect central oxygen abundance, and grad is the slope of the oxygen abundance gradient expressed in terms of dex/R25. Figure 6 shows the radial distributions of the oxygen abundances for our sample of MaNGA galaxies. The grey points indicate the oxygen abundances in individual spaxels. The solid line represents the inferred linear abundance gradient. The galactocentric distance of each spaxel was estimated using the position of the photometric major axis and the photometric inclination angle. Inspection of Fig. 6 shows that the radial abundance distribution in the majority of galaxies can be reproduced rather well by a straight line.
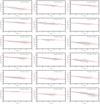 |
Fig. 6. Radial distributions of the oxygen abundances for our sample of MaNGA galaxies. The grey points indicate the oxygen abundances in individual spaxels. The solid line represents the inferred linear abundance gradient. |
Figure 7 shows the comparison of the (O/H)0 – M diagrams for galaxies with large (ΔPA ≳ 20°) and small (no) offests between the position angles of the major kinematic and photometric axes. The plus signs stand for galaxies with large ΔPA and with signs of an interaction. The circles denote the galaxies with large ΔPA and without signs of an interaction. The grey points indicate MaNGA galaxies with small (no) offests between the position angles of the major kinematic and photometric axes from Pilyugin et al. (2019). Inspection of Fig. 7 shows that the central intersect oxygen abundances in the galaxies with large and small ΔPA are located in the same area in the (O/H)0 – M diagram.
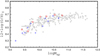 |
Fig. 7. Central intersect oxygen abundance as a function of spectroscopic mass of a galaxy. The galaxies with a large offest between the position angles of the major kinematic and photometric axes (ΔPA > 20°) are shown by plus signs (for galaxies with signs of interactionis) and by circles (for seemingly non-interacting galaxies). The grey points denote MaNGA galaxies with ΔPA < 20° from Pilyugin et al. (2019). |
We estimate the depletion in the oxygen abundance at the center of a galaxy in the following way. The radial oxygen abundance gradient is determined based on the spaxels with galactocentric distances from 0.2 Rg to 0.8 Rg. This excludes the influence of possible depletions (enhancements) in the oxygen abundance at the center and at the periphery of the galaxy on the obtained radial abundance gradient and on the central intersect value of the oxygen abundance (O/H)0. The local central oxygen abundance (O/H)C is estimated as the average value of the oxygen abundances in spaxels with galactocentric distances within 0.1 Rg. The depletion (enhancement) of the central oxygen abundance Δ(O/H)0 is defined as difference between the local and intersect central oxygen abundances Δ(O/H)0 = log(O/H)C–log(O/H)0.
Panel a of Fig. 8 shows the value of the depletion (enhancement) of the central oxygen abundance Δ(O/H)0 as a function of the absolute value of the offset between the kinematic and photometric major axes ΔPA = |PAkin–PAphot|. The circles mark galaxies with ΔPA ≳ 20° and without signs of an interaction. The plus signs denote galaxies with ΔPA ≳ 20° and with interaction signatures. The crosses are MaNGA galaxies with small offsets between the kinematic and photometric position angles (ΔPA ≲ 20°) from Pilyugin et al. (2019). Panel b of Fig. 8 shows the Δ(O/H)0 as a function of the stellar mass. Panel c of Fig. 8 shows histograms of Δ(O/H)0 for galaxies with ΔPA < 20° (solid line) and for galaxies with ΔPA > 20° (dashed line). Inspection of Fig. 8 shows that the depletion (enhancement) of the central oxygen abundance is within 0.05 dex for the majority of galaxies with both large and small offests between the kinematic and photometric position angles.
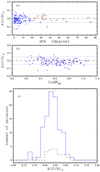 |
Fig. 8. Value of depletion (enhancement) of the central oxygen abundance Δ(O/H)0 (the difference between the mean value of the oxygen abundances 12+log(O/H) in spaxels with galactocentric distances within 0.1 R25 and the value of the central intersect oxygen abundance estimated from the radial abundance gradient based on spaxels with galactocentric distances within 0.2–0.8 R25) as a function of ΔPA (panel a) and as a function of stellar mass of the galaxy (panel b). The circles represent data for galaxies with large ΔPA and without signs of ah interaction while the plus signs show galaxies with large ΔPA and with signs of an interaction. The crosses denote galaxies with small (no) ΔPA from Pilyugin et al. (2019). The dashed line marks a ΔPA of zero, and the dotted lines show the ±0.05 values. Panel c: histograms of Δ(O/H)0 for galaxies with ΔPA < 20° (solid line) and for galaxies with ΔPA > 20° (dashed line). |
Examination of panel c of Fig. 8 shows that there is a systematic depletion by ∼0.02 dex in the local central oxygen abundances in our sample of MaNGA galaxies. This small systematic depletion in the local central oxygen abundances can be false. Belfiore et al. (2017) have examined the influence of the point spread function (PSF) of the MaNGA measurements on oxygen abundance determinations. They found that the influence of the PSF on the obtained value of the oxygen abundance is maximum at the center of the galaxy in the sense that the obtained oxygen abundance may be underestimated by about 0.04 dex or less depending on the value of the inclination angle and the ratio between the effective raius of the galaxy and the full width at the half maximum of the PSF. The value of the systematic depletion of ∼0.02 dex in the local central oxygen abundances in our sample of MaNGA galaxies is well within the predictions by Belfiore et al. (2017). If this depletion is real then this suggests that there is a low-rate gas infall into the centers of those spiral galaxies.
3.6. Radial abundance gradient
Numerical simulations predict that gas flows induced by interactions redistribute gas in such a manner that the radial abundance gradients in the galactic disks flatten during the interacting or merger (e.g., Rupke et al. 2010a,b; Rich et al. 2012; Bustamante et al. 2018).
Figure 6 shows the radial distributions of the oxygen abundances for our sample of MaNGA galaxies. Figure 9 shows the radial abundance gradient in the galaxies as a function of their spectroscopic mass. The circles stand for galaxies with ΔPA ≳ 20° and without signs of an interaction. The plus signs denote galaxies with ΔPA ≳ 20° and with interaction signatures. The grey points are individual MaNGA galaxies with small (no) offests between the kinematic and photometric position angles (ΔPA ≲ 20°) from Pilyugin et al. (2019).
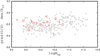 |
Fig. 9. Radial oxygen abundance gradient in units of dex/R25 in the discs of our galaxies as a function of their spectroscopic mass. The galaxies with ΔPA > 20° are shown by circles (galaxies without signs of an interaction) and by plus signs (galaxies with signs of an interaction). The grey points are galaxies with ΔPA < 20° from Pilyugin et al. (2019). |
Examination of Fig. 9 shows that the galaxies with large ΔPA lie within the area outlined by the galaxies with small ΔPA.
3.7. Discussion
The position angle of the major photometric axis and other photometric characteristics of a galaxy are defined by the spatial orientation of the galaxy and by the distribution of the positions of the stars and gas within the galaxy. Similarly, the position angle of the major kinematic axis and other kinematic characteristics of a galaxy are defined by the spatial orientation of the galaxy and by the distribution of the velocities of the stars (and gas) within the galaxy. Since the stellar and gas velocity fields in our sample of galaxies are close to each other (see above) and since the precision of the measurements of gas velocities is higher than that for stars, we consider the gas velocies below. One can say that the large offset between the position angles of the photometric and kinematic major axes demonstrates that the measured distributions of positions and velocities of the stellar component are in conflict to each other, that is, this unusual property is common to all those galaxies.
However, other properties of our sample of galaxies with large ΔPA are rather usual. There is no other characteristic that is common for all those galaxies, that is, there is no parameter that has a similar value for all those galaxies and can serve as an additional indicator of galaxies with large ΔPA. This suggests that either the reason responsible for the large ΔPA does not influence other characteristics of a galaxy or that the galaxies with large ΔP are not uniform in their origin; instead they may have different evolutionary pathways.
It is interesting to note that there is a possibility that large ΔPA can be observed in a galaxy even if the real distribution of positions and velocities of stars within that galaxy are in agreement with each other but the observed line-of-sight velocity field is distorted. One may assume that the observed line-of-sight velocity field of a galaxy with a large ΔPA is a composition of two velocity fields (two components of the galaxy motion). The first component of the galaxy motion is the usual disk rotation where the major kinematic axis coincides with the major photometric axis. The second component of the galaxy motion is a rotation of the galaxy as a whole around some axis that does not coincide with the disc rotation axis. This concept can explain the observed offsets between the measured position angles of the photometric and kinematic major axes in galaxies.
4. Conclusions
We derive the photometric, kinematic, and abundance properties of 18 star-forming MaNGA galaxies with fairly regular velocity fields and surface brightness distributions and with a large offset between the measured position angles of the major kinematic and photometric axes, ΔPA ≳ 20°. We aim to examine if there is any other distinctive characteristic common to all these galaxies. We found the following properties for those galaxies.
-
Morphological signs of interactions or mergers can be found in some (in 11 out of 18) but not in all galaxies with large ΔPA.
-
There is no unique shape for the isovelocity curves in the galaxies with large ΔPA. The isovelocity curves in the measured velocity fields in some galaxies are close to parabolic curves (that is, the hourglass-like picture for a rotating disk), while in other galaxies the isovelocity curves closely resemble straight lines. There is no correpondence between the shape of the isovelocity curves and the presence (lack) of interaction signatures in a galaxy. The hourglass-like picture of the isovelocity curves can be found both in galaxies with and without signs of an interaction. The isovelocities of the straight line shape can be also found both in galaxies with and without signs of an interaction.
-
The position angle of the gas rotation coincides with (or at least is close to) the position angle of the stellar rotation.
-
The positions of the galaxies with a large ΔPA in the star formation rate versus stellar mass diagram show that those galaxies belong to the main sequence of the star-forming galaxies. However, galaxies with signs of an interaction show an on average higher SFR in comparison to the galaxies of the same mass without signs of an interaction.
-
The oxygen abundances (and, consequently, astration levels) are rather similar for our samples of galaxies with large and small (no) ΔPA in the sense that the locations of the galaxies with a large ΔPA in the central oxygen abundance versus stellar mass diagram are within (and distributed across the whole) area outlined by the galaxies with small ΔPA. The positions of the galaxies with a large ΔPA in the radial abundance gradient versus stellar mass diagram are also within the area outlined by the galaxies with small ΔPA.
Thus, there is not any distinctive characteristic common to all the galaxies with large ΔPA; the considered properties of the galaxies with a large ΔPA are rather similar to those of galaxies with small (no) ΔPA. This suggests that either the reason responsible for the large ΔPA does not influence those properties of a galaxy or the galaxies with a large ΔPA are not uniform in their origin, they can, instead, originate from different evolutionary pathways.
The NASA/IPAC Extragalactic Database (NED) is operated by the Jet Populsion Laboratory, California Institute of Technology, under contract with the National Aeronautics and Space Administration. http://ned.ipac.caltech.edu/
Acknowledgments
We are grateful to the referee for his/her constructive comments. L. S. P., E. K. G., and I. A. Z. acknowledge support within the framework of Sonderforschungsbereich (SFB 881) on “The Milky Way System” (especially subproject A5), which is funded by the German Research Foundation (DFG). L. S. P. and I. A. Z. thank for hospitality of the Astronomisches Rechen-Institut at Heidelberg University, where part of this investigation was carried out. L. S. P. acknowledges financial support from the State Agency for Research of the Spanish MCIU through the “Center of Excellence Severo Ochoa” award to the Instituto de Astrofísica de Andalucía (SEV-2017-0709). I. A. Z. acknowledges the support from the National Academy of Sciences of Ukraine by the project 417Kt. L.S.P acknowledges support within the framework of the program of the NAS of Ukraine “Support for the development of priority fields of scientific research” (CPCEL 6541230). J. M. V. acknowledges financial support from projects AYA2017-79724-C4-4-P, of the Spanish PNAYA, and Junta de Andalucia Excellence PEX2011-FQM705. This work was partly funded by the subsidy allocated to Kazan Federal University for the state assignment in the sphere of scientific activities (L. S. P.). We acknowledge the usage of the HyperLeda database (http://leda.univ-lyon1.fr). Funding for SDSS-III has been provided by the Alfred P. Sloan Foundation, the Participating Institutions, the National Science Foundation, and the US Department of Energy Office of Science. The SDSS-III web site is http://www.sdss3.org/. Funding for the Sloan Digital Sky Survey IV has been provided by the Alfred P. Sloan Foundation, the US Department of Energy Office of Science, and the Participating Institutions. SDSS-IV acknowledges support and resources from the Center for High-Performance Computing at the University of Utah. The SDSS web site is www.sdss.org. SDSS-IV is managed by the Astrophysical Research Consortium for the Participating Institutions of the SDSS Collaboration including the Brazilian Participation Group, the Carnegie Institution for Science, Carnegie Mellon University, the Chilean Participation Group, the French Participation Group, Harvard-Smithsonian Center for Astrophysics, Instituto de Astrofísica de Canarias, The Johns Hopkins University, Kavli Institute for the Physics and Mathematics of the Universe (IPMU)/University of Tokyo, Lawrence Berkeley National Laboratory, Leibniz Institut für Astrophysik Potsdam (AIP), Max-Planck-Institut für Astronomie (MPIA Heidelberg), Max-Planck-Institut für Astrophysik (MPA Garching), Max-Planck-Institut für Extraterrestrische Physik (MPE), National Astronomical Observatories of China, New Mexico State University, New York University, University of Notre Dame, Observatário Nacional/MCTI, The Ohio State University, Pennsylvania State University, Shanghai Astronomical Observatory, United Kingdom Participation Group, Universidad Nacional Autónoma de México, University of Arizona, University of Colorado Boulder, University of Oxford, University of Portsmouth, University of Utah, University of Virginia, University of Washington, University of Wisconsin, Vanderbilt University, and Yale University.
References
- Albareti, F. D., Allende, Prieto C., Almeida, A., et al. 2017, ApJS, 233, 25 [NASA ADS] [CrossRef] [Google Scholar]
- Argudo-Fernández, M., Verley, S., Bergond, G., et al. 2015, A&A, 578, A110 [NASA ADS] [CrossRef] [EDP Sciences] [Google Scholar]
- Asari, N. V., Cid, Fernandes R., Stasińska, G., et al. 2007, MNRAS, 381, 263 [NASA ADS] [CrossRef] [MathSciNet] [Google Scholar]
- Baldwin, J. A., Phillips, M. M., & Terlevich, R. 1981, PASP, 93, 5 [NASA ADS] [CrossRef] [EDP Sciences] [Google Scholar]
- Barnes, E. I., & Sellwood, J. A. 2003, AJ, 125, 1164 [NASA ADS] [CrossRef] [Google Scholar]
- Barrera-Ballesteros, J. K., Falcón-Barroso, J., García-Lorenzo, B., et al. 2014, A&A, 568, A70 [NASA ADS] [CrossRef] [EDP Sciences] [Google Scholar]
- Barrera-Ballesteros, J. K., García-Lorenzo, B., Falcón-Barroso, J., et al. 2015, A&A, 582, A21 [NASA ADS] [CrossRef] [EDP Sciences] [Google Scholar]
- Begeman, K. G. 1989, A&A, 223, 47 [NASA ADS] [Google Scholar]
- Belfiore, F., Maiolino, R., Tremonti, C., et al. 2017, MNRAS, 469, 151 [NASA ADS] [CrossRef] [Google Scholar]
- Belfiore, F., Maiolino, R., Bundy, K., et al. 2018, MNRAS, 477, 3014 [NASA ADS] [CrossRef] [Google Scholar]
- Blanton, M. R., & Roweis, S. 2007, AJ, 133, 734 [NASA ADS] [CrossRef] [Google Scholar]
- Bloom, J. V., Croom, S. M., Bryant, J. J., et al. 2017, MNRAS, 472, 1809 [NASA ADS] [CrossRef] [Google Scholar]
- Bournaud, F., Combes, F., & Jog, C. J. 2004, A&A, 418, L27 [NASA ADS] [CrossRef] [EDP Sciences] [Google Scholar]
- Brinchmann, J., Charlot, S., White, S. D. M., et al. 2004, MNRAS, 351, 1151 [NASA ADS] [CrossRef] [Google Scholar]
- Bruzual, G., & Charlot, S. 2003, MNRAS, 344, 1000 [NASA ADS] [CrossRef] [Google Scholar]
- Bryant, J. J., Croom, S. M., van de Sande, J., et al. 2019, MNRAS, 483, 458 [NASA ADS] [CrossRef] [Google Scholar]
- Bundy, K., Bershady, M. A., Law, D. R., et al. 2015, ApJ, 798, 7 [NASA ADS] [CrossRef] [Google Scholar]
- Bustamante, S., Sparre, M., Springel, V., & Grand, R. J. J. 2018, MNRAS, 479, 3381 [NASA ADS] [CrossRef] [Google Scholar]
- Cardelli, J. A., Clayton, G. C., & Mathis, J. S. 1989, ApJ, 345, 245 [NASA ADS] [CrossRef] [Google Scholar]
- Chen, Y.-M., Kauffmann, G., Tremonti, C. A., et al. 2012, MNRAS, 421, 314 [NASA ADS] [Google Scholar]
- Chen, Y.-M., Shi, Y., Tremonti, C. A., et al. 2016, Nat. Commun., 7, 13269 [NASA ADS] [CrossRef] [Google Scholar]
- Cid Fernandes, R., Mateus, A., Sodré, L., Stasińska, G., & Gomes, J. M. 2005, MNRAS, 358, 363 [NASA ADS] [CrossRef] [Google Scholar]
- Cid Fernandes, R., Stasińska, G., Schlickmann, M. S., et al. 2010, MNRAS, 403, 1036 [NASA ADS] [CrossRef] [Google Scholar]
- Dawson, K. S., Schlegel, D. J., Ahn, C. P., et al. 2013, AJ, 145, 10 [Google Scholar]
- de Blok, W. J. G., Walter, F., Brinks, E., et al. 2008, AJ, 136, 2648 [NASA ADS] [CrossRef] [Google Scholar]
- Duckworth, C., Tojeiro, R., Kraljic, K., et al. 2019, MNRAS, 483, 172 [NASA ADS] [CrossRef] [Google Scholar]
- Epinat, B., Amram, P., Marcelin, M., et al. 2008, MNRAS, 388, 500 [NASA ADS] [CrossRef] [Google Scholar]
- García-Benito, R., Zibetti, S., Sánchez, S. F., et al. 2015, A&A, 576, A135 [NASA ADS] [CrossRef] [EDP Sciences] [Google Scholar]
- Garrido, O., Marcelin, M., Amram, P., et al. 2005, MNRAS, 362, 127 [NASA ADS] [CrossRef] [Google Scholar]
- Governato, F., Willman, B., Mayer, L., et al. 2007, MNRAS, 374, 1479 [NASA ADS] [CrossRef] [Google Scholar]
- Graham, M. T., Cappellari, M., Li, H., et al. 2018, MNRAS, 477, 4711 [NASA ADS] [CrossRef] [Google Scholar]
- Hernandez-Jimenez, J. A., Pastoriza, M. G., Bonatto, C., et al. 2015, MNRAS, 451, 2278 [NASA ADS] [CrossRef] [Google Scholar]
- Hopkins, P. F., Cox, T. J., Younger, J. D., & Hernquist, L. 2009a, ApJ, 691, 1168 [Google Scholar]
- Hopkins, P. F., Somerville, R. S., Cox, T. J., et al. 2009b, MNRAS, 397, 802 [NASA ADS] [CrossRef] [Google Scholar]
- Husemann, B., Jahnke, K., Sánchez, S. F., et al. 2013, A&A, 549, A87 [NASA ADS] [CrossRef] [EDP Sciences] [Google Scholar]
- Jin, Y., Chen, Y., Shi, Y., et al. 2016, MNRAS, 463, 913 [NASA ADS] [CrossRef] [Google Scholar]
- Kauffmann, G., Heckman, T. M., Tremonti, C., et al. 2003, MNRAS, 346, 1055 [Google Scholar]
- Kennicutt, R. C. 1998, ARA&A, 36, 189 [Google Scholar]
- Kewley, L. J., Dopita, M. A., Sutherland, R. S., Heisler, C. A., & Trevena, J. 2001, ApJ, 556, 121 [Google Scholar]
- Kroupa, P. 2001, MNRAS, 322, 231 [NASA ADS] [CrossRef] [Google Scholar]
- Larson, K. L., Sanders, D. B., Barnes, J. E., et al. 2016, ApJ, 825, 128 [NASA ADS] [CrossRef] [Google Scholar]
- Lee, H., Skillman, E. D., & Venn, K. A. 2005, ApJ, 620, 223 [NASA ADS] [CrossRef] [Google Scholar]
- Lin, L., Belfiore, F., Pan, H.-A., et al. 2017, ApJ, 851, 18 [NASA ADS] [CrossRef] [Google Scholar]
- Lotz, J. M., Jonsson, P., Cox, T. J., & Primack, J. R. 2008, MNRAS, 391, 1137 [NASA ADS] [CrossRef] [Google Scholar]
- Martínez-Delgado, D., Gabany, R. J., Crawford, K., et al. 2010, AJ, 140, 962 [NASA ADS] [CrossRef] [Google Scholar]
- Mateus, A., Sodré, L., Cid, Fernandes R., et al. 2006, MNRAS, 370, 721 [NASA ADS] [CrossRef] [Google Scholar]
- Morales, G., Martínez-Delgado, D., Grebel, E. K., et al. 2018, A&A, 614, A143 [NASA ADS] [CrossRef] [EDP Sciences] [Google Scholar]
- Naab, T., & Burkert, A. 2003, ApJ, 597, 893 [NASA ADS] [CrossRef] [Google Scholar]
- Noeske, K. G., Weiner, B. J., & Faber, S. M. 2007, ApJ, 660, L43 [Google Scholar]
- Oh, S.-H., Staveley-Smith, L., Spekkens, K., Kamphuis, P., & Koribalski, B. S. 2018, MNRAS, 473, 3256 [NASA ADS] [CrossRef] [Google Scholar]
- Pilyugin, L. S., & Grebel, E. K. 2016, MNRAS, 457, 3678 [NASA ADS] [CrossRef] [Google Scholar]
- Pilyugin, L. S., Grebel, E. K., Zinchenko, I. A., et al. 2018, A&A, 613, A1 [NASA ADS] [CrossRef] [EDP Sciences] [Google Scholar]
- Pilyugin, L. S., Grebel, E. K., Zinchenko, I. A., Nefedyev, Y. A., & Vílchez, J. M. 2019, A&A, 623, A122 [NASA ADS] [CrossRef] [EDP Sciences] [Google Scholar]
- Renzini, A., & Peng, Y.-J. 2015, ApJ, 801, L29 [NASA ADS] [CrossRef] [Google Scholar]
- Rich, J. A., Torrey, P., Kewley, L. J., Dopita, M. A., & Rupke, D. S. N. 2012, ApJ, 753, 5 [NASA ADS] [CrossRef] [Google Scholar]
- Robertson, B., Bullock, J. S., Cox, T. J., et al. 2006, ApJ, 645, 986 [NASA ADS] [CrossRef] [Google Scholar]
- Rodrigues, M., Hammer, F., Flores, H., Puech, M., & Athanassoula, E. 2017, MNRAS, 465, 1157 [NASA ADS] [CrossRef] [Google Scholar]
- Rodriguez-Gomez, V., Sales, L. V., Genel, S., et al. 2017, MNRAS, 467, 3083 [NASA ADS] [CrossRef] [Google Scholar]
- Rupke, D. S. N., Kewley, L. J., & Barnes, J. E. 2010a, ApJ, 710, L156 [NASA ADS] [CrossRef] [Google Scholar]
- Rupke, D. S. N., Kewley, L. J., & Chien, L.-H. 2010b, ApJ, 723, 1255 [NASA ADS] [CrossRef] [Google Scholar]
- Sánchez, S. F., Kennicutt, R. C., Gil de Paz, A., et al. 2012, A&A, 538, A8 [NASA ADS] [CrossRef] [EDP Sciences] [Google Scholar]
- Sánchez, S. F., Avila-Reese, V., Hernandez-Toledo, H., et al. 2018, Rev. Mex. Astron. Astrofis., 54, 217 [Google Scholar]
- Schlafly, E. F., & Finkbeiner, D. P. 2011, ApJ, 737, 103 [NASA ADS] [CrossRef] [Google Scholar]
- Schweizer, F., & Seitzer, P. 1992, AJ, 104, 1039 [NASA ADS] [CrossRef] [Google Scholar]
- Speagle, J. S., Steinhardt, C. L., Capak, P. L., & Silverman, J. D. 2014, ApJS, 214, 15 [NASA ADS] [CrossRef] [Google Scholar]
- Springel, V., & Hernquist, L. 2005, ApJ, 622, L9 [NASA ADS] [CrossRef] [Google Scholar]
- Storey, P. J., & Zeippen, C. J. 2000, MNRAS, 312, 813 [Google Scholar]
- Toomre, A., & Toomre, J. 1972, ApJ, 178, 623 [NASA ADS] [CrossRef] [Google Scholar]
- Veilleux, S., Kim, D.-C., & Sanders, D. B. 2002, ApJS, 143, 315 [NASA ADS] [CrossRef] [Google Scholar]
- Walker, I. R., Mihos, J. C., & Hernquist, L. 1996, ApJ, 460, 121 [NASA ADS] [CrossRef] [Google Scholar]
- Warner, P. J., Wright, M. C. H., & Baldwin, J. E. 1973, MNRAS, 163, 163 [NASA ADS] [Google Scholar]
- Whitaker, K. E., Franx, M., & Leja, J. 2014, ApJ, 795, 104 [NASA ADS] [CrossRef] [MathSciNet] [Google Scholar]
- Zinchenko, I. A., Berczik, P., Grebel, E. K., Pilyugin, L. S., & Just, A. 2015, ApJ, 806, 267 [NASA ADS] [CrossRef] [Google Scholar]
- Zinchenko, I. A., Pilyugin, L. S., Grebel, E. K., Sánchez, S. F., & Vílchez, J. M. 2016, MNRAS, 462, 2715 [NASA ADS] [CrossRef] [Google Scholar]
- Zinchenko, I. A., Just, A., Pilyugin, L. S., & Lara-Lopez, M. A. 2019a, A&A, 623, A7 [NASA ADS] [CrossRef] [EDP Sciences] [Google Scholar]
- Zinchenko, I. A., Dors, O. L., Hägele, G. F., Cardaci, M. V., & Krabbe, A. C. 2019b, MNRAS, 483, 1901 [NASA ADS] [CrossRef] [Google Scholar]
Appendix A: Maps of the inferred properties of our galaxies
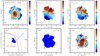 |
Fig. A.1. Inferred properties of the MaNGA galaxy M-8140-09101. |
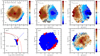 |
Fig. A.2. Inferred properties of the MaNGA galaxy M-8145-06103. |
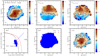 |
Fig. A.3. Inferred properties of the MaNGA galaxy M-8146-09102. |
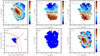 |
Fig. A.4. Inferred properties of the MaNGA galaxy M-8249-06101. |
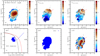 |
Fig. A.5. Inferred properties of the MaNGA galaxy M-8252-12704. |
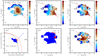 |
Fig. A.6. Inferred properties of the MaNGA galaxy M-8254-09102. |
The figures in this section show the inferred properties of our MaNGA galaxies. In each figure, panel a shows the surface brightness distribution across the image of the galaxy in sky coordinates (pixels). North is up and east is left. The pixel scale is 0.5 arcsec. The value of the surface brightness is color-coded. The circle shows the photometric center of the galaxy. The solid line indicates the position of the major photometric axis of the galaxy. The plus sign denotes the kinematic center of the galaxy determined from the Hα velocity field. The dashed line indicates the position of the major kinematic (Hα) axis of the galaxy. Panel b shows the color-coded observed (line of sight) Hα velocity field of a given galaxy in sky coordinates. Panel c shows the color-coded observed stellar velocity field. Panel d shows the BPT diagram. The symbols are individual spaxels. Solid and long-dashed curves mark the demarcation line between AGNs and H II regions defined by Kauffmann et al. (2003) and Kewley et al. (2001), respectively. The short-dashed line is the dividing line between Seyfert galaxies and LINERs defined by Cid Fernandes et al. (2010). The black points are AGN-like objects according to the dividing line of Kewley et al. (2001). The blue points are H II-region-like objects according to the dividing line of Kauffmann et al. (2003). The red points are intermediate objects located between the dividing lines of Kauffmann et al. (2003) and Kewley et al. (2001). Panel e shows the locations of the AGN-like, H II-region-like, and intermediate spaxels in the image of the galaxy. Panel f is a plot of the oxygen abundance distribution across the image of the galaxy in sky coordinates (pixels). The value of the oxygen abundance is color-coded.
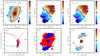 |
Fig. A.7. Inferred properties of the MaNGA galaxy M-8254-12703. |
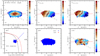 |
Fig. A.8. Inferred properties of the MaNGA galaxy M-8257-12701. |
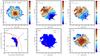 |
Fig. A.9. Inferred properties of the MaNGA galaxy M-8320-06104. |
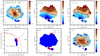 |
Fig. A.10. Inferred properties of the MaNGA galaxy M-8329-06104. |
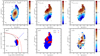 |
Fig. A.11. Inferred properties of the MaNGA galaxy M-8450-06102. |
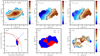 |
Fig. A.12. Inferred properties of the MaNGA galaxy M-8451-12703. |
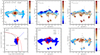 |
Fig. A.13. Inferred properties of the MaNGA galaxy M-8483-06103. |
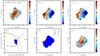 |
Fig. A.14. Inferred properties of the MaNGA galaxy M-8486-12702. |
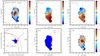 |
Fig. A.15. Inferred properties of the MaNGA galaxy M-8547-06102. |
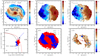 |
Fig. A.16. Inferred properties of the MaNGA galaxy M-8551-09102. |
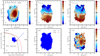 |
Fig. A.17. Inferred properties of the MaNGA galaxy M-8568-12703. |
All Tables
All Figures
|
Fig. 1. Properties of the MaNGA galaxy M-8454-12701. Panel a: surface brightness distribution across the image of the galaxy in sky coordinates (pixels). The value of the surface brightness is color-coded. The circle shows the photometric center of the galaxy, the solid line indicates the position of the major photometric axis of the galaxy. Panel b: observed (line-of-sight) Hα velocity field in sky coordinates. The plus sign denotes the kinematic center of the galaxy determined from the Hα velocity field. The dashed line indicates the position of the major kinematic (Hα) axis of the galaxy. Panel c: observed stellar velocity field. The triangle denotes the kinematic center of the galaxy determined from the stellar velocity field, and the dotted line indicates the position of the kinematic major (stellar) axis of the galaxy. Panel d: BPT diagram. The symbols are individual spaxels. Solid and long-dashed curves mark the demarcation line between AGNs and H II regions defined by Kauffmann et al. (2003) and Kewley et al. (2001), respectively. The short-dashed line is the dividing line between Seyfert galaxies and LINERs defined by Cid Fernandes et al. (2010). The black points are AGN-like objects according to the dividing line of Kewley et al. (2001). The blue points are the H II-region-like objects according to the dividing line of Kauffmann et al. (2003). The red points are intermediate objects located between the dividing lines of Kauffmann et al. (2003) and Kewley et al. (2001). Panel e: locations of the spaxels with the AGN-like, H II-region-like, and intermediate spectra on the image of the galaxy. Panel f: abundance distribution across the image of the galaxy in sky coordinates (pixels). |
| In the text | |
|
Fig. 2. Difference between the position angles of major photometric axis obtained here and those listed in the NASA-Sloan Atlas, ϵPAphot, as a function of the inclination angle of the galaxy for galaxies with (sign plus) and without (circles) signs of interactions. The difference between the position angles of the major photometric and kinematic axes ΔPA obtained here as a function of the inclination angle for galaxies with (crosses) and without (squares) signs of the interaction is also plotted. The absolute values of the differences are shown. |
| In the text | |
|
Fig. 3. Surface brightness profiles for our sample of MaNGA galaxies. The points denote the observed profile. The line indicates the fit by a broken exponential profile for the disc and by a general Sérsic profile for the bulge. The lower OX axis marks the fractional galactocentric distance normalized to the optical radius, Rg = R/R25. The upper OX axis shows the galactocentric distance expressed in kiloparsecs. |
| In the text | |
|
Fig. 4. Position angle of the major axis of the stellar rotation PAstar versus position angle of the major axis of the gas rotation PAgas for our sample of the MaNGA galaxies. The circles stand for data for galaxies without signs of an interaction, and the plus signs denote galaxies with signs of an interaction. The line represents one-to-one correspondence between these tracers of rotation. |
| In the text | |
|
Fig. 5. Panel a: lower limit of the star formation rate, SFRll, as a function of stellar mass for MaNGA galaxies. The plus signs denote galaxies with ΔPA > 20° and with signs of an interaction. The circles denote galaxies with ΔPA > 20° and without signs of an interaction. The gray points mark galaxies with ΔPA < 20° from Pilyugin et al. (2019). Panel b: same as panel a but for the upper limit of the star formation rate, SFRul. Panel c: comparison between the SFRul and SFRll for those galaxies. The line is that of equal values. |
| In the text | |
|
Fig. 6. Radial distributions of the oxygen abundances for our sample of MaNGA galaxies. The grey points indicate the oxygen abundances in individual spaxels. The solid line represents the inferred linear abundance gradient. |
| In the text | |
|
Fig. 7. Central intersect oxygen abundance as a function of spectroscopic mass of a galaxy. The galaxies with a large offest between the position angles of the major kinematic and photometric axes (ΔPA > 20°) are shown by plus signs (for galaxies with signs of interactionis) and by circles (for seemingly non-interacting galaxies). The grey points denote MaNGA galaxies with ΔPA < 20° from Pilyugin et al. (2019). |
| In the text | |
|
Fig. 8. Value of depletion (enhancement) of the central oxygen abundance Δ(O/H)0 (the difference between the mean value of the oxygen abundances 12+log(O/H) in spaxels with galactocentric distances within 0.1 R25 and the value of the central intersect oxygen abundance estimated from the radial abundance gradient based on spaxels with galactocentric distances within 0.2–0.8 R25) as a function of ΔPA (panel a) and as a function of stellar mass of the galaxy (panel b). The circles represent data for galaxies with large ΔPA and without signs of ah interaction while the plus signs show galaxies with large ΔPA and with signs of an interaction. The crosses denote galaxies with small (no) ΔPA from Pilyugin et al. (2019). The dashed line marks a ΔPA of zero, and the dotted lines show the ±0.05 values. Panel c: histograms of Δ(O/H)0 for galaxies with ΔPA < 20° (solid line) and for galaxies with ΔPA > 20° (dashed line). |
| In the text | |
|
Fig. 9. Radial oxygen abundance gradient in units of dex/R25 in the discs of our galaxies as a function of their spectroscopic mass. The galaxies with ΔPA > 20° are shown by circles (galaxies without signs of an interaction) and by plus signs (galaxies with signs of an interaction). The grey points are galaxies with ΔPA < 20° from Pilyugin et al. (2019). |
| In the text | |
|
Fig. A.1. Inferred properties of the MaNGA galaxy M-8140-09101. |
| In the text | |
|
Fig. A.2. Inferred properties of the MaNGA galaxy M-8145-06103. |
| In the text | |
|
Fig. A.3. Inferred properties of the MaNGA galaxy M-8146-09102. |
| In the text | |
|
Fig. A.4. Inferred properties of the MaNGA galaxy M-8249-06101. |
| In the text | |
|
Fig. A.5. Inferred properties of the MaNGA galaxy M-8252-12704. |
| In the text | |
|
Fig. A.6. Inferred properties of the MaNGA galaxy M-8254-09102. |
| In the text | |
|
Fig. A.7. Inferred properties of the MaNGA galaxy M-8254-12703. |
| In the text | |
|
Fig. A.8. Inferred properties of the MaNGA galaxy M-8257-12701. |
| In the text | |
|
Fig. A.9. Inferred properties of the MaNGA galaxy M-8320-06104. |
| In the text | |
|
Fig. A.10. Inferred properties of the MaNGA galaxy M-8329-06104. |
| In the text | |
|
Fig. A.11. Inferred properties of the MaNGA galaxy M-8450-06102. |
| In the text | |
|
Fig. A.12. Inferred properties of the MaNGA galaxy M-8451-12703. |
| In the text | |
|
Fig. A.13. Inferred properties of the MaNGA galaxy M-8483-06103. |
| In the text | |
|
Fig. A.14. Inferred properties of the MaNGA galaxy M-8486-12702. |
| In the text | |
|
Fig. A.15. Inferred properties of the MaNGA galaxy M-8547-06102. |
| In the text | |
|
Fig. A.16. Inferred properties of the MaNGA galaxy M-8551-09102. |
| In the text | |
|
Fig. A.17. Inferred properties of the MaNGA galaxy M-8568-12703. |
| In the text | |
Current usage metrics show cumulative count of Article Views (full-text article views including HTML views, PDF and ePub downloads, according to the available data) and Abstracts Views on Vision4Press platform.
Data correspond to usage on the plateform after 2015. The current usage metrics is available 48-96 hours after online publication and is updated daily on week days.
Initial download of the metrics may take a while.