Free Access
Fig. 6.
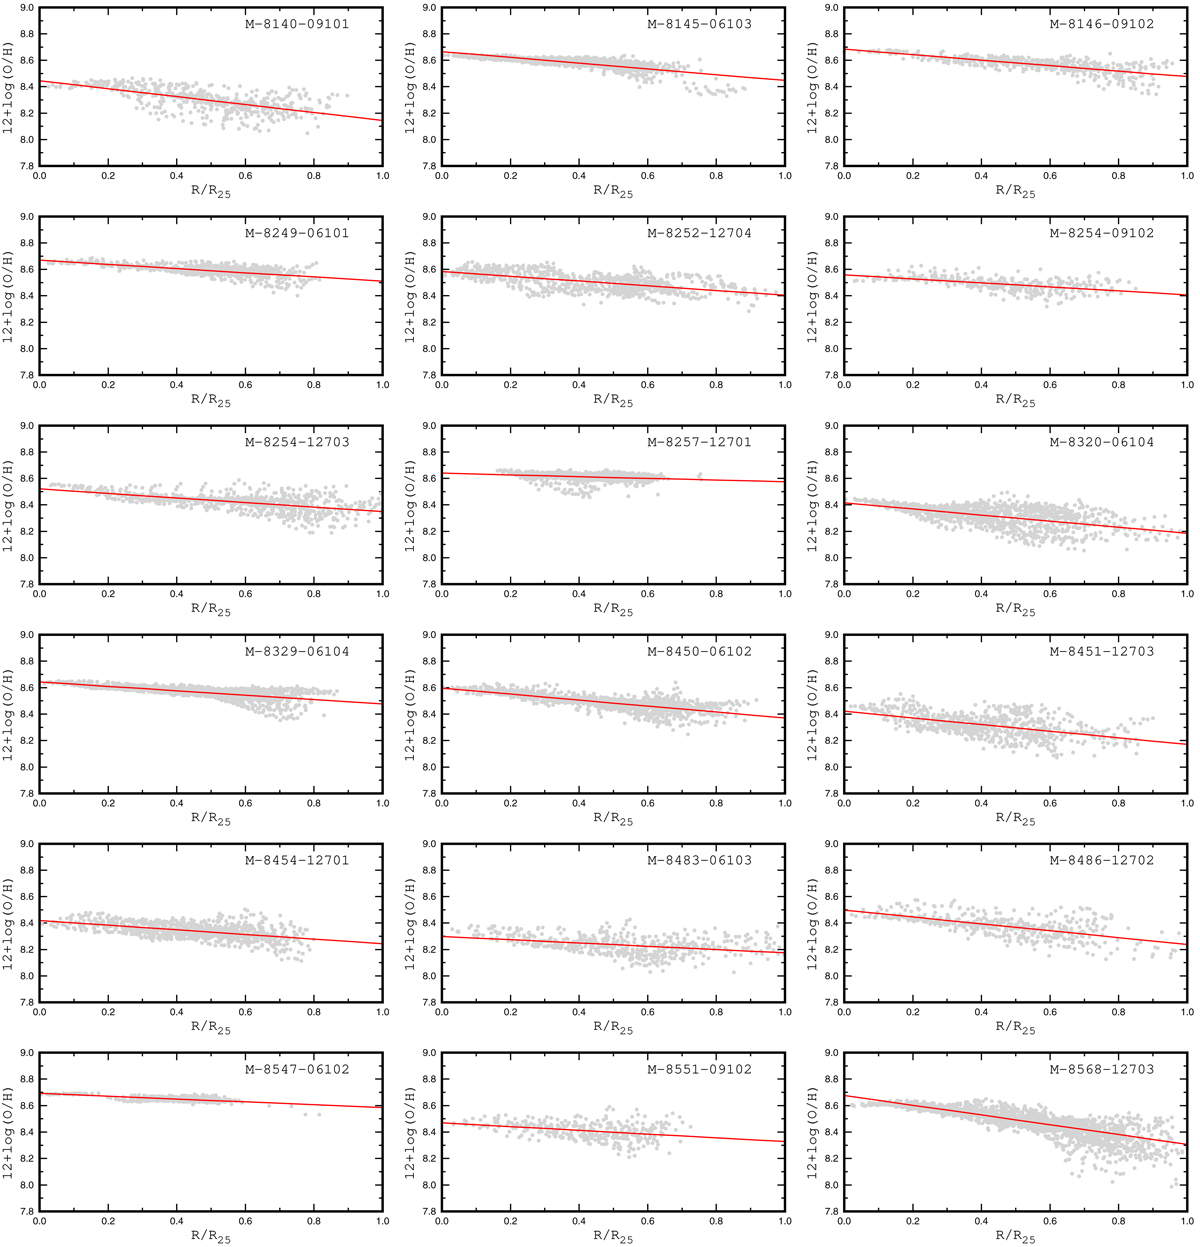
Radial distributions of the oxygen abundances for our sample of MaNGA galaxies. The grey points indicate the oxygen abundances in individual spaxels. The solid line represents the inferred linear abundance gradient.
Current usage metrics show cumulative count of Article Views (full-text article views including HTML views, PDF and ePub downloads, according to the available data) and Abstracts Views on Vision4Press platform.
Data correspond to usage on the plateform after 2015. The current usage metrics is available 48-96 hours after online publication and is updated daily on week days.
Initial download of the metrics may take a while.