Fig. 3.
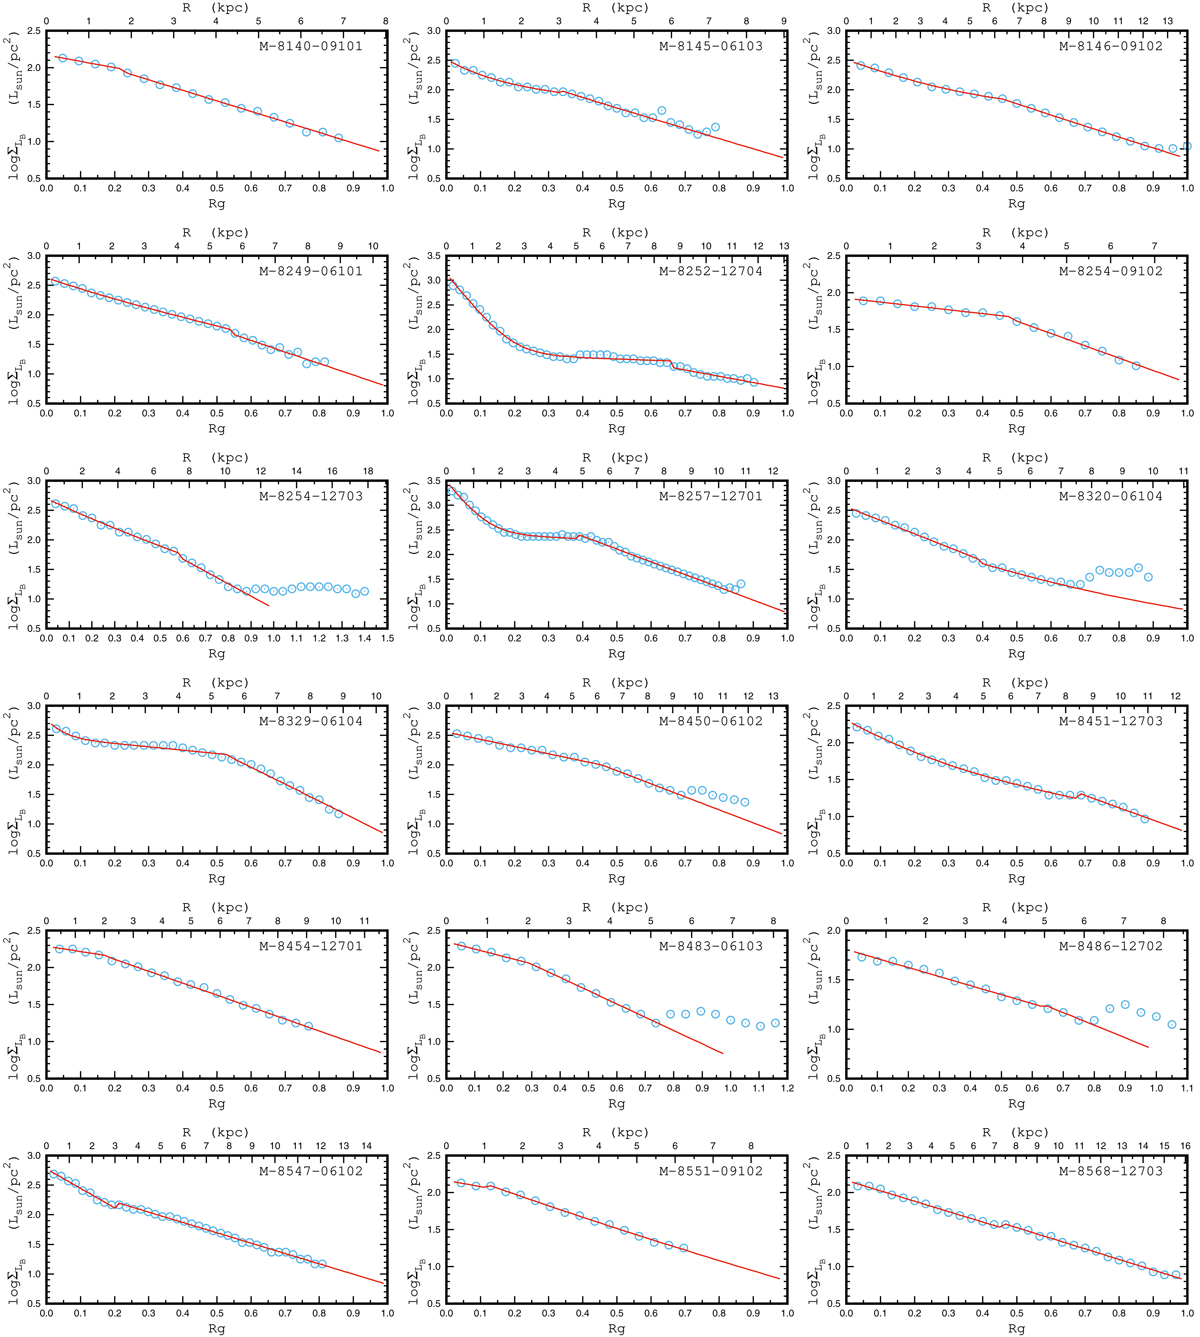
Surface brightness profiles for our sample of MaNGA galaxies. The points denote the observed profile. The line indicates the fit by a broken exponential profile for the disc and by a general Sérsic profile for the bulge. The lower OX axis marks the fractional galactocentric distance normalized to the optical radius, Rg = R/R25. The upper OX axis shows the galactocentric distance expressed in kiloparsecs.
Current usage metrics show cumulative count of Article Views (full-text article views including HTML views, PDF and ePub downloads, according to the available data) and Abstracts Views on Vision4Press platform.
Data correspond to usage on the plateform after 2015. The current usage metrics is available 48-96 hours after online publication and is updated daily on week days.
Initial download of the metrics may take a while.