Fig. 8.
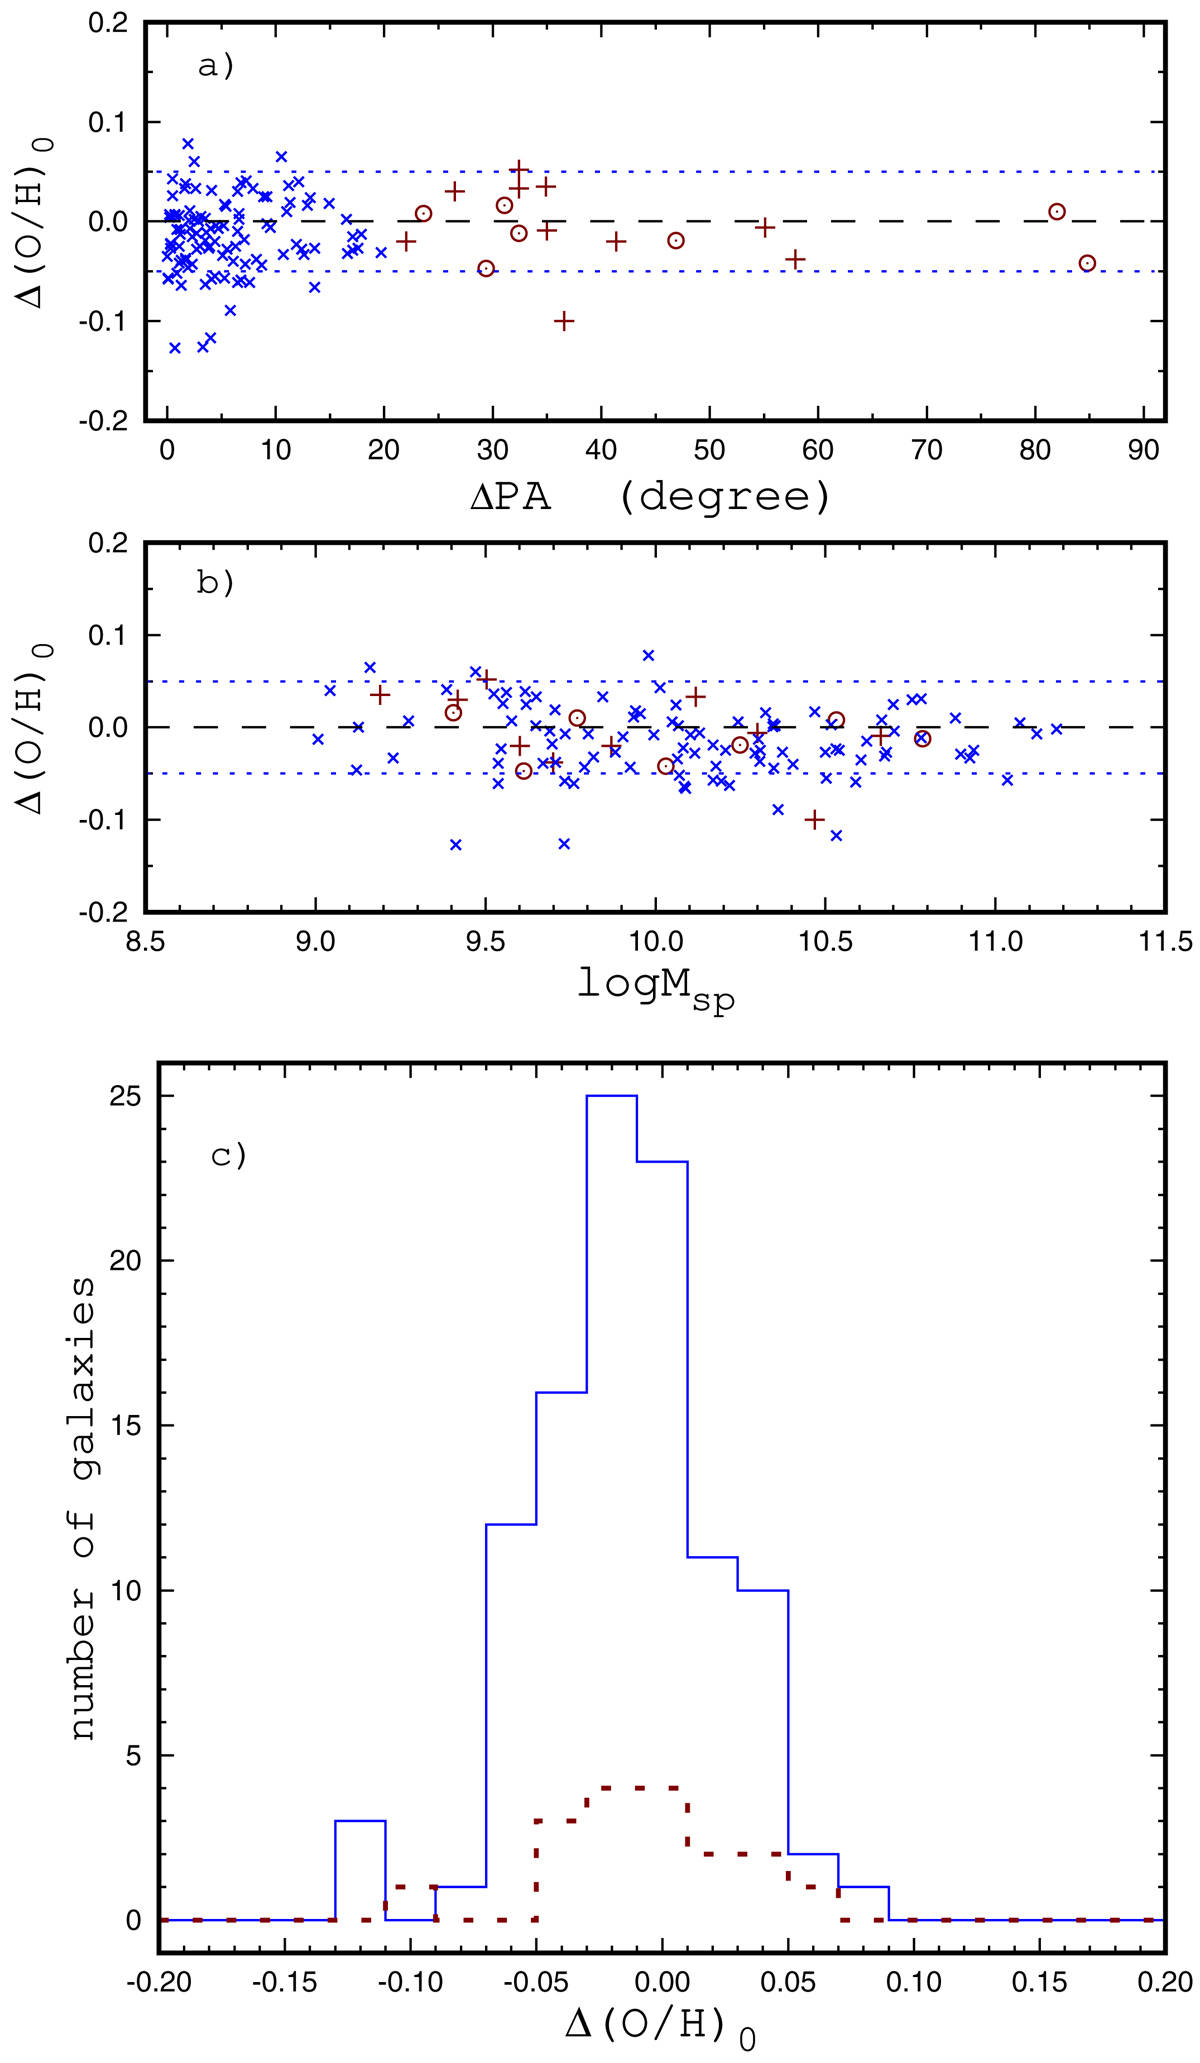
Value of depletion (enhancement) of the central oxygen abundance Δ(O/H)0 (the difference between the mean value of the oxygen abundances 12+log(O/H) in spaxels with galactocentric distances within 0.1 R25 and the value of the central intersect oxygen abundance estimated from the radial abundance gradient based on spaxels with galactocentric distances within 0.2–0.8 R25) as a function of ΔPA (panel a) and as a function of stellar mass of the galaxy (panel b). The circles represent data for galaxies with large ΔPA and without signs of ah interaction while the plus signs show galaxies with large ΔPA and with signs of an interaction. The crosses denote galaxies with small (no) ΔPA from Pilyugin et al. (2019). The dashed line marks a ΔPA of zero, and the dotted lines show the ±0.05 values. Panel c: histograms of Δ(O/H)0 for galaxies with ΔPA < 20° (solid line) and for galaxies with ΔPA > 20° (dashed line).
Current usage metrics show cumulative count of Article Views (full-text article views including HTML views, PDF and ePub downloads, according to the available data) and Abstracts Views on Vision4Press platform.
Data correspond to usage on the plateform after 2015. The current usage metrics is available 48-96 hours after online publication and is updated daily on week days.
Initial download of the metrics may take a while.