Fig. 5.
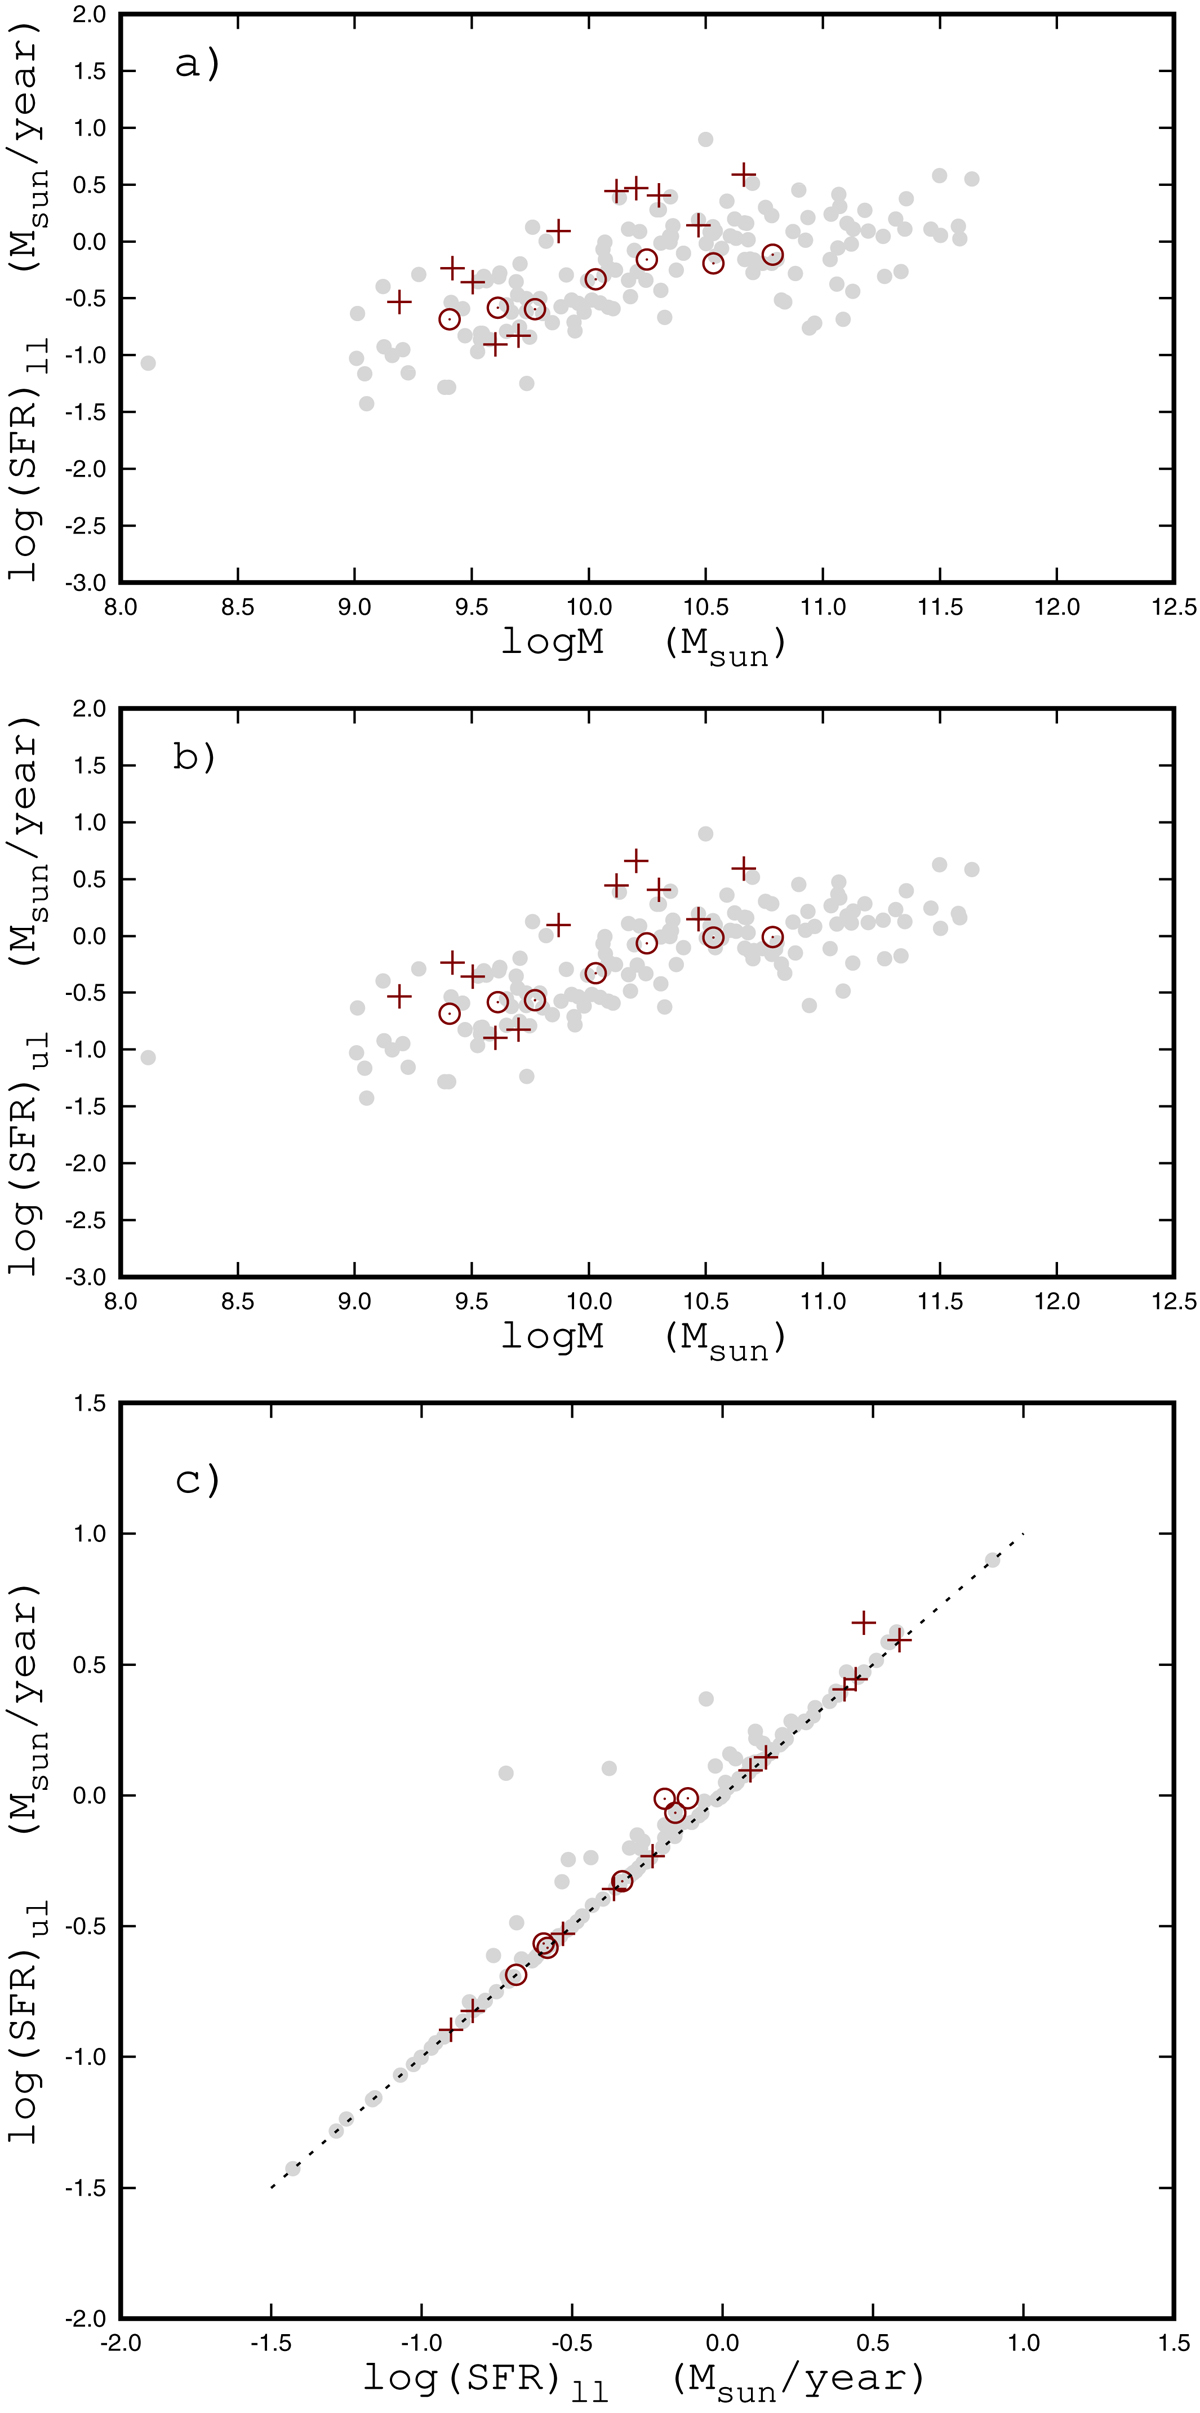
Panel a: lower limit of the star formation rate, SFRll, as a function of stellar mass for MaNGA galaxies. The plus signs denote galaxies with ΔPA > 20° and with signs of an interaction. The circles denote galaxies with ΔPA > 20° and without signs of an interaction. The gray points mark galaxies with ΔPA < 20° from Pilyugin et al. (2019). Panel b: same as panel a but for the upper limit of the star formation rate, SFRul. Panel c: comparison between the SFRul and SFRll for those galaxies. The line is that of equal values.
Current usage metrics show cumulative count of Article Views (full-text article views including HTML views, PDF and ePub downloads, according to the available data) and Abstracts Views on Vision4Press platform.
Data correspond to usage on the plateform after 2015. The current usage metrics is available 48-96 hours after online publication and is updated daily on week days.
Initial download of the metrics may take a while.