| Issue |
A&A
Volume 633, January 2020
|
|
|---|---|---|
| Article Number | A41 | |
| Number of page(s) | 10 | |
| Section | Stellar structure and evolution | |
| DOI | https://doi.org/10.1051/0004-6361/201936526 | |
| Published online | 08 January 2020 | |
Structure of a massive common envelope in the common-envelope wind model for Type Ia supernovae
1
National Astronomical Observatories/Yunnan Observatory, Chinese Academy of Sciences, Kunming 650216, PR China
e-mail: This email address is being protected from spambots. You need JavaScript enabled to view it.
, This email address is being protected from spambots. You need JavaScript enabled to view it.
2
University of Chinese Academy of Sciences, Beijing 100049, PR China
3
Key Laboratory for the Structure and Evolution of Celestial Objects, Chinese Academy of Sciences, 650216 Kunming, PR China
4
Center for Astronomical Mega-Science, Chinese Academy of Sciences, 20A Datun Road, Chaoyang District, Beijing 100012, PR China
5
Department of Astronomy, Oxford University, Oxford OX1 3RH, UK
Received:
20
August
2019
Accepted:
13
November
2019
Abstract
Context. Although Type Ia supernovae (SNe Ia) are important in many astrophysical fields, the nature of their progenitors is still unclear. A new version of the single-degenerate model has been developed recently, the common-envelope wind (CEW) model, in which the binary is enshrouded in a common envelope (CE) during the main accretion phase. This model is still in development and has a number of open issues, for example what is the exact appearance of such a system during the CE phase?
Aims. In this paper we investigate this question for a system with a massive CE.
Methods. We use a thermally pulsing asymptotic giant branch (TPAGB) star with a CO core of 0.976 M⊙ and an envelope of 0.6 M⊙ to represent the binary system. The effects of the companion’s gravity and the rotation of the CE are mimicked by modifying the gravitational constant. The energy input from the friction between the binary and the CE is taken into account by an extra heating source.
Results. For a thick envelope, the modified TPAGB star looks similar to a canonical TPAGB star but with a smaller radius, a higher effective temperature, and a higher surface luminosity. This is primarily caused by the effect of the companion’s gravity, which is the dominant factor in changing the envelope structure. The mixing length at the position of the companion can be larger than the local radius, implying a breakdown of mixing-length theory and suggesting the need for more turbulence in this region. The modified TPAGB star is more stable than the canonical TPAGB star and the CE density around the companion is significantly higher than that assumed in the original CEW model.
Conclusions. Future work will require the modelling of systems with lower envelope masses and the inclusion of hydrodynamical effects during the CE phase.
Key words: binaries: close / stars: evolution / supernovae: general / white dwarfs
© ESO 2020
1. Introduction
Type Ia supernovae (SNe Ia), some of the most violent explosions in the Universe, play an important role in a number of astrophysical fields (Wang & Han 2012; Maoz et al. 2014). As one of the best distance indicators, SNe Ia have been applied to measure cosmological parameters, which led to the discovery of an accelerating expansion of the Universe (Riess et al. 1998; Perlmutter et al. 1999). SNe Ia are also very important for the chemical evolution of galaxies as the main contributor of iron neucleosynthesis (Matteucci & Greggio 1986). It is widely believed that a SN Ia originates from the thermonuclear explosion of a carbon-oxygen white dwarf (CO WD) in a binary system (Hillebrandt et al. 2013), but the nature of the companion to the CO WD has remained controversial (Wang & Han 2012; Maoz et al. 2014).
Depending on the companion’s nature, progenitor models of SNe Ia are mainly divided into two classes, the single-degenerate (SD) model, in which the companion may be a main-sequence (MS) star, a red giant (RG), or a helium star (Whelan & Iben 1973; Nomoto et al. 1984), and the double-degenerate (DD) model involving the merging of two CO WDs (Tutukov & Yungelson 1981; Iben & Tutukov 1984; Webbink 1984). At present, both models have some theoretical and observational support. In this paper, we focus on a SD model. In the classical SD model, a CO WD accretes material from a non-degenerate companion star to increase its mass (Nomoto 1982). When the mass of the CO WD reaches a mass close to the Chandrasekhar limit, Mch, the CO WD explodes as a SN Ia (Nomoto et al. 1984). In the SD model, there is a critical accretion rate, Ṁcr. If the mass-transfer rate, Ṁtr, in the binary system exceeds Ṁcr, the WD expands to form a RG-like object and then possibly swallows the companion to form a common envelope (CE, Nomoto 1982). The dynamics of the system during the CE phase are poorly understood (Ivanova et al. 2013). The binary may lose its orbital angular momentum by friction with the CE and ultimately merge rather than produce a SN Ia (Nomoto et al. 1979). On the other hand, if Ṁtr is too low, a nova explosion occurs and prevents the WD from gaining mass, again not leading to a SN Ia explosion (Wang & Han 2012). Because of this fine-tuning, the birth rate of SNe Ia appears to be lower in the classical SD model than observed.
To increase the birth rate of SNe Ia in the SD model, Hachisu et al. (1996) developed the optically thick wind (OTW) model, which leads to a much higher SN Ia rate (Hachisu et al. 1999; Han & Podsiadlowski 2004), in fact comparable with the observed rate. In the OTW model, an OTW is assumed to occur when Ṁtr > Ṁcr, rather than the formation of a CE. The CO WD will then gradually increase its mass at the rate of Ṁcr and any unprocessed matter is blown off from the surface of the WD (Hachisu et al. 1996). However, some predictions from the OTW model are in conflict with observations. For example, because the OTW is driven by Fe lines, the OTW occurs only when Z ≥ 0.002, implying that there should be no SNe Ia in the early Universe or in low-metallicity environments (Kobayashi et al. 1998). This cannot explain those SNe Ia that occur at high redshifts or in low-metallicity environments (Prieto et al. 2008; Rodney et al. 2015). In addition, the theoretical OTW velocity (about 1000 km s−1, Hachisu et al. 1996) is much higher than that inferred from observations of circumstellar material (about 100 km s−1, Patat et al. 2007; Sternberg et al. 2011; Dilday et al. 2012). There are also some fine-tuning problems in the OTW model, such as how to regulate simultaneous (or alternating) helium and hydrogen burning (Piersanti et al. 2000; Shen & Bildsten 2007).
To overcome the shortcomings of the OTW model, Meng & Podsiadlowski (2017; hereafter MP17) recently developed the common-envelope wind (CEW) model. In the CEW model, when Ṁtr > Ṁcr a CE is assumed to form around the binary instead of an OTW. The CE is divided into two regions: the inner region of the CE co-rotates with the binary, while the outer region rotates differentially with the angular velocity dropping off as a power law (following Meyer & Meyer-Hofmeister 1979). The CO WD increases its mass at the rate of Ṁcr. The differentially rotating outer envelope extracts orbital angular momentum from the inner binary into the outer region. During the CE phase, the system might look like a thermally pulsing asymptotic giant branch (TPAGB) star in which alternating phases of hydrogen and helium burning self-adjust just as they do in TPAGB stars (MP17). The CEW model may resolve some of the problems of the OTW model but also retain many of its merits, such as only a weak dependence on the metallicity, and the wind velocity from the CE surface is expected to be less than about 200 km s−1, as inferred from observations. In addition, the birth rate of SNe Ia from the CEW model is higher than that from the OTW model by about 30% (see MP17 for details). In addition, based on the CEW model, Meng & Podsiadlowski (2018) found that SN 2002cx-like and SN Ia-CSM objects could share the same origin and Meng & Li (2019) found that subdwarf B stars could be the surviving companions of SNe Ia in some supernova remnants. However, the current CEW model is still at an early stage of development and some important questions in this model still need to be answered. For example, what does the system look like during the CE phase? How is material lost from the surface of the CE? What is a reasonable frictional CE density in the CEW model? This ultimately determines which systems merge and which survive as binaries and ultimately produce SNe Ia.
The purpose of this paper is to develop a numerical framework to determine the structure of the CE system, and its appearance, to address some of these questions. In Sect. 2 we present the numerical method in detail. In Sect. 3 we apply the model to a relatively massive envelope. In Sect. 4 we discuss these results and the implications for future work. Finally, in Sect. 5 we summarise the main conclusions and present an outlook.
2. Numerical methods
2.1. Initial model
In this study we use the Modules for Experiments in Stellar Astrophysics (MESA) code (version 10108; Paxton et al. 2011, 2013, 2015, 2018) to carry out 1D hydrostatic simulations for systems during the CE phase in the CEW model. As a first step in a series of planned simulations, we simulate the structure of a binary system with a massive CE as indicated by MP17. Because the system is likely to look like a TPAGB star during the CE phase, we take a single TPAGB star as our starting model and simulate the effects of the spiraling-in companion in its envelope by changing the gravitational potential in the TPAGB star to imitate the effect of the companion’s gravity. This is a simple approximation, which we discuss further in Sect. 4. At present, three effects are considered: (1) the energy input from the secondary and the friction between the binary system and the CE, (2) the gravity from the companion, and (3) the effect of the envelope’s rotation.
Figure 1 shows a schematic diagram illustrating the CE simulation in which the CO core of the TPAGB star represents the CO WD in the CEW model, and hydrogen burning and helium shell flashes automatically adjust themselves, as suggested in the CEW model. The envelope is divided into two parts, an inner co-rotating region and an outer differentially rotating region. The boundary is at the position of r ≈ a, where a is the assumed binary separation. In this simulation we add a transition region at the bottom of the outer region to smooth the effect of the companion’s gravity on the envelope to improve the convergence of the code. In this paper we do not consider the mass transfer in the binary itself and mass-losing wind from the CE surface or any possible hydrodynamical mass ejection from the system. We will consider these effects step by step in our future work.
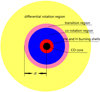 |
Fig. 1. Schematic diagram illustrating the initial equivalent model during the CE phase. The envelope is divided into three regions, the inner co-rotating region (blue), the outer differentially rotating region (yellow), and a transition region (light red) at the bottom of the outer region. The CO core represents the CO WD in the CEW model, in which stable hydrogen burning and helium shell flashes adjust themselves just as in a normal TPAGB star. |
2.2. Rotation
For a circular binary system with a separation, a, the angular velocity is
 (1)
(1)
where M1, M2, and G are the primary mass, the secondary mass, and the Newtonian gravitational constant, respectively. In our simulation, M1 is the mass of the He core (i.e. the mass of the hydrogen-exhausted core) of the TPAGB star and M2 is the companion mass. In the CEW model, the angular velocity of a CE may be expressed as (Meyer & Meyer-Hofmeister 1979)
 (2)
(2)
where r is the local radius of the CE, the local radius of the TPAGB star in our simulations. The centrifugal force1 on a test particle of unit mass in the envelope in the equatorial plane is
 (3)
(3)
where  is the orbital radius of the primary star relative to the centre of mass of the binary system and rcore is the radius of the He core of the TPAGB star. The equivalent gravity on the test particle of unit mass in the envelope is
 (4)
(4)
where M(r) is the mass enclosed within radius r in the envelope and Grot is an equivalent gravitational constant (see Podsiadlowski et al. 1992) when only considering the effect of envelope rotation, and β is a parameter between 0 and 1 for different latitudes. Here we take an average β over a spherical shell of β,
 (5)
(5)
where Fr is the radial component of the centrifugal force of material in a spherical shell, and F2 is the centrifugal force assuming that all the material locates in the equatorial plane. We obtain Grot:
 (6)
(6)
2.3. Companion gravity
In our simulation, we assume that the companion’s gravity only plays a role in the differentially rotating region. To avoid numerical problems, we set a transition region at the bottom of the differentially rotating region to smooth the effects of the companion’s gravity (see Fig. 1). So the companion’s gravity on a test particle of unit mass in the TPAGB star is
 (7)
(7)
where d is the width of the transition region. Because MESA is a 1D code, our treatment is equivalent to assuming that the companion’s material is uniformly distributed in a spherical shell with a radius a and a thickness d. So the total gravity on the test particle of unit mass is
 (8)
(8)
where GM2 is the equivalent gravitational constant when only the effect of the companion’s gravity on the envelope is included and may be expressed as
 (9)
(9)
When both the companion’s gravity and the centrifugal force from the rotation of the envelope are considered together, the equivalent gravitational constant may be expressed as
 (10)
(10)
As an example, in Fig. 2 we show ratios of Grot, GM2, and Grot + M2 to G when a = 40 R⊙ and d = 2 R⊙. The figure shows that rotation mainly plays a role in the inner region, while in the outer region the companion’s gravity dominates the effective gravitational constant.
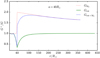 |
Fig. 2. Ratio of the equivalent gravitational constant to the Newtonian gravitational constant as a function of local radius for a = 40 R⊙ and d = 2 R⊙. |
2.4. Heating energy
In the CEW model the frictional luminosity between the CE and the binary is modelled as (Meyer & Meyer-Hofmeister 1979)
 (11)
(11)
where α is a dimensionless coefficient of order one and is set to be α = 1, and η is the effective turbulent viscosity,
 (12)
(12)
where l′ is the size of the region near the co-rotating region where most of the frictional energy is released. Somewhat arbitrarily, we set l′ = 0.1 a (see also MP17)2, and ρ and Vc are the local density and the local convective velocity of the shell at r = a, respectively. Then the total heating power is
 (13)
(13)
where Lc is the companion’s luminosity. To add Lfc in the envelope, we use an extra energy source (see Paxton et al. 2015), ϵex, which can be written as
 (14)
(14)
where f is the distribution function (Taam & Sandquist 2000), and Mex is the total mass enclosed in the range where f > 0.
The distribution of the extra energy rate f is set be a trapezoid, where the longer base is equal to the companion diameter and the shorter base is set to be the companion radius. Generally, the ratio of the binary separation to the companion radius lies between 2 and 4 (Meng & Yang 2010). Here, we set the ratio to be 3 for simplicity. As an example, we show the distribution of the extra energy rate as a function of local radius for different binary separations in Fig. 3. Figure 3 shows that the peak of the extra energy rate sharply decreases with binary separation as expected. For a roughly constant total extra energy, a larger binary separation means a higher Mex and a lower peak of the distribution. In addition, the local density has a major influence in Lf (see Eq. (11)): the local density significantly decreases with a, as does Lf. This also partly contributes to the above phenomenon.
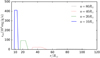 |
Fig. 3. Distributions of ϵex for a = 10 R⊙, 20 R⊙, 40 R⊙, 80 R⊙. |
2.5. Initial parameters
In this paper, we consider a case with a massive envelope. The initial model is constructed from a TPAGB star by evolving a star with an initial mass of 5.2 M⊙ and metallicity of Z = 0.001 from the zero-age MS to the TPAGB phase. In this evolution, we choose a Reimers’ and a Blöcker’s wind (Reimers 1975; Blöcker 1995), in which their Reimers_scaling_factor and Blocker_scaling_factor in MESA are both set to 0.5. When the envelope reaches 0.6 M⊙, we turn off the mass loss and evolve this star for another 10 000 yr. Finally, we construct from this model a TPAGB star with a CO core of 0.976 M⊙ and an envelope of 0.6 M⊙. Here, we simply set M2 = 1 M⊙ and Lc = 1 L⊙. Generally, the binary separation plays an important role in the system as described above. To test the effect of the binary separation on the system, we explore different separations. We set a to be 10, 20, 40, and 80 R⊙. The width of the transition region, d, could potentially also affect the results, and so we test d = 2 R⊙ and d = 4 R⊙.
As shown above, there are mainly three effects that could affect the structure of the system. The principal aim of this paper is to compare simulations with these effects included with a canonical TPAGB star and to test which effect is dominant. The cases we explore are the effects of (I) rotation, (II) the companion’s gravity, and (III) extra heating. In addition, we use different binary separations for all three effects.
3. Results
In this section, we discuss the contribution of the three effects discussed above and check which effect dominates the evolution of the system. We also show the appearance of a system with a massive CE.
3.1. Contributions of the three effects
Figure 4 shows the evolution of the effective temperature, luminosity, and radius for the cases where the effects of rotation, the companion’s gravity, and the extra heating are included separately. For all cases the binary separation is 40 R⊙ and the transition region has d = 2 R⊙. In panel d of Fig. 4, we also show the time interval between two adjacent pulses as a function of pulse number (from the second pulse to the tenth). Figure 5 shows the inner profiles of the density, ρ; temperature, T; pressure, P; and specific entropy, S, in the envelopes of the various cases at a time between two thermal pulses. At first glance, Figs. 4 and 5 show that the behaviour of the system with only the extra heating effect is quite similar to that of the canonical TPAGB star. Because the envelope is almost completely convective (as seen from the decreasing entropy in panel d of Fig. 5; see Kippenhahn & Weigert 1994), most of the extra heating energy is transported to the surface by convection and is then radiated away. Only a small fraction of the extra heating energy is used to expand the envelope. As a result, compared with the canonical TPAGB star, the star with the extra heating term has a higher luminosity, a slightly larger radius, and a slightly lower effective temperature.
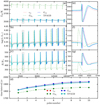 |
Fig. 4. Evolution of the effective temperature, Teff; the luminosity, L; the radius, R; and the time interval between two adjacent thermal pulses for the canonical TPAGB star (cyan solid line) and the cases where only the effect of extra heating (red dotted line), rotation (blue dashed line), and the companion’s gravity (green dash-dot line) are considered separately. The right panels show enlargements of the grey boxes in the left panels. |
For the case with only the effect of rotation included, there is almost no difference from the canonical TPAGB star for the surface parameters. This result is mainly determined by the distribution of rotation in the envelope (see Eq. (2) and Fig. 2). Actually, rotation only plays an important role in the inner region of the envelope, and the effective gravity at the surface is almost the same as in a normal TPAGB star (see Fig. 2). This explains why the surface properties of the star are almost the same as for the canonical TPAGB star. However, the rotation has a slight effect on the inner structure, as shown in Fig. 5. For example, the density for the case with only the rotation effect at r ≈ 40 R⊙ is slightly lower than that in the canonical TPAGB star, as is the pressure and the temperature.
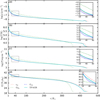 |
Fig. 5. Profiles of the local density, ρ; temperature, T; pressure, P; and specific entropy, S, in the envelopes of the canonical TPAGB star (cyan solid line) and the cases with only the effect of extra heating (red dotted line), rotation (blue dashed line), and the companion’s gravity (green dash-dot line) at a point between two thermal pulses (t = 3500 yr). In each panel the inset shows an enlargement of the area within the grey box. |
The effect of the companion’s gravity is very significant compared with the canonical TPAGB star: the star with the extra gravity from the companion has a significantly higher effective temperature (by about 350 K), a smaller radius (by about 70 R⊙), and a higher luminosity (by about 620 L⊙). In particular, the time interval between two adjacent pulses for this case is also significantly shorter than that for the canonical TPAGB star. As shown in Fig. 2, the gravity in the envelope with the companion’s gravity included is significantly higher than that in the canonical TPAGB star by a factor of 1.6–2.0. This implies that the envelope has to shrink significantly and release a fraction of its gravitational potential energy to heat the envelope. As a result, the inner temperature, pressure, and density become higher than those in the canonical TPAGB star. In particular the increase in temperature in the inner region leads to an increase in the hydrogen burning rate on top of the He core, and so leads to a higher helium accumulation rate. This is the reason for the shorter time interval between two adjacent pulses, as shown in panel d of Fig. 4.
The first adiabatic exponent, Γ1, provides a measure of the dynamical stability of a gas: a gaseous system is dynamically unstable and either collapses or expands if the average  (Kippenhahn & Weigert 1994). Panel a of Fig. 6 shows Γ1 as a function of mass at a time between two thermal pulses. For the cases with only the rotation effect and with only the extra heating effect the run of Γ1 is very similar to that of the canonical TPAGB star. However, the stability for the case with the companion’s gravity included is rather different from that for the canonical TPAGB star. In particular unstable regions near the surface for this case become quite narrow, so the star is more stable than the canonical TPAGB star.
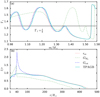 |
Fig. 6. Profiles of the first adiabatic exponent, Γ1, and the ratio of the local mixing length to the local radius, l/r, in the envelopes of the canonical TPAGB star (cyan solid line) and the cases with only the effect of the extra heating (red dotted line), rotation (blue dashed line), and the companion’s gravity (green dash-dot line) included at a time between two thermal pulses (t = 3500 yr). The horizontal dark solid line in panel a represents the critical |

Panel b of Fig. 6 shows the ratio of the local mixing length to the local radius as a function of local radius at a time between two thermal pulses. For the case with only the extra heating, the ratio is again almost the same as in the canonical TPAGB star. Within the whole convective region, the local mixing length is always smaller than its local radius. However, for the case with only the rotation effect, the ratio may be as high as 2.33 near the bottom of the differentially rotating region, and for the case with only the companion’s gravity the ratio may be as high as 1.5 around the companion’s position. We note that this MESA code still applies the standard mixing-length theory (MLT) to treat convection. The mixing length l = ΛmltHp, where Λmlt is the mixing-length parameter, taken to be 2.0 for these models (Han et al. 1994; Marigo 1998). Such a high ratio indicates a limitation of MLT around the companion’s position. A region with a ratio of the local mixing length to the local radius higher than 1.0 probably implies that the MLT model underestimates the amount of turbulence to transport energy; more turbulence would lower the effective mixing length. Such extra turbulence would not be very surprising considering the role of the Kelvin-Helmholtz instability in differentially rotating regions, which should lead to increased turbulence in this region. Panel b of Fig. 6 also shows that the star with only the companion’s gravity included has a lower mixing length than the canonical TPAGB star in the outer convective region, while the star with only the rotation effect has almost the same mixing length as the canonical TPAGB star in the outer convective region.
This discussion shows that the effect of the companion’s gravity is the most important among the three considered and strongly modifies the structure and evolution of the system.
3.2. Appearance of the system
In this section we discuss the appearance of the system with all three effects (rotation, companion’s gravity, and extra heating), but for different binary separations to the canonical TPAGB star. For these cases, the width of the transition region is d = 2 R⊙. Figure 7 shows the evolution of the effective temperature, luminosity, and radius of the modified TPAGB star for different binary separations. Panel d of Fig. 7 shows the time interval between two adjacent pulses as a function of pulse number (from the second pulse to the tenth). Figure 7 shows that the appearance of the modified TPAGB star is still similar to the canonical TPAGB star, but with a higher effective temperature, a higher luminosity, and a smaller radius. This is similar to the effect with only the companion’s gravity effect included in the previous section, where the companion’s gravity is the dominant factor. Because both the companion’s gravity and the extra heating increase the luminosity of the modified star, the luminosity here is even higher than that in panel b of Fig. 4. The luminosity of the modified TPAGB star is higher than the canonical TPAGB star by about 1470–5100 L⊙, depending on the binary separation. In addition, there seems to be a trend such that the larger the binary separation, the weaker the three effects on the modified TPAGB star. This mainly follows from the fact that the heating energy decreases with binary separation. The time interval for the modified TPAGB between two adjacent pulses seems not to depend on the binary separation, although it is smaller than that for the canonical TPAGB star. The reason is that the time interval is mainly affected by the companion’s gravity, while the companion’s gravity is entirely determined by the secondary mass, which is constant in these simulations. Actually, the binary separations explored in this paper are much smaller than the radius of the TPAGB star. This also partly contributes to the fact that the time interval does not depend on the binary separation.
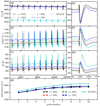 |
Fig. 7. Evolution of the effective temperature, Teff; the luminosity, L; the radius, R; and the time interval between two adjacent pulses for the canonical TPAGB star (cyan point line) and the cases with all three effects and a = 10 R⊙ (blue solid line), 20 R⊙ (green dashed line), 40 R⊙ (red dash-dot line), and 80 R⊙ (black dotted line), respectively. The right panels are enlargements of the grey boxes in the left panels. |
Panel a of Fig. 8 shows Γ1 as a function of mass. It is similar to panel a of Fig. 6, but for the cases with all three effects included and different binary separations. Again, compared with the canonical TPAGB star, unstable regions near the surface in the envelope of the modified TPAGB star become quite narrow irrespective of binary separation: the modified TPAGB star is more stable than the canonical TPAGB star.
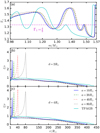 |
Fig. 8. Profiles of Γ1 and l/r in the envelopes of the canonical TPAGB star (cyan solid line) and the cases with all three effects included and a = 10 R⊙ (blue solid line), 20 R⊙ (green dashed line), 40 R⊙ (red dash-dot line), and 80 R⊙ (black dotted line) at a time between two thermal pulses (t = 3500 yr). The horizontal dashed line in panel a is the critical |

Panel b of Fig. 6 confirms that the mixing length in the transition region of the modified TPAGB star is greater than the local radius. To check whether this phenomenon is affected by the binary separation and the width of the transition region we present, in panels b and c of Fig. 8, the ratio of the mixing length to the local radius of the modified TPAGB star with different binary separations and different widths of the transition region. Similar to panel b of Fig. 6, the ratio of the mixing length to the local radius in the outer region of the modified TPAGB star is always lower than that in the canonical TPAGB star, while the ratio in the transition region of the modified TPAGB star is higher than that in the canonical TPAGB star by a factor of 3.0–4.0. This result does not depend on the binary separation and the width of the transition region. Because the mixing length should be smaller than the local radius, these results imply that there should be more turbulence in these regions as suggested by MP17; this again indicates a limitation of MLT.
3.3. Parameters in the CEW model
In the CEW model, whether the binary system survives the CE phase or not depends mainly on the frictional luminosity, which in turn depends on the mixing length, the local density, and the local convective velocity. In the previous two sections we discuss the role of the mixing length. In this section, we show the density and the convective velocity for the modified TPAGB stars and compare them with those used by MP17. Panel a of Fig. 9 shows the density profile of the modified TPAGB star between two thermal pulses with different binary separations, and compares it with the density profile of the canonical TPAGB star and that calculated based on the equations of MP17. Compared with the TPAGB star, the density profile in the modified TPAGB star has a steeper slope. However, within the region near the companion, the density in the modified TPAGB with all the three effects included is significantly higher near the location of the companion (e.g. about 200 times higher for the case with a = 10 R⊙ than that used by MP17) because MP17 used an average over the whole envelope. We discuss the possible origin of the above differences in Sect. 4.
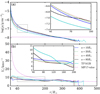 |
Fig. 9. Profiles of the local density, ρ, and the convective velocity, Vc, in the envelopes of the canonical TPAGB star (cyan solid line) and the modified TPAGB star with all three effects included and a = 10 R⊙ (blue solid line), 20 R⊙ (green dashed line), 40 R⊙ (red dash-dot line), and 80 R⊙ (black dotted line) at a time between two thermal pulses (t = 3500 yr). The magenta dashed curves labelled “MP17 value” are the average density, |

Panel b of Fig. 9 shows the convective velocity profile for the same models as those in panel a. The convective velocity, as used by MP17, is also presented in the figure as a magenta dashed curve. This figure indicates that the convective velocity for an assumed a = 10 R⊙ used by MP17 is about three times higher than that in the modified TPAGB star.
4. Discussion
Meng & Podsiadlowski (2017) developed a new version of the SD model, the CEW model. In this paper, we used a very simple method to simulate the appearance of a WD + MS system with a massive CE during the CE phase and presented its inner structure. The main results of this study are that the system should be more dynamically stable than the canonical TPAGB star, and that the density of the envelope in the modified star is greater than was assumed by MP17.
4.1. Stability in the modified TPAGB star
The modified TPAGB star with all three effects included (rotation, companion’s gravity, and extra heating) seems to be more stable than the canonical TPAGB star. However, our treatment of the effects of an immersed binary companion is rather simple and has its limitations. Firstly, we only considered the effects of gravity and luminosity from the companion to simulate its effects on the CE by modifying the gravitational constant and adding an extra energy term. Because MESA is a 1D code, our method means that the companion’s material and the extra heating are symmetrically distributed within a spherical shell. In reality, the companion orbits the centre of mass in a certain orbit and the heating energy is concentrated near the star rather than in a spherical shell. In addition, our method of treating rotation also implies spherical symmetry, which is not realised in the real case. The assumption of spherical symmetry may be part of the reason why the resulting structure is more stable. However, there could be other reasons to suggest a more unstable modified TPAGB star. Some 2D or 3D numerical simulations have shown that convection in the envelope of an AGB star may develop into a shock (Woitke 2006; Freytag et al. 2017; Höfner & Olofsson 2018). In our simulations, we also note that the ratio of the convective velocity to the local sound speed near the surface in the modified TPAGB star is always higher than that in the canonical TPAGB star. This might imply a more unstable structure for the modified TPAGB star. We note that the red object LMC N66 in the Large Magellanic Cloud is a candidate for a system during the CEW phase; this system consists of a WD primary and a non-degenerate companion at the centre of the object, which is experiencing very high and variable mass loss (Hamann et al. 2003; Peña et al. 2008). If LMC N66 is an object, as predicted by the CEW model, this might indicate that such systems are more unstable than canonical TPAGB stars.
4.2. Density in the envelope of the modified TPAGB star
In the region near the companion, the density in the modified TPAGB with all the three effects included and a = 10 R⊙ is about 200 times higher than that used by MP17. Because Lf ∝ ρ (see Eqs. (11) and (12)), the heating luminosity Lfc ≈ Lf is between 1470 L⊙ and 5100 L⊙, which is significantly higher than that used by MP17. A higher frictional luminosity means that the binary system is more likely to experience a fast spiral-in phase and ultimately merge. The spiral-in timescale of the binary in the CEW model can be estimated as (see MP17)
 (15)
(15)
where I is the angular momentum of the binary, İ is the loss rate of I for the friction between the binary and the CE, μ is the reduced mass of the binary, and l is 0.1 a. For a fixed binary separation, ts ∝ 1/ρ. Thus, a higher density produces a shorter spiral-in timescale. Figure 10 shows the spiral-in timescale for the modified TPAGB star with all the three effects included for different binary separations. The spiral-in timescale is only a few hundred years and decreases with the binary separation in line with Eq. (15). In the range of a that we considered, a is another important factor to affect ts. In all cases, ts does not increase by 16 times when a decreases from 40 R⊙ to 10 R⊙, because of the increase of the density. The implication of this is that a system with such a massive CE is likely to merge within a few hundred years because of the high local density. This is mainly a consequence of our treatment of the CE. Firstly, our method leads to a more stable and more compact TPAGB star, which contributes to the high density. Secondly, as discussed above, the modified TPAGB star is assumed to be in hydrostatic equilibrium, but in a more realistic simulation the inner region may expand dynamically reducing the density near the companion (Iaconi et al. 2018). Therefore, hydrodynamic simulations are ultimately needed. For example, current 1D hydrodynamic simulations have shown that with a large extra source of heating a RG may expand to more than 3000 R⊙ (Clayton et al. 2017), which would be larger than the radius of the modified TPAGB by about one order of magnitude and produce a rather low CE density and hence frictional energy, even lower than assumed by MP17. Such a system could then still survive the CE phase. In this context, in the case of large expansion we note that other energy sources may become significant (Ivanova et al. 2013). In particular, recombination energy is released and can contribute to the expansion and ejection of the CE (Sabach et al. 2017; Ivanova 2018) and may further decrease the frictional luminosity.
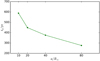 |
Fig. 10. Spiral-in timescale, ts, for the modified TPAGB star with all three effects included, where a = 10 R⊙, 20 R⊙, 40 R⊙, 80 R⊙ at a time between two thermal pulses (t = 3500 yr). |
5. Conclusions and outlook
By modifying a TPAGB star with a degenerate CO core of 0.976 M⊙ and an envelope of 0.6 M⊙, we used a very simple method to perform 1D hydrostatic simulations with MESA to model the structure of a massive CE in the CEW model. We first individually examined the role of the extra heating energy, the companion’s gravity and the rotation of the envelope, and the combined effects for different assumed binary separations. The modified TPAGB star looks similar to a canonical TPAGB star, but has a smaller radius, a higher effective temperature, and a higher surface luminosity. These changes are mainly caused by the addition of the companion’s gravity, the dominant effect among the three considered. The modified TPAGB star is more stable than a canonical TPAGB star based on our current conservative assumptions. We also found that the local mixing length may significantly exceed the local radius, indicating a limitation of MLT as treated in MESA.
Because the current massive CE model implies a rather short spiral-in timescale, it is clear that one has to consider systems with lower CE masses and model the initial build-up of the CE more realistically. In addition, hydrodynamical effects need to be included because they are particularly important in the early phases of building up the envelope. We have already initiated studies along these lines and will report the results in due course.
Here the centrifugal force is relative to the centre of mass of the binary system rather than to the core centre; otherwise, it would be possible for the centrifugal force to locally exceed gravity, which would lead to a breakdown of the stellar-structure code.
In the original work, Meyer & Meyer-Hofmeister (1979) set this equal to the mixing length.
Acknowledgments
We are grateful to the referee, Christopher Tout, for his detailed comments which help us to improve the manuscript greatly. This work was partly supported by the NSFC (Nos. 11973080 and 11733008), and Yunnan Foundation (Nos. 2015HB096 and 2017HC018). X. M. thanks the support by Yunnan Ten Thousand Talents Plan – Young & Elite Talents Project.
References
- Blöcker, T. 1995, A&A, 297, 727 [NASA ADS] [Google Scholar]
- Clayton, M., Podsiadlowski, P., Ivanova, N., & Justham, S. 2017, MNRAS, 470, 1788 [NASA ADS] [CrossRef] [Google Scholar]
- Dilday, B., Howell, D. A., Cenko, S. B., et al. 2012, Science, 337, 942 [NASA ADS] [CrossRef] [Google Scholar]
- Freytag, B., Liljegren, S., & Höfner, S. 2017, A&A, 600, A137 [NASA ADS] [CrossRef] [EDP Sciences] [Google Scholar]
- Hachisu, I., Kato, M., & Nomoto, K. 1996, ApJ, 470, L97 [NASA ADS] [CrossRef] [Google Scholar]
- Hachisu, I., Kato, M., Nomoto, K., & Umeda, H. 1999, ApJ, 519, 314 [NASA ADS] [CrossRef] [Google Scholar]
- Hamann, W.-R., Peña, M., Gräfener, G., & Ruiz, M. T. 2003, A&A, 409, 969 [NASA ADS] [CrossRef] [EDP Sciences] [Google Scholar]
- Han, Z., & Podsiadlowski, P. 2004, MNRAS, 350, 1301 [NASA ADS] [CrossRef] [Google Scholar]
- Han, Z., Podsiadlowski, P., & Eggleton, P. 1994, MNRAS, 270, 121 [NASA ADS] [CrossRef] [Google Scholar]
- Hillebrandt, W., Kromer, M., Röpke, F. K., & Ruiter, A. J. 2013, Front. Phys., 8, 116 [Google Scholar]
- Höfner, S., & Olofsson, H. 2018, A&ARv, 26, 1 [NASA ADS] [CrossRef] [Google Scholar]
- Iaconi, R., De Marco, O., Passy, J.-C., & Staff, J. 2018, MNRAS, 477, 2349 [NASA ADS] [CrossRef] [Google Scholar]
- Iben, Jr., I., & Tutukov, A. V. 1984, ApJS, 54, 335 [NASA ADS] [CrossRef] [Google Scholar]
- Ivanova, N. 2018, ApJ, 858, L24 [NASA ADS] [CrossRef] [Google Scholar]
- Ivanova, N., Justham, S., Chen, X., et al. 2013, A&ARv, 21, 59 [Google Scholar]
- Kippenhahn, R., & Weigert, A. 1994, Stellar Structure and Evolution (New York: Springer-Verlag) [Google Scholar]
- Kobayashi, C., Tsujimoto, T., Nomoto, K., Hachisu, I., & Kato, M. 1998, ApJ, 503, L155 [NASA ADS] [CrossRef] [Google Scholar]
- Maoz, D., Mannucci, F., & Nelemans, G. 2014, ARA&A, 52, 107 [NASA ADS] [CrossRef] [Google Scholar]
- Marigo, P. 1998, A&A, 340, 463 [NASA ADS] [Google Scholar]
- Matteucci, F., & Greggio, L. 1986, A&A, 154, 279 [NASA ADS] [Google Scholar]
- Meng, X., & Li, J. 2019, MNRAS, 482, 5651 [NASA ADS] [CrossRef] [Google Scholar]
- Meng, X., & Podsiadlowski, P. 2017, MNRAS, 469, 4763 [NASA ADS] [CrossRef] [Google Scholar]
- Meng, X., & Podsiadlowski, P. 2018, ApJ, 861, 127 [NASA ADS] [CrossRef] [Google Scholar]
- Meng, X., & Yang, W. 2010, MNRAS, 401, 1118 [NASA ADS] [CrossRef] [Google Scholar]
- Meyer, F., & Meyer-Hofmeister, E. 1979, A&A, 78, 167 [NASA ADS] [Google Scholar]
- Nomoto, K. 1982, ApJ, 253, 798 [NASA ADS] [CrossRef] [Google Scholar]
- Nomoto, K., Nariai, K., & Sugimoto, D. 1979, PASJ, 31, 287 [NASA ADS] [Google Scholar]
- Nomoto, K., Thielemann, F.-K., & Yokoi, K. 1984, ApJ, 286, 644 [Google Scholar]
- Patat, F., Chandra, P., Chevalier, R., et al. 2007, Science, 317, 924 [NASA ADS] [CrossRef] [EDP Sciences] [PubMed] [Google Scholar]
- Paxton, B., Bildsten, L., Dotter, A., et al. 2011, ApJS, 192, 3 [Google Scholar]
- Paxton, B., Cantiello, M., Arras, P., et al. 2013, ApJS, 208, 4 [NASA ADS] [CrossRef] [Google Scholar]
- Paxton, B., Marchant, P., Schwab, J., et al. 2015, ApJS, 220, 15 [Google Scholar]
- Paxton, B., Schwab, J., Bauer, E. B., et al. 2018, ApJS, 234, 34 [NASA ADS] [CrossRef] [EDP Sciences] [Google Scholar]
- Peña, M., Ruiz, M. T., Rojo, P., Torres-Peimbert, S., & Hamann, W.-R. 2008, ApJ, 680, L109 [NASA ADS] [CrossRef] [Google Scholar]
- Perlmutter, S., Aldering, G., Goldhaber, G., et al. 1999, ApJ, 517, 565 [NASA ADS] [CrossRef] [Google Scholar]
- Piersanti, L., Cassisi, S., Iben, Jr., I., & Tornambé, A. 2000, ApJ, 535, 932 [NASA ADS] [CrossRef] [Google Scholar]
- Podsiadlowski, P., Joss, P. C., & Hsu, J. J. L. 1992, ApJ, 391, 246 [NASA ADS] [CrossRef] [Google Scholar]
- Prieto, J. L., Stanek, K. Z., & Beacom, J. F. 2008, ApJ, 673, 999 [NASA ADS] [CrossRef] [Google Scholar]
- Reimers, D. 1975, Mem. Soc. R. Sci. Liege, 8, 369 [NASA ADS] [Google Scholar]
- Riess, A. G., Filippenko, A. V., Challis, P., et al. 1998, AJ, 116, 1009 [NASA ADS] [CrossRef] [Google Scholar]
- Rodney, S. A., Riess, A. G., Scolnic, D. M., et al. 2015, AJ, 150, 156 [NASA ADS] [CrossRef] [Google Scholar]
- Sabach, E., Hillel, S., Schreier, R., & Soker, N. 2017, MNRAS, 472, 4361 [NASA ADS] [CrossRef] [Google Scholar]
- Shen, K. J., & Bildsten, L. 2007, ApJ, 660, 1444 [NASA ADS] [CrossRef] [Google Scholar]
- Sternberg, A., Gal-Yam, A., Simon, J. D., et al. 2011, Science, 333, 856 [NASA ADS] [CrossRef] [Google Scholar]
- Taam, R. E., & Sandquist, E. L. 2000, ARA&A, 38, 113 [NASA ADS] [CrossRef] [Google Scholar]
- Tutukov, A. V., & Yungelson, L. R. 1981, Nauchnye Informatsii, 49, 3 [NASA ADS] [Google Scholar]
- Wang, B., & Han, Z. 2012, New A Rev., 56, 122 [Google Scholar]
- Webbink, R. F. 1984, ApJ, 277, 355 [NASA ADS] [CrossRef] [Google Scholar]
- Whelan, J., & Iben, Jr., I. 1973, ApJ, 186, 1007 [NASA ADS] [CrossRef] [Google Scholar]
- Woitke, P. 2006, A&A, 452, 537 [NASA ADS] [CrossRef] [EDP Sciences] [Google Scholar]
All Figures
|
Fig. 1. Schematic diagram illustrating the initial equivalent model during the CE phase. The envelope is divided into three regions, the inner co-rotating region (blue), the outer differentially rotating region (yellow), and a transition region (light red) at the bottom of the outer region. The CO core represents the CO WD in the CEW model, in which stable hydrogen burning and helium shell flashes adjust themselves just as in a normal TPAGB star. |
| In the text | |
|
Fig. 2. Ratio of the equivalent gravitational constant to the Newtonian gravitational constant as a function of local radius for a = 40 R⊙ and d = 2 R⊙. |
| In the text | |
|
Fig. 3. Distributions of ϵex for a = 10 R⊙, 20 R⊙, 40 R⊙, 80 R⊙. |
| In the text | |
|
Fig. 4. Evolution of the effective temperature, Teff; the luminosity, L; the radius, R; and the time interval between two adjacent thermal pulses for the canonical TPAGB star (cyan solid line) and the cases where only the effect of extra heating (red dotted line), rotation (blue dashed line), and the companion’s gravity (green dash-dot line) are considered separately. The right panels show enlargements of the grey boxes in the left panels. |
| In the text | |
|
Fig. 5. Profiles of the local density, ρ; temperature, T; pressure, P; and specific entropy, S, in the envelopes of the canonical TPAGB star (cyan solid line) and the cases with only the effect of extra heating (red dotted line), rotation (blue dashed line), and the companion’s gravity (green dash-dot line) at a point between two thermal pulses (t = 3500 yr). In each panel the inset shows an enlargement of the area within the grey box. |
| In the text | |
|
Fig. 6. Profiles of the first adiabatic exponent, Γ1, and the ratio of the local mixing length to the local radius, l/r, in the envelopes of the canonical TPAGB star (cyan solid line) and the cases with only the effect of the extra heating (red dotted line), rotation (blue dashed line), and the companion’s gravity (green dash-dot line) included at a time between two thermal pulses (t = 3500 yr). The horizontal dark solid line in panel a represents the critical |
| In the text | |
|
Fig. 7. Evolution of the effective temperature, Teff; the luminosity, L; the radius, R; and the time interval between two adjacent pulses for the canonical TPAGB star (cyan point line) and the cases with all three effects and a = 10 R⊙ (blue solid line), 20 R⊙ (green dashed line), 40 R⊙ (red dash-dot line), and 80 R⊙ (black dotted line), respectively. The right panels are enlargements of the grey boxes in the left panels. |
| In the text | |
|
Fig. 8. Profiles of Γ1 and l/r in the envelopes of the canonical TPAGB star (cyan solid line) and the cases with all three effects included and a = 10 R⊙ (blue solid line), 20 R⊙ (green dashed line), 40 R⊙ (red dash-dot line), and 80 R⊙ (black dotted line) at a time between two thermal pulses (t = 3500 yr). The horizontal dashed line in panel a is the critical |
| In the text | |
|
Fig. 9. Profiles of the local density, ρ, and the convective velocity, Vc, in the envelopes of the canonical TPAGB star (cyan solid line) and the modified TPAGB star with all three effects included and a = 10 R⊙ (blue solid line), 20 R⊙ (green dashed line), 40 R⊙ (red dash-dot line), and 80 R⊙ (black dotted line) at a time between two thermal pulses (t = 3500 yr). The magenta dashed curves labelled “MP17 value” are the average density, |
| In the text | |
|
Fig. 10. Spiral-in timescale, ts, for the modified TPAGB star with all three effects included, where a = 10 R⊙, 20 R⊙, 40 R⊙, 80 R⊙ at a time between two thermal pulses (t = 3500 yr). |
| In the text | |
Current usage metrics show cumulative count of Article Views (full-text article views including HTML views, PDF and ePub downloads, according to the available data) and Abstracts Views on Vision4Press platform.
Data correspond to usage on the plateform after 2015. The current usage metrics is available 48-96 hours after online publication and is updated daily on week days.
Initial download of the metrics may take a while.