Fig. 8.
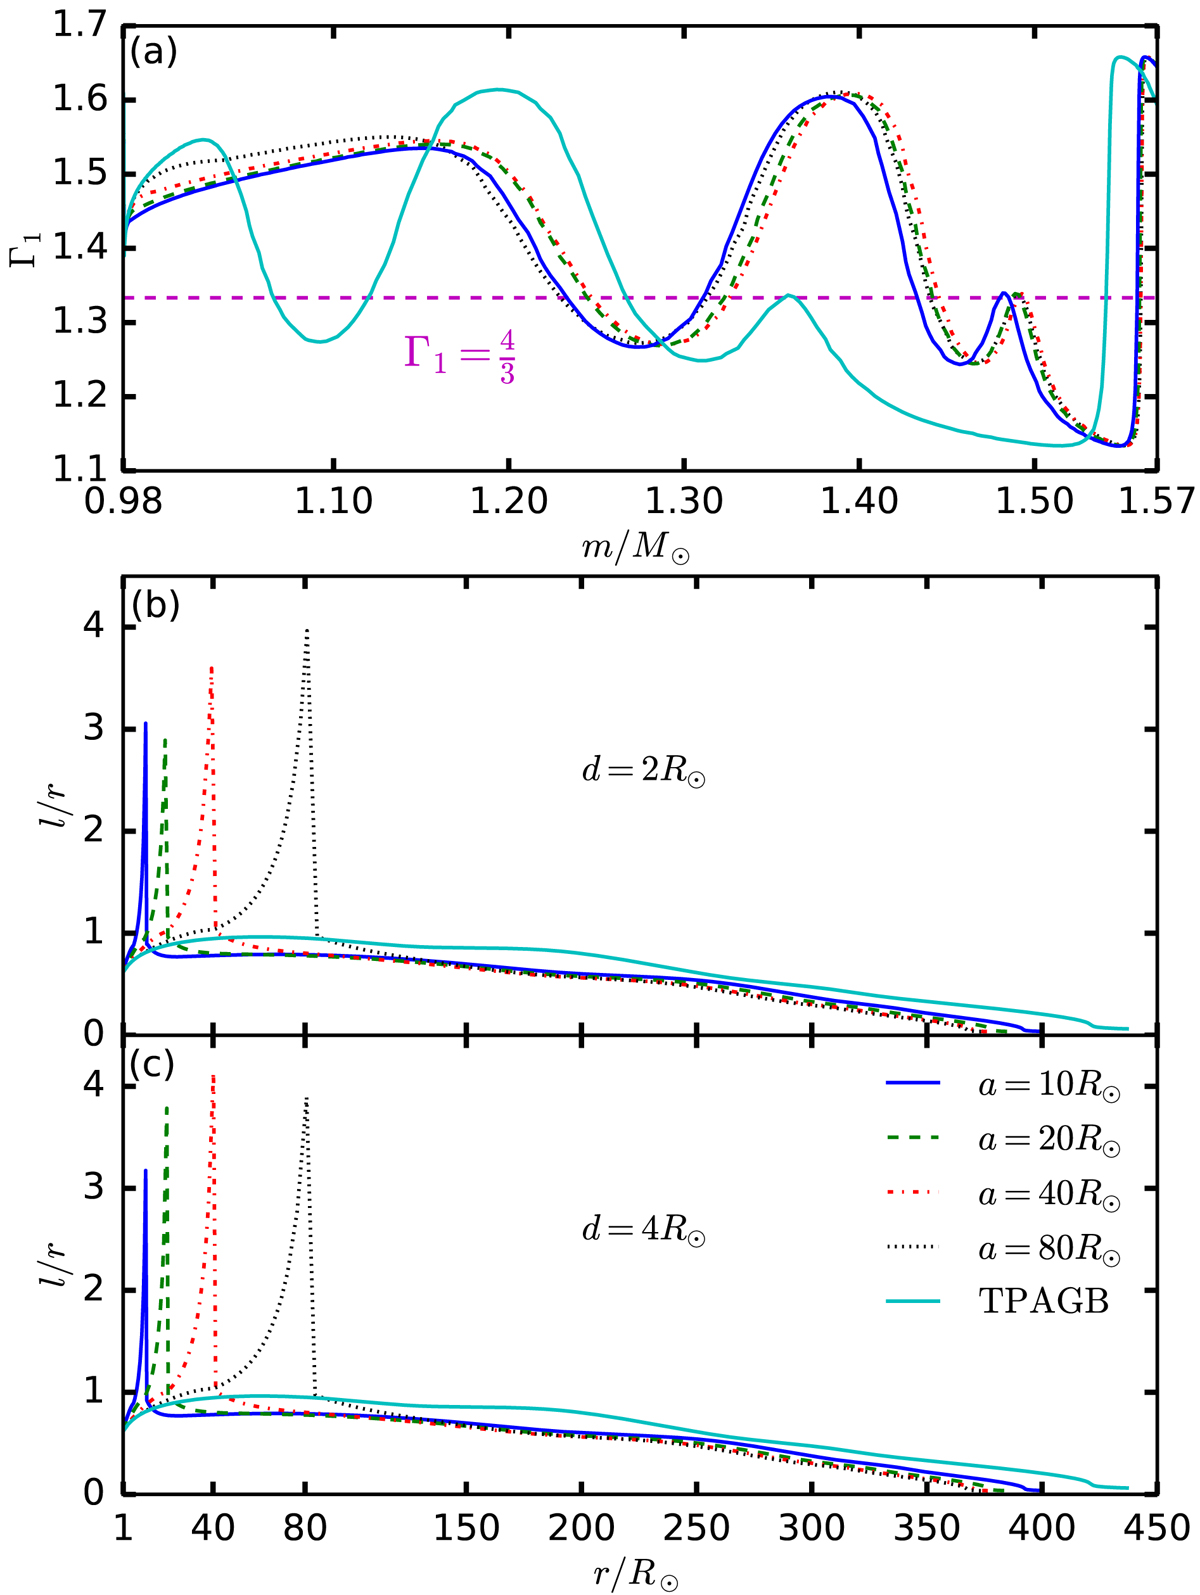
Profiles of Γ1 and l/r in the envelopes of the canonical TPAGB star (cyan solid line) and the cases with all three effects included and a = 10 R⊙ (blue solid line), 20 R⊙ (green dashed line), 40 R⊙ (red dash-dot line), and 80 R⊙ (black dotted line) at a time between two thermal pulses (t = 3500 yr). The horizontal dashed line in panel a is the critical ![]() . Panels b and c are similar, but for different widths of transition region.
. Panels b and c are similar, but for different widths of transition region.
Current usage metrics show cumulative count of Article Views (full-text article views including HTML views, PDF and ePub downloads, according to the available data) and Abstracts Views on Vision4Press platform.
Data correspond to usage on the plateform after 2015. The current usage metrics is available 48-96 hours after online publication and is updated daily on week days.
Initial download of the metrics may take a while.