Fig. 6.
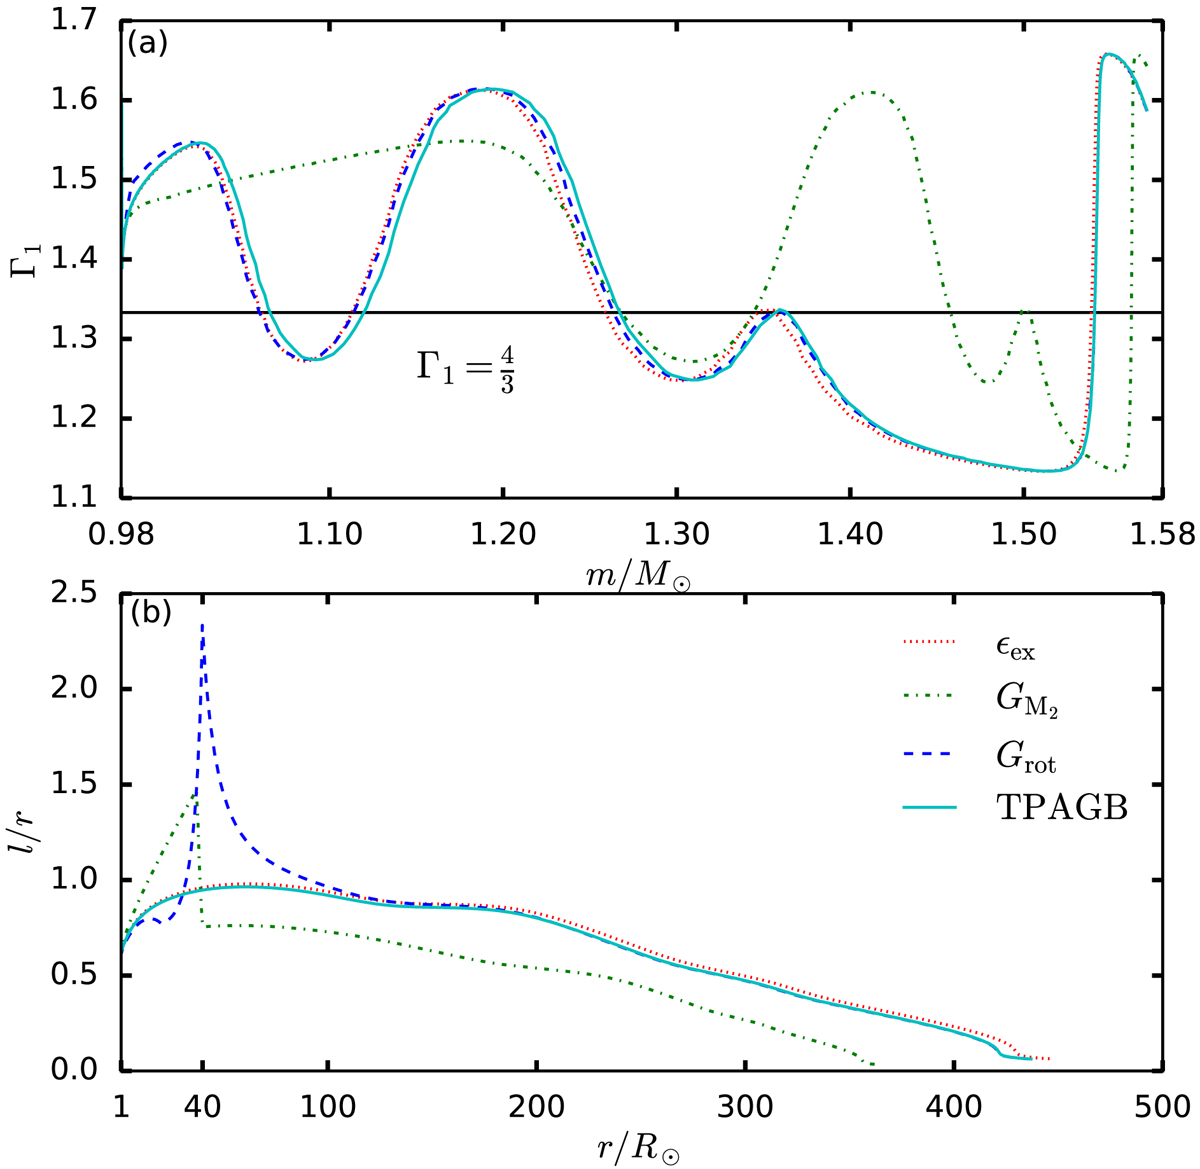
Profiles of the first adiabatic exponent, Γ1, and the ratio of the local mixing length to the local radius, l/r, in the envelopes of the canonical TPAGB star (cyan solid line) and the cases with only the effect of the extra heating (red dotted line), rotation (blue dashed line), and the companion’s gravity (green dash-dot line) included at a time between two thermal pulses (t = 3500 yr). The horizontal dark solid line in panel a represents the critical ![]() .
.
Current usage metrics show cumulative count of Article Views (full-text article views including HTML views, PDF and ePub downloads, according to the available data) and Abstracts Views on Vision4Press platform.
Data correspond to usage on the plateform after 2015. The current usage metrics is available 48-96 hours after online publication and is updated daily on week days.
Initial download of the metrics may take a while.