| Issue |
A&A
Volume 628, August 2019
|
|
|---|---|---|
| Article Number | A117 | |
| Number of page(s) | 14 | |
| Section | Numerical methods and codes | |
| DOI | https://doi.org/10.1051/0004-6361/201935829 | |
| Published online | 14 August 2019 | |
The GIST pipeline: A multi-purpose tool for the analysis and visualisation of (integral-field) spectroscopic data⋆
1
European Southern Observatory, Karl-Schwarzschild-Str. 2, 85748 Garching bei München, Germany
e-mail: This email address is being protected from spambots. You need JavaScript enabled to view it.
2
Ludwig-Maximilians-Universität, Professor-Huber-Platz 2, 80539 Munich, Germany
3
Instituto de Astrofísica de Canarias, Calle Vía Láctea s/n, 38205 La Laguna, Tenerife, Spain
4
Departamento de Astrofísica, Universidad de La Laguna, 38200 La Laguna, Tenerife, Spain
5
Armagh Observatory and Planetarium, College Hill, Armagh BT61 9DG, UK
6
Center for Astrophysics Research, University of Hertfordshire, College Lane, AL10 9AB Hatfield, UK
7
INAF-Osservatorio Astronomico di Capodimonte, Via Moiariello 16, 80131 Napoli, Italy
8
Max-Planck-Institut für Astrophysik, Karl-Schwarzschild-Str. 1, 85748 Garching bei München, Germany
9
Astrophysics Research Center, School of Mathematics and Physics, Queen’s University Belfast, Belfast BT7 INN, UK
10
Max-Planck-Institut fur Astronomie, Konigstuhl 17, 69117 Heidelberg, Germany
11
Leibniz-Institut für Astrophysik Potsdam (AIP), An der Sternwarte 16, 14480 Potsdam, Germany
12
Observatorio Astronómico Nacional (IGN), C/ Alfonso XII 3, 28014 Madrid, Spain
13
Departamento de Física Teórica, Universidad Autónoma de Madrid, 28049 Cantoblanco, Spain
14
Carnegie Observatories, 813 Santa Barbara St., Pasadena, CA 91101, USA
Received:
3
May
2019
Accepted:
7
June
2019
Abstract
We present a convenient, all-in-one framework for the scientific analysis of fully reduced, (integral-field) spectroscopic data. The Galaxy IFU Spectroscopy Tool (GIST) is entirely written in Python 3 and conducts all the steps from the preparation of input data to the scientific analysis and to the production of publication-quality plots. In its basic set-up, it extracts stellar kinematics, performs an emission-line analysis, and derives stellar population properties from full spectral fitting and via the measurement of absorption line-strength indices by exploiting the well-known pPXF and GandALF routines, where the latter has now been implemented in Python. The pipeline is not specific to any instrument or analysis technique and provides easy means of modification and further development, thanks to its modular code architecture. An elaborate, Python-native parallelisation is implemented and tested on various machines. The software further features a dedicated visualisation routine with a sophisticated graphical user interface. This allows an easy, fully interactive plotting of all measurements, spectra, fits, and residuals, as well as star formation histories and the weight distribution of the models. The pipeline has been successfully applied to both low- and high-redshift data from MUSE, PPAK (CALIFA), and SINFONI, and to simulated data for HARMONI and WEAVE and is currently being used by the TIMER, Fornax3D, and PHANGS collaborations. We demonstrate its capabilities by applying it to MUSE TIMER observations of NGC 1433.
Key words: methods: data analysis / techniques: spectroscopic / galaxies: individual: NGC 1433 / galaxies: stellar content / galaxies: kinematics and dynamics / galaxies: structure
© ESO 2019
1. Introduction
Over the past decades, spectroscopic observations have provided significant insights into the fundamental properties of galaxies. In particular, the measurement of stellar and gaseous motions as well as the inference of stellar population properties have made substantial contributions to our understanding of the formation and evolution of galaxies.
With the introduction of the first integral-field spectrographs (IFS, see e.g. Bacon et al. 1995), it became feasible to perform such observations in a spatially resolved manner and for larger samples of galaxies. The SAURON survey (Bacon et al. 2001; de Zeeuw et al. 2002) was one of the first projects to make extensive use of this technology. Based on their representative sample of 72 nearby early-type galaxies, the project investigated stellar and gaseous kinematics (Emsellem et al. 2004; Sarzi et al. 2006; Falcón-Barroso et al. 2006; Ganda et al. 2006) and stellar population properties (Peletier et al. 2007; Kuntschner et al. 2010), and distinguished between fast and slow rotating early-type galaxies (Emsellem et al. 2007). Subsequently, the ATLAS3D project (Cappellari et al. 2011) continued this endeavour by further investigating kinematic properties, for instance the global specific angular momentum (Emsellem et al. 2011), based on a volume complete sample of 260 early-type galaxies. The CALIFA survey (Sánchez et al. 2012) advanced these previous studies towards a morphologically unbiased sample of 667 galaxies. In addition, it provides a unique combination of a large spatial coverage of a few effective radii and high spatial sampling (see also García-Benito et al. 2015). Other surveys observe even larger samples: while the SAMI survey (Croom et al. 2012; Bryant et al. 2015) includes ∼3000 galaxies across different environments, MaNGA (Bundy et al. 2015) will contain approximately 10 000 nearby galaxies. Most recently, these projects are being complemented by IFS studies of local galaxies in unprecedented spatial resolution (e.g. MUSE, Bacon et al. 2010). For instance, the TIMER project (Gadotti et al. 2019) analyses the central structures of 24 barred local disc galaxies in order to study the formation histories of these structures and infer constraints on the related secular evolution processes. Fornax3D (Sarzi et al. 2018; Iodice et al. 2019) investigates mostly early-type galaxies in the Fornax cluster environment, spatially covering galaxies up to four effective radii. The PHANGS survey (Leroy et al., in prep.)1 aims to connect the physics of gas and star formation with the large-scale galactic structure by complementing IFS data from MUSE with interferometric data from ALMA.
Spatially resolved spectroscopic data contain an outstanding amount of information. It is not only possible to measure the stellar motions and perform an emission-line analysis, but also to infer star formation histories. However, the extraction of these quantities from the science-ready IFS data is very complex, and sophisticated analysis techniques are indispensable. Over time a set of commonly used and well-tested techniques for this analysis has emerged. After various pioneering works on the measurement of stellar kinematics since the early 1970s (see e.g. Simkin 1974; Sargent et al. 1977; Tonry & Davis 1979; Franx et al. 1989; Bender 1990; Rix & White 1992; Kuijken & Merrifield 1993; van der Marel & Franx 1993; Statler 1995; Merritt 1997), the vast majority of recent studies exploit the penalised pixel-fitting code pPXF (Cappellari & Emsellem 2004; Cappellari 2017) to infer a stellar line-of-sight velocity distribution (LOSVD). Similarly, the Gas and Absorption Line Fitting (GandALF) software (Sarzi et al. 2006; Falcón-Barroso et al. 2006) as well as the pyPARADISE tool (Walcher et al. 2015; Husemann et al. 2016) are methods widely used to conduct a thorough emission-line analysis. Non-parametric star formation histories can, for instance, be extracted with MOPED (Heavens et al. 2000), pPXF, STARLIGHT (Cid Fernandes et al. 2005), STECKMAP (Ocvirk et al. 2006a,b), VESPA (Tojeiro et al. 2007), as well as ULySS (Koleva et al. 2009).
Such a well-established set of sophisticated techniques provides a good base for the analysis of spectroscopic data. Moreover, the application of these techniques to actual data is, in principle, not difficult, as implementations of these codes are widely available. However, in practice this task soon becomes very tedious; the use of different IFS instruments, spectral template libraries, and analysis set-ups in the context of different scientific objectives and surveys add some inconvenience to the day-to-day usage of these techniques. Further complications arise if a very large sample of galaxies makes use of an automated pipeline necessary, especially in light of the tremendous amount of spectra provided by state-of-the-art instruments (e.g. MUSE) and therefore the inevitable requirement of parallelised software.
We aim to overcome these inconveniences by introducing the Galaxy IFU Spectroscopy Tool (GIST), which is modular and general enough to be easily applied to data from all existing IFS instruments and in the context of different scientific objectives and surveys. In particular, the code architecture provides easy means of modification and expansion, while being a convenient all-in-one framework for the scientific analysis of fully reduced IFS data. In addition, the software package features sophisticated visualisation routines and employs a well-tested parallelisation. While this is not the first time a pipeline of this sort has been developed (e.g. Pipe3D, Sánchez et al. 2016; LZIFU, Ho et al. 2016 or the MaNGA pipeline, Westfall et al. 2019), it is the first time one has been offered publicly with a wide range of built-in configurations for several instruments and surveys. The large scientific community that is in need of such a multi-purpose IFS analysis tool is highlighted by the fact that the GIST pipeline is already being employed by the TIMER, Fornax3D, and PHANGS collaborations. In addition, various researchers are applying the code to both low- and high-redshift data from MUSE, PPAK (CALIFA), and SINFONI (Eisenhauer et al. 2003), and to simulated data for HARMONI (Thatte et al. 2010) and WEAVE IFU modes (Dalton et al. 2012).
This paper is organised as follows. In Sect. 2 we introduce the core design principles of the pipeline, its code architecture and workflow, and the most important aspects of the implementations. In Sect. 3 we apply the pipeline to TIMER data of NGC 1433 obtained with the MUSE spectrograph. We finish with a summary of this work in Sect. 4.
2. Pipeline
2.1. Core design principles
The specific pipeline architecture is designed with the following high-level objectives:
Convenience. Our aim is to provide a convenient, all-in-one framework for the scientific analysis of fully reduced (integral-field) spectroscopic data. This includes all steps from the read-in and preparation of input data over the several analysis steps to the production of well-structured output tables and publication-quality plots. Such a framework not only accelerates and simplifies the analysis, but also assures the consistency of the analysis throughout large data samples.
Extensive functionality. The basic version of the GIST pipeline extracts stellar kinematics and non-parametric star formation histories by exploiting the pPXF routine (Cappellari & Emsellem 2004; Cappellari 2017), determines gaseous kinematics and emission-line fluxes with the GandALF procedure (Sarzi et al. 2006; Falcón-Barroso et al. 2006), and measures line strength indices, as well as the corresponding single-stellar population equivalent population properties (SSP; Kuntschner et al. 2006; Martín-Navarro et al. 2018). These methods can be executed in a multitude of different flavours and configurations (see Sect. 2.3.1).
Flexibility. This code is not specific to any instrument, fitting procedure, or scientific project. Instead, the implementation features a high level of flexibility, as we aim to provide an analysis framework that suits the needs of a variety of scientific objectives across various collaborations. This flexibility is evident given that the pipeline is capable of handling data from different instruments and its execution can be tailored to reflect a variety of different flavours in either interactive or non-interactive batch processing manner.
Modifiability/Expandability. Regardless of how extensive and flexible an analysis pipeline is, it is virtually impossible for one particular design to satisfy all conceivable scientific requirements. Thus, it is necessary to provide easy means of modification of the code that will allow it to tackle specific problems. This can be achieved by using a modular architecture while keeping the source code as clean and readable as possible. Moreover, this makes it straightforward for the user to expand the pipeline by adding user-defined modules.
Visualisation. The GIST pipeline outputs various high-level data products. However, while visualisation routines for input IFS cubes are widely available (e.g. QFitsView2), the software capable of displaying the data products is still limited (e.g. E3D3, PINGSoft4, MARVIN5), and it is often specific for an instrument or project. These visualisation routines are important in order to simplify the inspection of the output and facilitate the immediate monitoring of observed spectra, their best fits, and residuals. Thus, in this software package we provide the dedicated visualisation routine Mapviewer, specifically designed to access all data products of this pipeline. To this end, it exploits a sophisticated graphical user interface with fully interactive plots. For instance, the spectra, their corresponding fits and residuals, the star formation histories, and the weight distribution of the models in a particular bin can be plotted by only a simple mouse-click on the given bin in the map. The Mapviewer is highly performance optimised and thus capable of handling the bulk of data products without noticeable interruption.
Performance. State-of-the-art IFS instruments output an enormous number of spectra per pointing. This implies significant computational expense for the analysis of the data, in particular when larger samples of galaxies are considered. This necessitates the use of parallelised software and large, cluster-scale computing resources. In particular, a Python-native parallelisation, based on its multiprocessing module, is implemented to conduct the analysis on multiple spectra simultaneously. This parallelisation has been successfully tested with up to 40 processors on various machines and scales linearly.
The code is publicly available through a dedicated webpage6. Additional analysis modules, for instance the inclusion of STECKMAP and pyPARADISE, will be done in the future. We encourage the community to put forward their own input on the future development of the code, in particular by creating their own specific modules.
This paper intends to give an overview of the extensive capabilities of the code and is complemented by online documentation6, which includes detailed information on the practical use of the pipeline. Therefore we describe its download and installation, and provide a dedicated tutorial. In addition, the documentation gives various examples of the pipeline usage and instructions on its modification.
Although we provide this pipeline as a convenient, all-in-one framework for the analysis of IFS data, it is of fundamental importance that the user understands exactly how the involved analysis methods work. We warn that the improper use of any of these analysis methods, whether executed within the framework of the GIST pipeline or not, will likely result in spurious or erroneous results, and their proper use is solely the responsibility of the user. Likewise, the user should be fully aware of the properties of the input data before intending to derive high-level data products. Therefore, this pipeline should not be simply adopted as a “black box”. To this end, we urge all users to become familiar with the input data and the analysis methods, and with their implementation in this pipeline.
2.2. Pipeline architecture and workflow
To achieve the design goals presented in the previous section, the pipeline structure has three major elements: preparatory operations, main analysis procedures, and visualisation routines. Each of these parts consists of various individual modules. Figure 1 illustrates the code architecture. In Sect. 2.3 we present an in-depth discussion of the implementation of each of these modules.
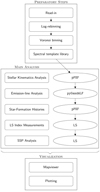 |
Fig. 1. Flowchart illustrating the architecture of the pipeline. The code is structured in three parts: preparatory operations, main analysis procedures, and visualisation routines. Each of these parts consists of various individual modules. |
The four major preparatory steps are the read-in of the fully reduced, science-ready data cube; the logarithmic rebinning of the spectra in the wavelength dimension (to obtain spectra that are linearly binned in velocity space); the Voronoi binning of the spectra in the spatial dimensions (using the routine of Cappellari & Copin 2003 to obtain integrated spectra of approximately constant signal-to-noise ratio); and the necessary preparation steps in regards to the spectral template library. These preparatory steps need be executed regardless of any further analysis, and are not repeated afterwards.
The main analysis section consists of four modules: two of these modules exploit the pPXF routine in order to extract stellar kinematics (hereafter PPXF module) and non-parametric star formation histories (hereafter SFH module). Emission-line kinematics and fluxes are extracted by calling a new Python implementation of the original GandALF procedure (hereafter GANDALF module). Finally, line strength indices and their corresponding SSP-equivalent population properties are measured with the routines already used by Kuntschner et al. (2006) and Martín-Navarro et al. (2018, hereafter LS module). These analysis modules are simply interfaces around the implementations of the mentioned analysis techniques, mainly acting as an interface to the pipeline and handling the input and output. These four modules are fully independent, but may use each other’s results as input. In other words, the modules can be turned on and off, or even be replaced by different, user-defined modules without affecting the overall integrity of the pipeline. As these modules are independent, the parallelisation is implemented in each module individually (see Sect. 2.3.1 for a full discussion on the configuration options).
Finally, visualisation routines complement the analysis framework. Publication-quality plots of all results are automatically generated during the analysis. In addition, all plotting routines can also be executed independently from the analysis pipeline in order to allow the user any specific plotting preferences. A fully interactive visualisation method is provided by the routine Mapviewer, as discussed in Sect. 2.1. A screenshot of this routine can be found in Fig. 2.
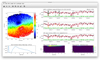 |
Fig. 2. Screenshot of the visualisation software Mapviewer in its default layout, illustrating the results of the galaxy NGC 1433. High-level data products of previous analysis runs of the GIST pipeline can be selected and displayed through the items in the menu bar. A map of the selected quantity is displayed in the upper left panel of the window. Individual bins in this map can be selected by simply performing a mouse-click on the map or providing the bin ID. The selected bin is subsequently shown by a red circle, while the other panels display more detailed information. In particular, the upper three panels on the right side of the window display observed spectra, and the fits generated by the PPXF module (first panel), GANDALF module (second panel), and SFH module (third panel). Observed spectra are displayed in black, fits in red, emission-subtracted continuum spectra in orange, and residuals in green. Masked spectral regions are highlighted in grey. The three bottom panels display further information on the stellar population properties: non-parametric star formation histories are displayed in the left panel, while the centre and right panels illustrate the weights of the templates in the age-metallicity-alpha grid. The corresponding quantitative results of the measurements are provided next to each panel. Different layouts of the Mapviewer routine are available to highlight the results of the line strength module. |
In addition, the pipeline workflow is optimised in two further ways: firstly, if the user has set unreasonable configuration options, the pipeline will print a warning message and skip the affected module or, if unavoidable, the analysis of the galaxy in consideration. Secondly, the code checks if some of the results are already available in the output directory, thanks to a previous partial run of the GIST pipeline, for instance. If these outputs are detected, the corresponding analysis modules are not executed again.
The automatic determination of whether or not a module has already been executed results in several advantageous features: firstly, it allows the workflow to stop after each analysis module and to continue later. For instance, it is possible to first extract stellar kinematics for a given sample of galaxies, then the gaseous kinematics in a second step, and finally any of the population properties without unnecessarily repeating any operation. Furthermore, this allows the validation of the outcome of any of the previous steps of the workflow before its continuation. In other words, this makes it possible to use the pipeline in a highly interactive manner, which might be helpful for small samples with a large number of spectra per galaxy.
Secondly, this ensures the stability of the workflow against any unforeseen problems (i.e. numerical issues). This is of particular importance if a user intends to use the code as a survey-level pipeline on a large sample of galaxies. The survey-level usage of the pipeline is further supported by the fact that the configuration file can, in principle, be machine generated and contain an arbitrarily large number of objects.
Thirdly, it supports the reutilisation of intermediate results. If the user plans to conduct several test runs on the same galaxy, for example to quantify the impact of the adopted line-spread function on the stellar kinematics, the results of the preparatory operations can be re-used. Similarly, these intermediate results can be modified to perform the analysis in a different manner. For instance, the user can modify the Voronoi map to conduct the analysis in manually defined apertures instead of Voronoi bins.
2.3. Pipeline implementation
2.3.1. Configuration
To provide the maximum convenience to the user, most of the configurations of the GIST pipeline are defined in one file. This file contains the main switches that state which analysis modules need to be executed, and contains the general settings and parameters, such as the instrument used, the wavelength range in consideration, the target signal-to-noise ratio for the Voronoi binning, and the selection of the spectral template library. In addition, more specific settings for any of the four analysis modules are provided. An overview of all configuration switches and a brief description of their functions is presented in Table 1. An in-depth description of the effect of these switches follows in this section.
Overview of all switches and parameters in the main configuration file of the GIST pipeline.
The line-spread function (LSF) of the data is stated by the user in a configuration file that simply contains two columns, defining the spectral resolution of the data at a given wavelength. The information is read-in and a linear interpolation function is generated. Thus, it is possible to reconstruct the spectral resolution at any wavelength. The spectral resolution of the template spectra is handled in a similar way. Spectral regions, which are masked in the analysis of the PPXF and SFH modules, are defined by the user in distinct files stating the wavelength and width of the spectral masks, respectively.
In addition to these files, there are only two more configuration files necessary, one specifying the emission lines to be masked or fitted during the analysis of the GANDALF module and another that states the wavelength bands of the absorption line strength measurements. These configurations are explained in detail in the context of their analysis modules below.
2.3.2. Preparatory steps
The read-in routine of the GIST pipeline performs five simple operations: it reads the already reduced, science-ready spectral data; it then shifts all spectra to their rest-frame wavelength while adapting their spectral resolution correspondingly (according to the configuration parameter REDSHIFT) and it shortens them to the wavelength range defined by the parameters LMIN and LMAX; it rejects spaxels that contain non-numbers (NaNs) or have a negative median flux. We note that these spaxels are not passed to the pipeline, so that the input and output cubes might not have an identical size. Finally, it computes the signal-to-noise ratio based on the variance spectra obtained during the data reduction or, if these are not available, exploits the der_snr-algorithm7 which estimates the signal-to-noise ratio S/N using the equations
 (1)
(1)
 (2)
(2)
with the signal S, the noise N, and the flux F at a spectral pixel i, where brackets represent the median. The pipeline is capable of handling data from any IFS instrument, and from long-slit or fibre-spectrographs if a read-in routine that conducts these five operations is provided. In the default version of the pipeline, read-in routines for the wide- and narrow-field modes of the MUSE spectrograph and for the V500 and V1200 modes of the PMAS/PPAK instrument are included. These read-in routines can be selected with the configuration switch IFU.
To run pPXF and GandALF, we first logarithmically rebin the spectra to have constant bins in velocity (instead of wavelength). This is implemented in the GIST pipeline by exploiting the log-rebinning function of pPXF (Cappellari & Emsellem 2004; Cappellari 2017).
The signal-to-noise ratio of the data is an essential factor in any fitting attempt. In the specific case of using pPXF to derive the line-of-sight velocity distribution (LOSVD) parametrised by the line-of-sight velocity v, velocity dispersion σ, and the higher-order Gauss-Hermite moments h3 and h4 (Gerhard 1993; van der Marel & Franx 1993), higher-order moments critically depend on the signal-to-noise ratio (see van der Marel & Franx 1993; Gadotti & de Souza 2005). Thus, the pipeline uses the Voronoi binning method of Cappellari & Copin (2003) to spatially bin the data. The resulting binned spectra have an approximately constant signal-to-noise ratio given by the parameter TARGET_SNR. We note that spaxels which surpass this target signal-to-noise ratio remain unbinned. In addition, a minimum signal-to-noise ratio threshold can be applied prior to the spatial binning. This threshold removes spaxels below the isophote level which has an average signal-to-noise ratio given by the parameter MIN_SNR and can thus avoid possible systematic effects in low surface brightness regions of the data.
Some IFS data suffer from spatial correlations of the noise between adjacent spaxels. These correlations can be introduced, for instance, by the combination of individual observations, spatial interpolation procedures in the reduction process, or a point-spread function which significantly surpasses the spatial pixel size of the instrument (see e.g. García-Benito et al. 2015; Sarzi et al. 2018). If multiple spectra with correlated noise are coadded, the noise of the resulting stacked spectrum will be underestimated. Depending on the quality of the data, it is of substantial importance to account for this effect in the Voronoi binning process. García-Benito et al. (2015) estimate the strength of these spatial correlations β by calculating the ratio of the real noise to the analytically expected noise as a function of the number of spaxels per bin N. They find this empirical relation (their Eq. (1)),
 (3)
(3)
where the slope α is a basic proxy for the strength of any correlations, if present, that need to be provided to the pipeline with the configuration parameter COVAR_VOR. For instance, in data release 2 of the CALIFA survey α is found to be 1.06 or 1.07 depending on the set-up of the instrument. To account for spatial correlations in the GIST pipeline, the analytically expected noise is corrected with the above formula during the Voronoi binning procedure. We note that the resulting Voronoi binning scheme is used throughout the analysis with the exception of the GANDALF module that can be run on either the Voronoi bins only or on all spaxels (see Sect. 2.3.4).
In line with the modular structure of the pipeline, spectral template libraries can be selected conveniently with the configuration parameter SSP_LIB. While the MILES library (Vazdekis et al. 2010) is included in this software package, other libraries can be provided by the user in distinct directories. We highlight that the GIST pipeline allows the user to pick not just a full set of the pre-loaded spectral template libraries, but also an object-specific subset of such template spectra. The spectra of the template library are read-in, shortened to conform with the spectral range of the observed spectra, and oversampled by a factor of two (Cappellari 2017). Moreover, the templates can be normalised to provide mass- or light-weighted results (parameter NORM_TEMP) and broadened from their intrinsic, spectral resolution to the one specified by the line-spread function of the particular instrument.
For the measurement of stellar population properties via full spectral fitting with pPXF, the compilation of the spectral library has further requirements. More specifically, pPXF necessitates that the templates are sorted in a three-dimensional cube of age, metallicity, and α-element enhancement, according to the population properties encoded in the filename of the templates. This is readily implemented in the pipeline for all libraries that follow the MILES naming convention. Thanks to the modularity of the pipeline, it is straightforward to expand this to distinct naming conventions by simply replacing the read-specific function in the SFH module.
2.3.3. Stellar kinematics analysis
The PPXF module utilises the penalised pixel-fitting (pPXF) method developed by Cappellari & Emsellem (2004) and advanced in Cappellari (2017, configuration switch PPXF). Its Python implementation derives the underlying galaxy stellar line-of-sight velocity distribution (LOSVD) parametrised in terms of the line-of-sight velocity v, velocity dispersion σ, and higher-order Gauss-Hermite moments (switch MOM; Gerhard 1993; van der Marel & Franx 1993). Briefly, the method convolves a non-negative linear combination of the given set of template library spectra with the LOSVD in pixel space by means of a least-squares minimisation seeking to find the set of best-fitting LOSVD parameters and the corresponding weights ascribed to the linear combination of templates library.
The regularisation of pPXF is turned off and the default value of the penalisation used. Additive (parameter ADEG) and multiplicative (parameter MDEG) Legendre polynomials can also be included in the fit to account for any potential deviations in the continuum shape between observed and template spectra or inaccuracies in the flux calibration.
In addition to the default functionality of pPXF, extensive Monte Carlo (MC) simulations can be performed to compute errors on the extracted quantities (parameter MC_PPXF). To this end, multiple realisations of the input spectra are created by adding random noise on the scale of the residual noise to the best-fitting result from the initial pPXF run. Subsequently, the pPXF fit is performed again in the same configuration, but without the penalisation term. The standard deviation of the resulting distribution of the measured quantities is saved as error. The formal errors on the initial fit, as returned by pPXF, are saved as well.
Moreover, the PPXF module computes maps of the λ parameter (Emsellem et al. 2007), which acts as a quantification of the projected specific angular momentum. Following their Eqs. (5) and (6), the parameter is defined as
 (4)
(4)
and measured in every spatial bin individually as
 (5)
(5)
with the galactocentric radius R and the flux F. We note that the summation is performed over each spaxel in the corresponding bin, using spaxel-level values for flux and radius and bin-level values for velocity and velocity dispersion. As this parameter depends on the galactocentric radius, the pipeline only outputs correct values of λ if the coordinates of the centre of the galaxy are passed with the configuration parameter ORIGIN. We note that the GIST pipeline computes the λ parameter in every spatial bin individually, in contrast to the aperture integrated quantities presented in Emsellem et al. (2007).
2.3.4. Emission-line analysis
For the measurement of gaseous kinematics, emission-line fluxes, and the computation of emission-free continuum spectra the GANDALF module facilitates a new Python implementation of the original GandALF procedure by Sarzi et al. (2006) and Falcón-Barroso et al. (2006), which is released together with this software package (hereafter pyGandALF; configuration switch GANDALF). There, the individual emission lines are treated as additional Gaussian templates and their velocities and velocity dispersions are searched for iteratively. These emission-line templates are linearly combined with the set of library spectral templates to solve for the best-fitting emission-line gaseous kinematics (i.e. velocity and velocity dispersion), their strengths (i.e. line amplitudes), and weights on the linear combination of the spectral template library. Such a procedure adequately accounts for both the gaseous emission lines and the underlying stellar continuum present in the spectra of some galaxies (Sarzi et al. 2006).
Following the original implementation of GandALF, both the GANDALF module and pyGandALF only fit emission lines that are specified by the user in the emission-line configuration file (see Table 2). In particular, this file states the wavelength of the line and whether the line is a singlet or doublet, and whether different sets of lines share the same kinematics or not. If specified in the emission-line configuration file, multiple emission-line components can be fitted to a single emission feature in order to reproduce non-Gaussian line profiles. For instance, in the presence of an outflow, a narrow emission line might be located on top of a very broad emission feature. In this case, the broad and the narrow component can be fitted independently, thus obtaining an improved fit and results on the two physically distinct components.
Overview of all switches and parameters in the emission-line configuration file of the GIST pipeline.
Initial guesses on the velocity (relative to the redshift given with the parameter REDSHIFT) and velocity dispersion are to be provided by the user in the emission-line configuration file. pyGandALF can compensate differences in the continuum from the galaxy and the templates by exploiting a two-component reddening correction (parameter REDDENING). As detailed in Oh et al. (2011) and also shown in Sarzi et al. (2018), this allows to construct maps for classical “screen-like” extinction affecting the entire galaxy spectrum in addition to maps for the reddening impacting only on the emission-line regions. Alternatively, if the REDDENING option is not used, the same order of multiplicative Legendre polynomials as for the PPXF module is applied in pyGandALF. Additive Legendre polynomials are not used, regardless of what is set in the configuration parameter ADEG. In addition, the GANDALF module is capable of correcting the spectra for Galactic extinction in the direction of the target. To this end, Galactic extinction values (e.g. from Schlegel et al. 1998) are passed with the configuration parameter EBmV and the spectra are de-reddened prior to the emission-line analysis by applying the model of Calzetti et al. (2000).
In addition to its measurement of gaseous kinematics, the GANDALF module also computes continuum spectra with subtracted emission lines (hereafter emission-subtracted spectra). A notable complication of this step is the determination of a threshold above which a line detection is considered significant. To this end, Sarzi et al. (2006) introduce the amplitude-to-residual noise ratio (A/rN) which quantifies how much the amplitude of an emission line surpasses the residual noise level of the spectrum, which can be used to justify this choice. In the default set-up of the GIST pipeline, the best-fitting emission-line templates are subtracted from the observed spectra, if this A/rN ratio (using the A/rN value of the main line for doublets of multiplets) exceeds the A/rN threshold defined in the emission-line configuration file (see Table 2). The impact of pegging lines together on the minimum A/rN values to robustly detect lines was initially discussed in Sarzi et al. (2006) in the case of SAURON observations, but a more detailed study is needed to robustly address this issue for more complicated line sets as observed within the MUSE wavelength range and for different kind of emission-line systems. Thanks to the modularity of the code, it is straightforward to implement different methods of the emission-line subtraction by simply changing one function in the GANDALF module. We note that we are currently in the process of developing more sophisticated criteria for the selection of such a detection threshold, and a more advanced treatment of the emission-line subtraction problem could be included in a future pipeline release.
2.3.5. Non-parametric star formation histories
The SFH module of the GIST pipeline exploits pPXF to estimate some of the underlying stellar-population properties and their associated non-parametric star formation histories via full-spectral fitting (configuration switch SFH). Essentially, the code finds a linear combination of spectral templates that resembles the observed spectrum. Under such an assumption the stellar-population properties and the corresponding star formation histories are derived on the basis of the linear weights ascribed to the chosen set of template spectra. However, recovering this information from the observational data is an inverse, ill-conditioned problem. Small variations in the initial data can translate to large variations in the solution. Thus, regularisation is used to obtain a more physically motivated combination of the template spectra. In particular, of all the solutions that are equally consistent with the observational data, the regularisation algorithm returns the smoothest solution. We refer the interested reader to Sect. 3.5 of Cappellari (2017) for a detailed review of the stellar population analysis with pPXF.
The regularisation parameter, corresponding to the pPXF keyword REGUL, acts as a proxy for the strength of the regularisation and is passed to the pipeline with the configuration parameter REGUL_ERR, a value that is the reciprocal of the pPXF keyword REGUL. The given value is subsequently used for all spectra in the cube. We note that the choice of this regularisation parameter could have a substantial effect on some of the recovered population properties.
The SFH module uses emission-subtracted spectra, as produced by the GANDALF module, for the derivation of population properties. During this process, the parameters representing the stellar kinematics can be extracted simultaneously with the population properties or kept fixed to those obtained with the PPXF module (configuration switch FIXED, see also corresponding pPXF keyword). Deviations in the continuum shape between observed and template spectra can be compensated by including a multiplicative Legendre polynomial in the fit (paramter MDEG, same as in the PPXF module). As the use of an additive Legendre polynomial could significantly alter the resulting population properties, these cannot be used in the SFH module regardless of what is set in the configuration parameter ADEG.
It should be noted that the estimation of errors on the population properties, as derived from regularised full-spectral fitting, is somewhat ambiguous and thus we do not attempt to provide such a procedure in this software package. An ensemble of different approaches has been previously undertaken (see e.g. Gadotti et al. 2019; Pinna et al. 2019) and we therefore advise the user to find the most suitable procedure depending on the scientific context.
2.3.6. Absorption-line strength analysis
Complementary to the derivation of stellar population properties via full-spectral fitting, a wide range of studies has made use of absorption-line strength indices to infer information about the stellar content of galaxies (e.g. Trager et al. 1998; Peletier et al. 2007; Kuntschner et al. 2010; McDermid et al. 2015). The fundamental steps of the line strength measurement are the following: a main absorption feature bandpass is encompassed by two side bandpasses to the red and blue. The side bandpasses act as a proxy for the stellar continuum. To this end, the mean flux in both side bandpasses is computed and their central points connected by a straight line. The flux difference between the observed spectrum and this straight line calculated within the wavelength range of the feature bandpass represents the absorption-line strength index (see e.g. Faber et al. 1985; Kuntschner et al. 2006).
The LS module of the GIST pipeline makes it possible to measure absorption line strengths in the Line Index System (LIS; Vazdekis et al. 2010) by adopting a Python translation of the routine used by Kuntschner et al. (2006, configuration switch LINE_STRENGTH). The wavelengths of the feature and continuum bandpasses are defined by the user in a dedicated configuration file (see Table 3). This configuration file further states whether the index will be computed as equivalent width in angstroms or in magnitudes (as commonly used for atomic and molecular absorption features, respectively).
Overview of all switches and parameters in the line strength configuration file of the GIST pipeline.
In preparation of this measurement, the LS module uses emission-subtracted spectra, translates those from velocity space back to constant bins in wavelength, and convolves them to the spectral resolution of the measurement (parameter CONV_COR in the main configuration file). We note that this convolution accounts for both the instrumental and stellar velocity dispersion. The measured stellar radial velocity is considered to assure the correct placement of the line strength bandpasses. Errors are estimated by means of Monte Carlo simulations, considering errors on the stellar radial velocity and the variance spectra (parameter MC_LS in the main configuration file).
As a second independent step, the measured line strengths can be matched to SSP-equivalent properties. The main ingredient is a model file provided together with the selected spectral library (parameter SSP_LIB in the main configuration file) at the corresponding measurement resolution (parameter CONV_COR) that connects line strength indices to population properties. Taking into account the errors in the indices, radial velocities and variance spectra, a Markov chain Monte Carlo (MCMC) algorithm (Foreman-Mackey et al. 2013) searches for the best SSP to match the derived set of indices (parameters NWALKER and NCHAIN; see Martín-Navarro et al. 2018, for further details).
3. Application to MUSE data
In this section we illustrate the capabilities of the pipeline by applying it to real data. We present the full set of high-level data products, in particular the resulting stellar kinematics and emission-line analysis, as well as absorption line strength indices and stellar population properties for one galaxy. We highlight that all figures presented in this section, with the exception of Fig. 3, are automatically generated by the pipeline. Moreover, the pipeline outputs immediately allow the user to produce additional plots, for instance BPT diagrams and maps of electron densities.
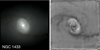 |
Fig. 3. Colour composite (left panel) and colour map (right panel) of NGC 1433. Colour composites are built by collapsing the data cube in a blue (4750–6000 Å), green (6000–7000 Å), and red (7000–9000 Å) wavelength band and combining the resulting images. Colour maps are obtained by subtracting the red image from the blue. |
We exploit observations of the galaxy NGC 1433 obtained with the MUSE integral-field spectrograph as part of the TIMER survey. All galaxies in the TIMER sample are barred and exhibit a variety of nuclear structures, such as nuclear rings, inner discs, and primary/secondary bars, as well as nuclear spiral arms (see e.g. Méndez-Abreu et al. 2019; de Lorenzo-Cáceres et al. 2019). The main scientific goal of the project is to study the star formation histories of these nuclear structures. More specifically, this allows us to determine the cosmic time at which the bar initially formed and thus constrain the epoch at which the galaxy’s disc became dynamically mature (see Gadotti et al. 2015, 2019).
We chose the galaxy NGC 1433 as it is a typical example of a spiral galaxy with various structural components, which we expect to be clearly distinguishable in their kinematic and stellar population properties. In addition, this galaxy exhibits a variety of ionised-gas emission, without showing significant emission from an AGN or suffering from severe dust contamination. Therefore, NGC 1433 is a good example to demonstrate the capabilities of the GIST pipeline.
3.1. Observations and data reduction
The observations of NGC 1433 were performed in ESO Period 97 in August and October 2016 with an average seeing of 0.8−0.9 arcsec. The MUSE field of view (FoV) covers approximately 1 arcmin × 1 arcmin with a spatial sampling of 0.2 arcsec × 0.2 arcsec. It covers a spectral range from 4750 to 9350 Å with a spectral pixel size of 1.25 Å and mean spectral resolution of 2.65 Å. The data reduction is based on the version 1.6 of the dedicated ESO MUSE data-reduction pipeline (Weilbacher et al. 2012). In summary, bias, flat-fielding, and illumination corrections are applied and the exposures calibrated in flux and wavelength. Telluric features and signatures from the sky background are removed and exposures are registered astrometrically. For details on observations and data reduction we refer the reader to Gadotti et al. (2019).
NGC 1433 is a barred, early-type spiral with an inner ring, plume, nuclear ring-lens, and nuclear bar, and with an outer pseudo-ring (classified as  SB(r, p, nrl, nb)a by Buta et al. 2015). Its inclination is 34 degrees based on the 25.5 AB mag arcsec−2 isophote at 3.6 μm, and it has a stellar mass of 2.0 × 10¹⁰ M⊙. The mean redshift-independent distance from the NASA Extragalactic Database8 is 10.0 Mpc (see also Gadotti et al. 2019, and references therein).
In Fig. 3 we further illustrate the most prominent structures in the MUSE FoV by presenting a colour composite (left panel) and colour map (right panel). The colour composite highlights a star-forming inner disc; however, in contrast to previous studies (e.g. Erwin 2004; Buta et al. 2015) we do not find evidence for a nuclear bar in the MUSE reconstructed intensities. The colour map features two strong dust lanes along the leading edges of the main bar. Dust lanes along the leading edges of the bar are expected from theoretical work (Athanassoula 1992), and in the case of NCG 1433 end at the inner disc (see also Sormani et al. 2018).
3.2. Data analysis set-up
We perform the data analysis with the pipeline configuration set-up discussed in Sect. 2. Throughout this analysis, we spatially bin the data to an approximately constant signal-to-noise ratio of 40 per bin. This signal-to-noise level has been widely used in literature as it provides a good compromise between accuracy of the extracted quantities and spatial resolution (see e.g. van der Marel & Franx 1993), thus it is a suitable choice for this demonstration of the GIST pipeline. Spaxels that surpass this ratio remain unbinned in the analysis, while all spaxels below the isophote level which has an average signal-to-noise ratio of 3 are excluded in order to avoid systematic effects at low surface brightness. We note that the emission-line analysis is performed on a spaxel-by-spaxel basis instead, also including spaxels below this signal-to-noise threshold.
The line-spread function of the MUSE observations varies with wavelength. To correct for this effect, we adopt the udf-10 prescription obtained by Bacon et al. (2017). In particular, we broaden all template spectra to the one obtained in their work prior to performing any fits.
For the measurement of stellar kinematics and emission-line properties, we use the E-MILES model library (Vazdekis et al. 2015). The library consists of SSP spectra, covering a wide range of values for age and metallicity at a spectral resolution of ≈2.51 Å in the relevant wavelength range (Falcón-Barroso et al. 2011). In this analysis, we exploit the rest-frame wavelength range from 4800 to 8950 Å in order to maximise the available information. Any emission lines in the considered wavelength range are masked. When extracting stellar kinematics with pPXF, we include a low-order, multiplicative Legendre polynomial in the fit to correct for any small differences between observed and template spectra. In contrast, the emission-line analysis exploits a two-component reddening correction instead of Legendre polynomials.
In order to infer the stellar population properties, we restrict the wavelength range to 4800–5500 Å. This allows the use of the MILES SSP model library (Vazdekis et al. 2010), which covers a shorter wavelength range, but provides information on the α-enhancement of the stellar populations. The model library covers ages from 0.03 to 14.00 Gyr, metallicities of −2.27 < [M/H] < +0.40, and α-enhancement values [α/Fe] of either 0.00 and 0.40. The models are based on the BaSTI isochrones (Pietrinferni et al. 2004, 2006, 2009, 2013) and a revised Kroupa initial mass function (Kroupa 2001). The measurement of the stellar population content is based on the Voronoi-binned, emission-subtracted spectra, as returned by the GANDALF module.
The inference of the non-parametric star formation histories is performed by a regularised run of pPXF. Stellar kinematics are kept fixed to those obtained from the unregularised run of pPXF. The strength of the regularisation is determined following the criterion introduced by Press et al. (1992) and applied, for instance, in McDermid et al. (2015). In particular, the maximum value of the regularisation corresponds to the fit for which the χ2 of the best-fitting solution increases from the χ2 of the unregularised solution by  with Npix being the number of fitted spectral pixels. This regularisation parameter is determined on the bin with the highest signal-to-noise ratio and subsequently applied to the entire cube.
We measure absorption-line strength indices in the LIS-8.4 system (Vazdekis et al. 2010). To this end, all spectra are convolved to a spectral resolution of 8.4 Å, taking into account both instrumental and local stellar velocity dispersion. Errors on these indices are estimated through 30 Monte Carlo simulations. Subsequently, the MILES SSP model which best predicts the observed combination of the Hβ° (Cervantes & Vazdekis 2009), Fe5015 (Worthey et al. 1994), Mgb (Burstein et al. 1984), Fe5270 (Burstein et al. 1984), and Fe5335 (Worthey et al. 1994) indices, as used by previous studies to determine SSP properties, is determined by means of the previously mentioned MCMC fitting technique (Martín-Navarro et al. 2018).
3.3. Stellar kinematics
We present the derived maps of stellar kinematics in the upper group of panels in Fig. 4 and projected specific stellar angular momentum λ in Fig. 5. The typical formal errors on the fit are 4.1 km s−1 in velocity, 5.7 km s−1 in velocity dispersion, 0.03 in h3, and 0.04 in h4. Various distinct kinematic features are immediately evident, thanks to the outstanding spatial resolution of the MUSE observations. A rapidly rotating inner disc with a radial extent of approximately 10 arcsec is detected in the line-of-sight velocity map. This inner disc appears even more pronounced in the map of the λ parameter. The map of the stellar velocity dispersion shows a prominent ring of low-velocity dispersion which coincides with the rapidly rotating inner disc found in the line-of-sight velocity map. This ring is surrounded by a region of elevated velocity dispersion. Within the ring, at radii smaller than 3−4 arcsec, the velocity dispersion increases again towards the centre.
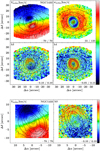 |
Fig. 4. Upper group of panels: line-of-sight velocity (Vstellar), velocity dispersion (σstellar), and higher-order moments h3 and h4 of the stellar component of NGC 1433. Lower panels: spatial distribution of line-of-sight velocities (left) and h3 moment (right) in the innermost part of the galaxy. The limits of the colour bar is given in the lower right corner of each panel. Isophotes are based on reconstructed intensities from the MUSE cube and are displayed in steps of 0.5 mag. North is up; east is to the left. |
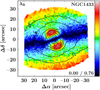 |
Fig. 5. Map of the projected specific angular momentum λ of NGC 1433. The limits of the colour bar are stated in the lower right corner. Isophotes are based on reconstructed intensities from the MUSE cube and displayed in steps of 0.5 mag. North is up; east is to the left. |
Correlations between the higher-order Gauss-Hermite moment h3 and the line-of-sight velocity allow us to infer information on the eccentricity of the underlying stellar orbits. For instance, an anti-correlation between line-of-sight velocity and h3 indicates near-circular orbits as they are typically found in regularly rotating stellar systems, such as stellar discs (Bender et al. 1994; Bureau & Athanassoula 2005). Such an anti-correlation is evident in the region of the inner disc, in particular at radii between 4 and 10 arcsec. In addition, such an anti-correlation is found at radii above 25 arcsec, which corresponds to the main disc of the galaxy. In contrast, a correlation between line-of-sight velocity and h3 is a signature of orbits with high eccentricity. We find such a correlation at intermediate radii between the inner and main stellar disc of NGC 1433. In fact, this region might be dominated by the eccentric x1 orbits of the bar. Interestingly, a similar correlation between line-of-sight velocity and h3 is found within the nuclear ring of the galaxy, at radii smaller than 3−4 arcsec (see lower group of panels in Fig. 4). This finding is particularly interesting in the context of the potential existence of an inner bar in NGC 1433. However, we note that previous studies (see e.g. Erwin 2004; Buta et al. 2015; de Lorenzo-Cáceres et al. 2019) remain inconclusive on the existence of an inner bar in this galaxy.
Finally, high values of the higher-order moment h4 indicate a superposition of structures with different LOSVDs (see e.g. Bender et al. 1994, and references therein). For NGC 1433 this is only the case in the nuclear ring, while in other parts of the galaxy, in particular in the centre, no elevated h4 values are found.
3.4. Emission-line kinematics and fluxes
The upper right-hand panel of Fig. 6 shows the spatial distribution of measured Hα fluxes. A large amount of Hα emission is obvious, especially in the inner disc. While the emission in the inner disc appears patchy, the highest Hα fluxes are found in the centre of the galaxy. In the upper left and lower left panels of Fig. 6 we present line-of-sight velocity and velocity dispersion maps of the emission-line fit of Hα. The line-of-sight velocity map clearly shows Hα rotation along the major axis of the galaxy. However, significant departures from regular rotation, in particular in the region of the inner disc, are obvious. The spatial distribution of the Hα velocity dispersion reveals several areas of low sigma, in particular in the nuclear ring. These spatially coincide with areas of high Hα fluxes, where star formation is proceeding. Close to the centre of the galaxy, three regions of elevated velocity dispersion are evident.
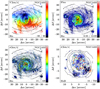 |
Fig. 6. Maps of the Hα line-of-sight velocity (upper left panel), velocity dispersion (lower left panel) and flux (upper right panel, in arbitrary units with logarithmic scale) of the primary component in the emission-line fit of NGC 1433. The velocity dispersion of the secondary Hα component is displayed in the lower right panel. We note that this panel shows a different spatial scale in order to highlight the innermost region of the galaxy. Only spaxels in which the Hα line exceeds an A/rN ratio of 4 are displayed in this figure. The limits of the colour bar are given in the lower right corner of each panel. Isophotes are based on reconstructed intensities from the MUSE cube and displayed in steps of 0.5 mag. North is up; east is to the left. |
The pyGandALF emission-line fit included a secondary component for the Hα emission wherever necessary. In particular, a visual inspection of the one-component fits revealed that a secondary component was necessary in a few regions, even though it is fainter than the primary component. Where such a component is not necessary, pyGandALF does not recover this component. We note that only few spaxels, mostly located in the inner disc, include such a secondary emission-line component. The map of the velocity dispersion of this secondary component is presented in the lower right panel of Fig. 6. In three individual regions in the inner disc, the secondary component is included as additional, low-dispersion component. These regions have already been identified as low-dispersion regions in the primary component of the fit. Interestingly, in the inner regions of the inner disc, the secondary component shows high-velocity dispersion of several hundred km s−1. We note that while the secondary component improved the Hα emission-line fit in the shown regions, a detailed investigation on its origin, in particular whether its origin is physical or not, is beyond the scope of this study.
3.5. Line strength analysis
In Fig. 7 we present maps of the absorption-line strength indices Hβ°, Fe5015, and Mgb of NGC 1433. Elevated values of the Hβ° index are only found in the nuclear ring, while its values are constantly low at larger radii. Within the inner disc, the Hβ° index is slightly elevated compared to regions outside the inner disc. Similarly, the Fe5015 line-strength index is constant over a large part of the FoV. However, the nuclear ring becomes evident through slightly lower index values. In the region inside the nuclear ring, the Fe5015 map shows elevated values which further increase towards the centre. The Mgb line-strength index behaves similarly, with constantly high values at large radii, low values in the nuclear ring, and elevated values that peak in the centre of the galaxy. We note that typical, median errors on the derived indices of Hβ°, Fe5015, and Mgb are approximately 0.32, 0.54, and 0.26, respectively.
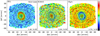 |
Fig. 7. Maps of the absorption-line strength indices Hβ° (left panel), Fe5015 (central panel), and Mgb (right panel) of the galaxy NGC 1433. The limits of the colour bar are shown in the lower right corner of each panel. Isophotes are based on reconstructed intensities from the MUSE cube and displayed in steps of 0.5 mag. North is up; east is to the left. |
3.6. Stellar population properties
3.6.1. Single stellar population properties
In Fig. 8 we display the SSP-equivalent population properties recovered by performing an absorption-line strength measurement of the Hβ°, Fe5015, Mgb, Fe5270, and Fe5335 indices. We report constant ages of ∼8 Gyr for a large part of the galaxy with the exception of the inner disc. Noteably, there we infer younger stellar populations, down to ages below 1 Gyr. Interestingly, a region of slightly elevated ages is found in the innermost part of the galaxy at radii smaller than ∼6 arcsec, resulting in a prominent ring-like structure of young stellar populations at radii from ∼6 to 10 arcsec. The spatial distribution of [M/H] shows a similar behaviour, but with elevated values in the nuclear ring and the very centre of the galaxy. The values of [α/Fe] are constant at 0.2 dex at large radii from the centre. The nuclear ring is evident as region of higher α-enhancement that is encompassed by a region of slightly less α-enhanced stellar populations. The region inside the nuclear ring shows significantly less α-element enhanced stellar populations with the lowest values of ∼0.0 dex found at the very centre. We note that typical errors on the ages, metallicities, and α-enhancements of these recovered SSP properties are 2 Gyr, 0.15 dex, and 0.08 dex, respectively.
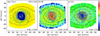 |
Fig. 8. Maps of SSP-equivalent population properties of the galaxy NGC 1433, as derived from absorption-line strength measurements. Displayed are age (left panel), [M/H] (centre panel), and [α/Fe] (right panel). The limits of the colour bar are given in the lower right corner of each panel. Isophotes are based on reconstructed intensities from the MUSE cube and displayed in steps of 0.5 mag. North is up; east is to the left. |
We note that the stellar population properties derived for the inner disc are clearly reminiscent of young (below 1 Gyr) stellar populations. For those young stellar populations the degeneracies between age, metallicity, and α sensitive absorption-line features become severe and the conversion of line strength indices to stellar population properties is therefore highly unreliable. Due to the recent inflow of gas towards the nuclear ring and ongoing star formation activity, the assumption that the stellar populations in the nuclear ring can be represented by single age, single metallicity, and single α-enhancement values is most likely not valid. Nevertheless, these measurements provide evidence that the stellar populations in the inner disc are younger and more metal rich than in the remaining parts of the galaxy, while proving elevated values of α abundances in the nuclear ring is beyond the scope of this study.
3.6.2. Non-parametric star formation histories
Spatial distributions of the light-weighted stellar population content, as inferred from full-spectral fitting with pPXF, are presented in Fig. 9. These results are in good agreement with the stellar population properties derived from line strength indices above. However, we note the difference in the α-element enhancement values outside of the nuclear region where the inferred SSP [α/Fe] is ∼0.2, instead of those acquired through the pPXF full-spectral fitting α-element enhancement of ∼0.1. This difference is only slightly larger than the typical errors on the α-enhancement of the SSP properties (0.08 dex). More prominently, the ring of elevated [α/Fe] values in the SSP maps is not found in the maps derived with pPXF. More importantly, both approaches independently converge to their lowest values of the α-enhancement in the innermost regions.
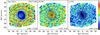 |
Fig. 9. Maps of the light-weighted stellar population content of the galaxy NGC 1433, as derived from full-spectral fitting. Displayed are age (left panel), [M/H] (centre panel), and [α/Fe] (right panel). The limits of the colour bar are stated in the lower right of each panel. Isophotes are based on reconstructed intensities from the MUSE cube and displayed in steps of 0.5 mag. North is up; east is to the left. |
Outside the inner disc, age and [M/H] agree well, with less prominent scatter in the maps of the SSP properties. We note that maps of the SSP properties show slightly younger and more metal rich populations in the inner disc in comparison to the population content derived via full-spectral fitting. Previous studies have found that SSP population properties tend to show younger ages and higher metallicity as compared to those derived from light-weighted full-spectral fitting (see e.g. Serra & Trager 2007; Trager & Somerville 2009). In addition, SSP properties with ages below 1 Gyr cannot be measured reliably and the assumption of observing a single stellar population, in particular in the inner disc, is unrealistic. Therefore, stellar population properties in the inner disc measured with full-spectral fitting seem more reliable and the ring of elevated [α/Fe] values found in the SSP properties might be an unphysical result. A comparison with mass-weighted results is beyond the scope of this study.
4. Summary and conclusions
In this study, we introduce a convenient, all-in-one framework for the scientific analysis of fully reduced, (integral-field) spectroscopic data. The pipeline presented in this work incorporates all the necessary steps (i.e. read-in and preparation of the science data, modular data analysis, inspection of the data products, etc.) to produce publication-quality figures. In its default set-up, the software extracts in each observed spatial position the underlying stellar LOSVD, complemented with stellar population properties, extracted through either full-spectral or line-strength index fitting. In conjunction, the pipeline also accounts for any ionised-gas emission lines and their corresponding properties. To this end, we introduce a novel Python implementation of GandALF.
The GIST pipeline is not specific to any IFS instrument, nor is it a particular analysis technique; it provides an easy framework with the means of modification and development, owing to its modular code architecture. An elaborate parallelisation has been implemented and tested on machines, from laptops to cluster scale. We note its unique capabilities to batch-analyse data in a fully automated manner drawing on any previously produced outputs with the possibility to interchange to a more interactive hands-on workflow facilitated by a dedicated visualisation routine with an advanced graphical user interface. This visualisation routine allows easy access to all measurements, spectra, fits, and residuals, and to star formation histories and the weight distribution of the models in fully interactive plots.
The presented analysis framework has been successfully applied to both low- and high-redshift data from MUSE, PPAK (CALIFA), and SINFONI, and to simulated data for HARMONI and WEAVE and is already being used by the TIMER, Fornax3D, and PHANGS surveys. This further highlights the comprehensive features of the GIST pipeline and the need of the scientific community for such a software package.
This code is publicly available through a dedicated webpage6 and is subject to ongoing development. Additional analysis modules, for instance the inclusion of STECKMAP and pyPARADISE, will be included in a future release. The webpage provides a thorough documentation of the code; instructions on how to download, install, and use it; as well as a short tutorial. Because the pipeline is applicable to a wide variety of scientific objectives, we encourage the community to exploit the highly modular code architecture by adapting the pipeline to their specific scientific needs or adding further modules. We would also like to remind the user to properly reference any software and spectral template libraries that have been utilised as the base of this software package.
We illustrate the capabilities of the pipeline by applying it to observations of NGC 1433, obtained with the MUSE TIMER survey. We perform measurements of the stellar and gaseous kinematics, and infer the properties of the underlying stellar population content. We find evidence of a rapidly rotating inner disc, with a radial extent of approximately 10 arcsec, characterised by low-velocity dispersion and an anti-correlation between radial velocity and the h3 moment. Interestingly, a correlation between radial velocity and h3 moment is also found in the innermost region of the galaxy, at radii smaller than 4 arcsec. A large amount of Hα emission is detected, indicating gas rotation along the major axis of the galaxy with significant departures from regular rotation. Spatial distributions of the stellar population properties provide evidence of a young and metal-rich inner disc with low values of α-enhancement. These findings are all clearly consistent with an inner disc built by bar-driven, secular evolution processes. Forthcoming papers on stellar kinematics and population properties of the MUSE TIMER galaxies will investigate the related processes in detail, and will also connect them with the physics of gas and star formation in the inner disc.
Acknowledgments
We thank the referee for a prompt and constructive report. The authors thank Harald Kuntschner and Michele Cappellari for the permission to distribute their codes together with this software package. We further thank Alexandre Vazdekis for permission to include the MILES library. FP acknowledges Fundación La Caixa for the financial support received in the form of a PhD and post-doctoral contract. FP, J. F-B, and AdLC acknowledge support from grant AYA2016-77237-C3-1-P from the Spanish Ministry of Economy and Competitiveness (MINECO). Based on observations collected at the European Organisation for Astronomical Research in the Southern Hemisphere under ESO programme 097.B-0640(A). This research has made use of the SIMBAD database, operated at CDS, Strasbourg, France (Wenger et al. 2000); NASA’s Astrophysics Data System (ADS); and the NASA Extragalactic Database (NED). The pipeline makes use of Astropy (http://www.astropy.org), a community-developed core Python package for Astronomy (Astropy Collaboration 2013, 2018), as well as NumPy (Oliphant 2006), SciPy (Jones et al. 2001), and Matplotlib (Hunter 2007).
References
- Astropy Collaboration (Robitaille, T. P., et al.) 2013, A&A, 558, A33 [NASA ADS] [CrossRef] [EDP Sciences] [Google Scholar]
- Astropy Collaboration (Price-Whelan, A. M., et al.) 2018, AJ, 156, 123 [Google Scholar]
- Athanassoula, E. 1992, MNRAS, 259, 345 [NASA ADS] [CrossRef] [Google Scholar]
- Bacon, R., Adam, G., Baranne, A., et al. 1995, A&AS, 113, 347 [NASA ADS] [Google Scholar]
- Bacon, R., Copin, Y., Monnet, G., et al. 2001, MNRAS, 326, 23 [NASA ADS] [CrossRef] [Google Scholar]
- Bacon, R., Accardo, M., Adjali, L., et al. 2010, in Ground-based and Airborne Instrumentation for Astronomy III, SPIE Conf. Ser., 7735, 773508 [CrossRef] [Google Scholar]
- Bacon, R., Conseil, S., Mary, D., et al. 2017, A&A, 608, A1 [NASA ADS] [CrossRef] [EDP Sciences] [Google Scholar]
- Bender, R. 1990, A&A, 229, 441 [NASA ADS] [Google Scholar]
- Bender, R., Saglia, R. P., & Gerhard, O. E. 1994, MNRAS, 269, 785 [NASA ADS] [CrossRef] [Google Scholar]
- Bryant, J. J., Owers, M. S., Robotham, A. S. G., et al. 2015, MNRAS, 447, 2857 [NASA ADS] [CrossRef] [Google Scholar]
- Bundy, K., Bershady, M. A., Law, D. R., et al. 2015, ApJ, 798, 7 [NASA ADS] [CrossRef] [Google Scholar]
- Bureau, M., & Athanassoula, E. 2005, ApJ, 626, 159 [NASA ADS] [CrossRef] [Google Scholar]
- Burstein, D., Faber, S. M., Gaskell, C. M., & Krumm, N. 1984, ApJ, 287, 586 [NASA ADS] [CrossRef] [Google Scholar]
- Buta, R. J., Sheth, K., Athanassoula, E., et al. 2015, ApJS, 217, 32 [NASA ADS] [CrossRef] [Google Scholar]
- Calzetti, D., Armus, L., Bohlin, R. C., et al. 2000, ApJ, 533, 682 [NASA ADS] [CrossRef] [Google Scholar]
- Cappellari, M. 2017, MNRAS, 466, 798 [NASA ADS] [CrossRef] [Google Scholar]
- Cappellari, M., & Copin, Y. 2003, MNRAS, 342, 345 [NASA ADS] [CrossRef] [Google Scholar]
- Cappellari, M., & Emsellem, E. 2004, PASP, 116, 138 [NASA ADS] [CrossRef] [Google Scholar]
- Cappellari, M., Emsellem, E., Krajnović, D., et al. 2011, MNRAS, 413, 813 [NASA ADS] [CrossRef] [Google Scholar]
- Cervantes, J. L., & Vazdekis, A. 2009, MNRAS, 392, 691 [NASA ADS] [CrossRef] [Google Scholar]
- Cid Fernandes, R., Mateus, A., Sodré, L., Stasińska, G., & Gomes, J. M. 2005, MNRAS, 358, 363 [NASA ADS] [CrossRef] [Google Scholar]
- Croom, S. M., Lawrence, J. S., Bland-Hawthorn, J., et al. 2012, MNRAS, 421, 872 [NASA ADS] [Google Scholar]
- Dalton, G., Trager, S. C., Abrams, D. C., et al. 2012, in Ground-based and Airborne Instrumentation for Astronomy IV, SPIE Conf. Ser., 8446, 84460P [CrossRef] [Google Scholar]
- de Lorenzo-Cáceres, A., Sánchez-Blázquez, P., Méndez-Abreu, J., et al. 2019, MNRAS, 226 [Google Scholar]
- de Zeeuw, P. T., Bureau, M., Emsellem, E., et al. 2002, MNRAS, 329, 513 [NASA ADS] [CrossRef] [Google Scholar]
- Eisenhauer, F., Abuter, R., Bickert, K., et al. 2003, in Instrument Design and Performance for Optical/Infrared Ground-based Telescopes, eds. M. Iye, & A. F. M. Moorwood, SPIE Conf. Ser., 4841, 1548 [NASA ADS] [CrossRef] [Google Scholar]
- Emsellem, E., Cappellari, M., Peletier, R. F., et al. 2004, MNRAS, 352, 721 [NASA ADS] [CrossRef] [Google Scholar]
- Emsellem, E., Cappellari, M., Krajnović, D., et al. 2007, MNRAS, 379, 401 [NASA ADS] [CrossRef] [Google Scholar]
- Emsellem, E., Cappellari, M., Krajnović, D., et al. 2011, MNRAS, 414, 888 [NASA ADS] [CrossRef] [Google Scholar]
- Erwin, P. 2004, A&A, 415, 941 [NASA ADS] [CrossRef] [EDP Sciences] [Google Scholar]
- Faber, S. M., Friel, E. D., Burstein, D., & Gaskell, C. M. 1985, ApJS, 57, 711 [NASA ADS] [CrossRef] [Google Scholar]
- Falcón-Barroso, J., Bacon, R., Bureau, M., et al. 2006, MNRAS, 369, 529 [NASA ADS] [CrossRef] [Google Scholar]
- Falcón-Barroso, J., Sánchez-Blázquez, P., Vazdekis, A., et al. 2011, A&A, 532, A95 [NASA ADS] [CrossRef] [EDP Sciences] [Google Scholar]
- Foreman-Mackey, D., Hogg, D. W., Lang, D., & Goodman, J. 2013, PASP, 125, 306 [CrossRef] [Google Scholar]
- Franx, M., Illingworth, G., & Heckman, T. 1989, ApJ, 344, 613 [NASA ADS] [CrossRef] [Google Scholar]
- Gadotti, D. A., & de Souza, R. E. 2005, ApJ, 629, 797 [NASA ADS] [CrossRef] [Google Scholar]
- Gadotti, D. A., Seidel, M. K., Sánchez- Blázquez, P., et al. 2015, A&A, 584, A90 [NASA ADS] [CrossRef] [EDP Sciences] [Google Scholar]
- Gadotti, D. A., Sánchez-Blázquez, P., Falcón-Barroso, J., et al. 2019, MNRAS, 482, 506 [Google Scholar]
- Ganda, K., Falcón-Barroso, J., Peletier, R. F., et al. 2006, MNRAS, 367, 46 [NASA ADS] [CrossRef] [Google Scholar]
- García-Benito, R., Zibetti, S., Sánchez, S. F., et al. 2015, A&A, 576, A135 [NASA ADS] [CrossRef] [EDP Sciences] [Google Scholar]
- Gerhard, O. E. 1993, MNRAS, 265, 213 [NASA ADS] [CrossRef] [Google Scholar]
- Heavens, A. F., Jimenez, R., & Lahav, O. 2000, MNRAS, 317, 965 [NASA ADS] [CrossRef] [Google Scholar]
- Ho, I. T., Medling, A. M., Groves, B., et al. 2016, Ap&SS, 361, 280 [CrossRef] [Google Scholar]
- Hunter, J. D. 2007, Comput. Sci. Eng., 9, 90 [NASA ADS] [CrossRef] [Google Scholar]
- Husemann, B., Bennert, V. N., Scharwächter, J., Woo, J. H., & Choudhury, O. S. 2016, MNRAS, 455, 1905 [NASA ADS] [CrossRef] [Google Scholar]
- Iodice, E., Sarzi, M., Bittner, A., et al. 2019, A&A, 627, A136 [NASA ADS] [CrossRef] [EDP Sciences] [Google Scholar]
- Jones, E., Oliphant, T., Peterson, P., et al. 2001, SciPy: Open Source Scientific Tools for Python [Google Scholar]
- Koleva, M., Prugniel, P., Bouchard, A., & Wu, Y. 2009, A&A, 501, 1269 [NASA ADS] [CrossRef] [EDP Sciences] [Google Scholar]
- Kroupa, P. 2001, MNRAS, 322, 231 [NASA ADS] [CrossRef] [Google Scholar]
- Kuijken, K., & Merrifield, M. R. 1993, MNRAS, 264, 712 [NASA ADS] [Google Scholar]
- Kuntschner, H., Emsellem, E., Bacon, R., et al. 2006, MNRAS, 369, 497 [NASA ADS] [CrossRef] [Google Scholar]
- Kuntschner, H., Emsellem, E., Bacon, R., et al. 2010, MNRAS, 408, 97 [NASA ADS] [CrossRef] [Google Scholar]
- Martín-Navarro, I., Vazdekis, A., Falcón-Barroso, J., et al. 2018, MNRAS, 475, 3700 [NASA ADS] [CrossRef] [Google Scholar]
- McDermid, R. M., Alatalo, K., Blitz, L., et al. 2015, MNRAS, 448, 3484 [NASA ADS] [CrossRef] [Google Scholar]
- Méndez-Abreu, J., de Lorenzo-Cáceres, A., Gadotti, D. A., et al. 2019, MNRAS, 482, L118 [NASA ADS] [CrossRef] [Google Scholar]
- Merritt, D. 1997, AJ, 114, 228 [NASA ADS] [CrossRef] [Google Scholar]
- Ocvirk, P., Pichon, C., Lançon, A., & Thiébaut, E. 2006a, MNRAS, 365, 74 [NASA ADS] [CrossRef] [Google Scholar]
- Ocvirk, P., Pichon, C., Lançon, A., & Thiébaut, E. 2006b, MNRAS, 365, 46 [NASA ADS] [CrossRef] [Google Scholar]
- Oh, K., Sarzi, M., Schawinski, K., & Yi, S. K. 2011, ApJS, 195, 13 [NASA ADS] [CrossRef] [Google Scholar]
- Oliphant, T. 2006, NumPy: A Guide to NumPy (USA: Trelgol Publishing) [Google Scholar]
- Peletier, R. F., Falcón-Barroso, J., Bacon, R., et al. 2007, MNRAS, 379, 445 [NASA ADS] [CrossRef] [Google Scholar]
- Pietrinferni, A., Cassisi, S., Salaris, M., & Castelli, F. 2004, ApJ, 612, 168 [NASA ADS] [CrossRef] [Google Scholar]
- Pietrinferni, A., Cassisi, S., Salaris, M., & Castelli, F. 2006, ApJ, 642, 797 [NASA ADS] [CrossRef] [Google Scholar]
- Pietrinferni, A., Cassisi, S., Salaris, M., Percival, S., & Ferguson, J. W. 2009, ApJ, 697, 275 [NASA ADS] [CrossRef] [Google Scholar]
- Pietrinferni, A., Cassisi, S., Salaris, M., & Hidalgo, S. 2013, A&A, 558, A46 [NASA ADS] [CrossRef] [EDP Sciences] [Google Scholar]
- Pinna, F., Falcón-Barroso, J., Martig, M., et al. 2019, A&A, 623, A19 [NASA ADS] [CrossRef] [EDP Sciences] [Google Scholar]
- Press, W. H., Teukolsky, S. A., Vetterling, W. T., & Flannery, B. P. 1992, Numerical Recipes in FORTRAN. The Art of Scientific Computing (Cambridge: Cambridge University Press) [Google Scholar]
- Rix, H.-W., & White, S. D. M. 1992, MNRAS, 254, 389 [NASA ADS] [CrossRef] [Google Scholar]
- Sánchez, S. F., Kennicutt, R. C., Gil de Paz, A., et al. 2012, A&A, 538, A8 [NASA ADS] [CrossRef] [EDP Sciences] [Google Scholar]
- Sánchez, S. F., Pérez, E., Sánchez-Blázquez, P., et al. 2016, Rev. Mex. Astron. Astrofis., 52, 171 [Google Scholar]
- Sargent, W. L. W., Schechter, P. L., Boksenberg, A., & Shortridge, K. 1977, ApJ, 212, 326 [NASA ADS] [CrossRef] [Google Scholar]
- Sarzi, M., Falcón-Barroso, J., Davies, R. L., et al. 2006, MNRAS, 366, 1151 [NASA ADS] [CrossRef] [Google Scholar]
- Sarzi, M., Iodice, E., Coccato, L., et al. 2018, A&A, 616, A121 [NASA ADS] [CrossRef] [EDP Sciences] [Google Scholar]
- Schlegel, D. J., Finkbeiner, D. P., & Davis, M. 1998, ApJ, 500, 525 [NASA ADS] [CrossRef] [Google Scholar]
- Serra, P., & Trager, S. C. 2007, MNRAS, 374, 769 [NASA ADS] [CrossRef] [Google Scholar]
- Simkin, S. M. 1974, A&A, 31, 129 [NASA ADS] [Google Scholar]
- Sormani, M. C., Sobacchi, E., Fragkoudi, F., et al. 2018, MNRAS, 481, 2 [NASA ADS] [CrossRef] [Google Scholar]
- Statler, T. 1995, AJ, 109, 1371 [NASA ADS] [CrossRef] [Google Scholar]
- Thatte, N., Tecza, M., Clarke, F., et al. 2010, in Ground-based and Airborne Instrumentation for Astronomy III, SPIE Conf. Ser., 7735, 77352I [CrossRef] [Google Scholar]
- Tojeiro, R., Heavens, A. F., Jimenez, R., & Panter, B. 2007, MNRAS, 381, 1252 [NASA ADS] [CrossRef] [Google Scholar]
- Tonry, J., & Davis, M. 1979, AJ, 84, 1511 [NASA ADS] [CrossRef] [Google Scholar]
- Trager, S. C., & Somerville, R. S. 2009, MNRAS, 395, 608 [NASA ADS] [CrossRef] [Google Scholar]
- Trager, S. C., Worthey, G., Faber, S. M., Burstein, D., & González, J. J. 1998, ApJS, 116, 1 [NASA ADS] [CrossRef] [MathSciNet] [Google Scholar]
- van der Marel, R. P., & Franx, M. 1993, ApJ, 407, 525 [NASA ADS] [CrossRef] [Google Scholar]
- Vazdekis, A., Sánchez-Blázquez, P., Falcón-Barroso, J., et al. 2010, MNRAS, 404, 1639 [NASA ADS] [Google Scholar]
- Vazdekis, A., Coelho, P., Cassisi, S., et al. 2015, MNRAS, 449, 1177 [NASA ADS] [CrossRef] [Google Scholar]
- Walcher, C. J., Coelho, P. R. T., Gallazzi, A., et al. 2015, A&A, 582, A46 [NASA ADS] [CrossRef] [EDP Sciences] [Google Scholar]
- Weilbacher, P. M., Streicher, O., Urrutia, T., et al. 2012, in Software and Cyberinfrastructure for Astronomy II, SPIE Conf. Ser., 8451, 84510B [CrossRef] [Google Scholar]
- Wenger, M., Ochsenbein, F., Egret, D., et al. 2000, A&AS, 143, 9 [NASA ADS] [CrossRef] [EDP Sciences] [Google Scholar]
- Westfall, K. B., Cappellari, M., Bershady, M. A., et al. 2019, AJ, submitted [arXiv:1901.00856] [Google Scholar]
- Worthey, G., Faber, S. M., Gonzalez, J. J., & Burstein, D. 1994, ApJS, 94, 687 [NASA ADS] [CrossRef] [Google Scholar]
All Tables
Overview of all switches and parameters in the main configuration file of the GIST pipeline.
Overview of all switches and parameters in the emission-line configuration file of the GIST pipeline.
Overview of all switches and parameters in the line strength configuration file of the GIST pipeline.
All Figures
|
Fig. 1. Flowchart illustrating the architecture of the pipeline. The code is structured in three parts: preparatory operations, main analysis procedures, and visualisation routines. Each of these parts consists of various individual modules. |
| In the text | |
|
Fig. 2. Screenshot of the visualisation software Mapviewer in its default layout, illustrating the results of the galaxy NGC 1433. High-level data products of previous analysis runs of the GIST pipeline can be selected and displayed through the items in the menu bar. A map of the selected quantity is displayed in the upper left panel of the window. Individual bins in this map can be selected by simply performing a mouse-click on the map or providing the bin ID. The selected bin is subsequently shown by a red circle, while the other panels display more detailed information. In particular, the upper three panels on the right side of the window display observed spectra, and the fits generated by the PPXF module (first panel), GANDALF module (second panel), and SFH module (third panel). Observed spectra are displayed in black, fits in red, emission-subtracted continuum spectra in orange, and residuals in green. Masked spectral regions are highlighted in grey. The three bottom panels display further information on the stellar population properties: non-parametric star formation histories are displayed in the left panel, while the centre and right panels illustrate the weights of the templates in the age-metallicity-alpha grid. The corresponding quantitative results of the measurements are provided next to each panel. Different layouts of the Mapviewer routine are available to highlight the results of the line strength module. |
| In the text | |
|
Fig. 3. Colour composite (left panel) and colour map (right panel) of NGC 1433. Colour composites are built by collapsing the data cube in a blue (4750–6000 Å), green (6000–7000 Å), and red (7000–9000 Å) wavelength band and combining the resulting images. Colour maps are obtained by subtracting the red image from the blue. |
| In the text | |
|
Fig. 4. Upper group of panels: line-of-sight velocity (Vstellar), velocity dispersion (σstellar), and higher-order moments h3 and h4 of the stellar component of NGC 1433. Lower panels: spatial distribution of line-of-sight velocities (left) and h3 moment (right) in the innermost part of the galaxy. The limits of the colour bar is given in the lower right corner of each panel. Isophotes are based on reconstructed intensities from the MUSE cube and are displayed in steps of 0.5 mag. North is up; east is to the left. |
| In the text | |
|
Fig. 5. Map of the projected specific angular momentum λ of NGC 1433. The limits of the colour bar are stated in the lower right corner. Isophotes are based on reconstructed intensities from the MUSE cube and displayed in steps of 0.5 mag. North is up; east is to the left. |
| In the text | |
|
Fig. 6. Maps of the Hα line-of-sight velocity (upper left panel), velocity dispersion (lower left panel) and flux (upper right panel, in arbitrary units with logarithmic scale) of the primary component in the emission-line fit of NGC 1433. The velocity dispersion of the secondary Hα component is displayed in the lower right panel. We note that this panel shows a different spatial scale in order to highlight the innermost region of the galaxy. Only spaxels in which the Hα line exceeds an A/rN ratio of 4 are displayed in this figure. The limits of the colour bar are given in the lower right corner of each panel. Isophotes are based on reconstructed intensities from the MUSE cube and displayed in steps of 0.5 mag. North is up; east is to the left. |
| In the text | |
|
Fig. 7. Maps of the absorption-line strength indices Hβ° (left panel), Fe5015 (central panel), and Mgb (right panel) of the galaxy NGC 1433. The limits of the colour bar are shown in the lower right corner of each panel. Isophotes are based on reconstructed intensities from the MUSE cube and displayed in steps of 0.5 mag. North is up; east is to the left. |
| In the text | |
|
Fig. 8. Maps of SSP-equivalent population properties of the galaxy NGC 1433, as derived from absorption-line strength measurements. Displayed are age (left panel), [M/H] (centre panel), and [α/Fe] (right panel). The limits of the colour bar are given in the lower right corner of each panel. Isophotes are based on reconstructed intensities from the MUSE cube and displayed in steps of 0.5 mag. North is up; east is to the left. |
| In the text | |
|
Fig. 9. Maps of the light-weighted stellar population content of the galaxy NGC 1433, as derived from full-spectral fitting. Displayed are age (left panel), [M/H] (centre panel), and [α/Fe] (right panel). The limits of the colour bar are stated in the lower right of each panel. Isophotes are based on reconstructed intensities from the MUSE cube and displayed in steps of 0.5 mag. North is up; east is to the left. |
| In the text | |
Current usage metrics show cumulative count of Article Views (full-text article views including HTML views, PDF and ePub downloads, according to the available data) and Abstracts Views on Vision4Press platform.
Data correspond to usage on the plateform after 2015. The current usage metrics is available 48-96 hours after online publication and is updated daily on week days.
Initial download of the metrics may take a while.