| Issue |
A&A
Volume 689, September 2024
|
|
|---|---|---|
| Article Number | A346 | |
| Number of page(s) | 8 | |
| Section | Extragalactic astronomy | |
| DOI | https://doi.org/10.1051/0004-6361/202347999 | |
| Published online | 23 September 2024 | |
The morphology and kinematics of the galaxy group AM 1054-325: A MUSE perspective
1
Indian Institute of Astrophysics, Koramangala II Block, Bangalore 560034, India
2
Pondicherry University, R.V. Nagar, Kalapet, 605014 Puducherry, India
3
Helmholtz-Institut für Strahlen- und Kernphysik, Universität Bonn, Nussallee 14-16, 53115 Bonn, Germany
Received:
18
September
2023
Accepted:
29
May
2024
Galaxy interactions in groups can lead to intense starbursts and the activation of active galactic nuclei (AGNs). The stripped gas from the outer disk can lead to star-forming clumps along the tidal tails or sometimes tidal dwarf galaxies. We investigate the impact of interaction on various galaxy properties, including morphology, star formation rates, and chemical composition in the galaxy group AM 1054-325 using Multi Unit Spectroscopic Explorer (MUSE) data. We conduct a comprehensive spatially and spectrally resolved investigation of the star formation rate, star formation histories, metallicity, and AGN activity. The galaxy subgroup AM 1054-325A shows multiple star-forming clumps in Hα emission along the western tidal tail, which are formed due to tidal stripping. These clumps also have higher metallicities. AM 1054-325B is quenched and shows disturbed gas kinematics and the signature of gas accretion in the Hα map. The specific star formation along the tidal tail is higher, contributing to the galaxy’s overall stellar mass growth.
Key words: techniques: imaging spectroscopy / galaxies: active / galaxies: interactions / galaxies: groups: individual: AM 1054-325 / galaxies: star formation
© The Authors 2024
 Open Access article, published by EDP Sciences, under the terms of the Creative Commons Attribution License (https://creativecommons.org/licenses/by/4.0), which permits unrestricted use, distribution, and reproduction in any medium, provided the original work is properly cited.
This article is published in open access under the Subscribe to Open model. Subscribe to A&A to support open access publication.
1. Introduction
The interaction of galaxies plays a crucial role in their evolution. Such interactions lead to the growth of supermassive black holes (SMBHs), bulges, and the formation of massive galaxies (Di Matteo et al. 2005). Galaxy groups, particularly those with abundant cold gas reservoirs, create highly favourable conditions for such activities due to the close interactions between galaxies. These interacting galaxies are classified based on their masses: major mergers with a mass ratio between the two galaxies greater than 1:4 and minor mergers with a mass ratio lower than 1:4. Collisions between major mergers are anticipated to be the most violent, while interactions involving minor companions are expected to be more common. This prevalence is attributed to the higher fractional abundance of low luminosity galaxies (Lambas et al. 2012). The gravitational forces during galaxy interactions can lead to the collapse of interstellar gas and dust, triggering intense bursts of star formation and resulting in young, hot and massive stars. This has been extensively studied through observational data, which has revealed a clear connection between galaxy interactions and the initiation of star formation (Yee & Ellingson 1995; Kennicutt 1998; Kauffmann & Haehnelt 2000; Tonnesen & Cen 2012). Simulations also demonstrate that galaxy interactions lead to an elevated star formation rate (SFR) across the entire galaxy, including within the tidal tails formed due to the accretion, redistribution, and compression of gas induced by tidal interactions (Renaud et al. 2015; Moreno et al. 2021).
Tidal forces during galaxy interactions lead to the inflow of large amounts of gas and dust towards the central regions of the galaxies. This funnelled gas feeds the black hole and ignites active galactic nucleus (AGN) activity (Hernquist & Mihos 1995). The majority of ultraluminous infrared galaxies and quasars (> 80%) exhibit indications of a current or recent merger of galaxies (Sanders et al. 1988a,b; Urrutia et al. 2008). Ellison et al. (2013) conducted a study on low-redshift major galaxy pairs (stellar mass ratio < 4) selected from the Sloan Digital Sky Survey. They observed a clear pattern of increasing AGN excess (the ratio of the AGN fraction in paired galaxies compared to a control sample of isolated galaxies) as the projected separation between galaxies decreased (< 40 kpc). Similar approaches used in various studies of the nearby galaxies also show AGN enhancement in merging or interacting galaxies (Alonso et al. 2007; Ellison et al. 2011; Satyapal et al. 2014). When galaxies merge, the proximity between their SMBHs gradually decreases due to the effects of dynamical friction. If the SMBHs are in an active accretion phase, they can form dual AGNs (Koss et al. 2012; Imanishi et al. 2020) if they come closer. In galaxy groups, multiple galaxies can participate in the encounter process, potentially resulting in the formation of a triple AGN system (Koss et al. 2012; Yadav et al. 2021a).
The gravitational forces and torques during the encounter of gas-rich galaxies can lead to the expulsion of neutral hydrogen gas, stars, and dust from the disk of these galaxies. This can result in various tidal features such as rings, tidal tails, bridges, and plumes (Duc & Mirabel 1999). These tidal tails and bridges provide valuable insights into the dynamic processes during galaxy interactions. In some cases, the material in the tidal tail can gravitationally collapse, forming tidal dwarf galaxies (TDGs; Duc & Mirabel 1999). These TDGs become kinematically detached from their host galaxies and exhibit characteristics similar to those of independent dwarf galaxy populations. Sometimes, two visually overlapping galaxies can be mistaken for interacting systems, making spectroscopic observations crucial for understanding the true nature of these objects (Yadav et al. 2022).
The interactions can also lead to gas accretion (Balsara et al. 1994; Acreman et al. 2003; Rasmussen et al. 2006; Yadav et al. 2023). The accreted gas can settle in the outer disk of galaxies, as seen in extended UV disk galaxies, and can fuel star formation over extended periods (Yadav et al. 2021b). The accreted gas can either be aligned or misaligned with the stellar rotation. When the accreted gas carries a significant amount of angular momentum of its own or has a different orbital trajectory, it can lead to misaligned/counter-rotating gas with respect to the stellar disk (Corsini 2014). The first observation of counter-rotation was reported by Galletta (1987). They observed that in the SB0 galaxy NGC4546, the gas rotates in retrograde orbits compared to the stars. This peculiar kinematic misalignment has been observed not only between gaseous and stellar components (Rubin et al. 1992; Bertola et al. 1996; Johnston et al. 2013; Krajnović et al. 2015), but also between stellar components (Bettoni 1984; Ciri et al. 1995; Pizzella et al. 2018).
The order of this paper is as follows. In Sect. 2, we describe the galaxy group AM 1054-325. Sect. 3 describes the Multi Unit Spectroscopic Explorer (MUSE) data and Galaxy IFU Spectroscopy Tool (GIST) pipeline. In Sect. 4 and Sect. 5, we present the data analysis and summary.
2. AM 1054-325 Group
AM 1054-325 is a galaxy group of multiple interacting galaxies. Fig. 1 shows the colour-combined image of the AM 1054-325 galaxy group. The AM 1054-325A galaxy subgroup is composed of multiple arms and shows a peculiar morphology, while the other galaxy, AM 1054-325B, is a spiral galaxy. The spiral galaxy AM 1054-325B, also known as ESO376-G028, is optically bright. AM 1054-325A is composed of two nuclei, ESO-LV 376-0271 and ESO376-G027, which are merging. The AM 1054-325A galaxy subgroup also shows a long tidal tail containing star-forming clumps, which exhibit beads-on-string morphology. These clumps may be tidal dwarf galaxies in the process of formation. Rosa et al. (2014) showed that the emission lines from these HII regions are excited by shocks. AM 1054-325B also appears to interact with another low-surface-brightness galaxy, AM 1054-325C. However, the redshift of AM 1054-325C is unknown. The details of the galaxy group are given in Table 1.
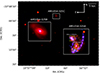 |
Fig. 1. Colour-combined image of the AM 1054-325 galaxy group. The red colour represent z-band data from The Dark Energy Camera Legacy Survey (DECaLS), the green represents HST F336W data, and the blue represents the Hα emission. The tidal tail shows clumps that are bright in Hα emission. White rectangles represent the galaxy AM 1054-325B and the galaxy subgroup AM 1054-325A. The yellow rectangles represent the merging galaxies ESO376-G027 and ESO-LV3760271, and another possible merging candidate galaxy AM 1054-325D is shown in the green rectangle. |
Details of the galaxy group AM 1054-325.
3. Data
MUSE is an integral field unit (IFU) on the Yepun Very Large Telescope (VLT). MUSE provides 3D imaging and spectroscopic data over a wavelength range of 4650–9300 Å. It operates in two modes: the wide-field mode (WFM) and the narrow-field mode. We used data from the WFM, which offers a field of view of 1′×1′ with 0 2 sampling. MUSE uses the GALACSI adaptive optics module to provide adaptive optics corrected data, achieving a MUSE spatial resolution of 0
 4 at 7000 Å. MUSE has a resolving power of 1770 at 4800 Å and 3590 at 9300 Å. AM 1054-325 was observed under Programme ID 106.2155 for a total exposure time of 7920 s. The total sky coverage was 4 arcmin2 with a sky resolution of 1.2
We used the GIST version 3.0.31 (Bittner et al. 2019) pipeline to analyse the MUSE data. The GIST pipeline is designed to analyse fully reduced IFU data. For the analysis of emission lines, GIST uses gas and absorption-line fitting (GANDALF) (Sarzi et al. 2006; Falcón-Barroso et al. 2006; Bittner et al. 2019). The penalised pixel-fitting (PPXF; Cappellari & Emsellem 2004; Cappellari 2017) method is used for stellar continuum fitting in GIST. Data below a signal-to-noise ratio (S/N) of three were masked, and Voronoi binning was performed based on Hα emission for an S/N of 50 for the gas emission analysis. The galaxy group AM 1054-325 shows massive and ongoing star-forming regions that are bright in Hα, resulting in smaller and finer bins. For stellar velocity and star formation history (SFH) estimation, we performed Voronoi binning for a wavelength range of 4765–5530 Å. We corrected the spectra for the Milky Way extinction and fitted the stellar continuum using a multiplicative eighth-order Legendre polynomial.
4. Analysis
4.1. Star-forming regions
A galaxy’s young and massive star formation emits a significant amount of Hα emission. Hα emission traces the star formation up to 10 Myr. In Fig. 1, the blue shows the Hα emission of the galaxy group. The AM 1054-325A subgroup shows significant star formation in the clumps along the tidal tail. This suggests that interactions have led to tidal stripping of gas, followed by star formation. The Hα emission also suggests that galaxy interactions have recently occurred, producing massive, young stars. AM 1054-325B appears relatively quiescent in terms of star formation, exhibiting a comparatively subdued level of Hα emission. The tidal tails associated with AM 1054-325A exhibit massive clumps that are bright in Hα emission. This difference in activity highlights the diverse nature of galaxies within this group. We used the Python library for Source Extraction and Photometry (SEXTRACTOR; Bertin & Arnouts 1996) to identify and extract the clumps in the galaxies. SEXTRACTOR can execute various functions, including source detection, background estimation, and deblending. SEXTRACTOR identifies the sources based on a given threshold. Pixels with counts more than the threshold are identified as sources. These detected objects are then deblended and cleaned. We used the detection threshold (thresh) of 5σ, where σ is the global background noise (i.e. the RMS of the counts). The minimum number of pixels required for the identification of a region was fixed at 40 (minarea = 40). Thus, we detected regions with an area equivalent to the resolution of the MUSE data. We used elliptical shapes for the star-forming regions. We deblended the regions with 64 sub-thresholds (deblend_nthresh = 64) and a minimum contrast parameter value of 0.00001 (deblend_cont = 0.00001). We detected 48 clumps, three of which are galaxy cores. We also extracted the segmentation map, which gives the member pixels for each object. Fig. 2 shows the extracted clumps in cyan and segments represented by different colours over-plotted on Hα emission.
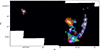 |
Fig. 2. Background image representing the Hα emission, with different colours indicating different segments from SEXTRACTOR. The cyan regions show the detected clumps overlaid on the Hα map. |
4.2. Area and star formation rate
We estimated the area corresponding to each segment and the corresponding SFRs. We corrected for the Milky Way extinction using the Fitzpatrick law (Fitzpatrick 1999), and for internal extinction using the Balmer decrement. We assumed a temperature of 104 K and an electron density of 102 cm−3 for Case B recombination, which corresponds to (Hα/Hβ)int = 2.86 (Osterbrock & Bochkarev 1989; Osterbrock & Ferland 2006; Momcheva et al. 2013) This choice, which is standard for star-forming galaxies in the literature. The following equation gives the nebular colour excess:
![$$ \begin{aligned} E(B-V) = 1.97 \log _{10}\Biggr [\frac{(\mathrm{H}_{\alpha }/\mathrm{H}_{\beta })_{\rm obs}}{2.86}\Biggr ], \end{aligned} $$](/articles/aa/full_html/2024/09/aa47999-23/aa47999-23-eq4.gif)
where Hα and Hβ are the observed fluxes of Hα and Hβ emission lines, respectively. We calculated the SFR surface density (ΣSFR) for each segment in Hα using the following relation (Calzetti et al. 2007):

where SFR(Hα) is the SFR in Hα [M⊙ yr−1] and LHα is the Hα luminosity [erg s−1]. Fig. 3 shows the histograms of the area and SFR/area (ΣSFR) of the segments and galaxy cores.
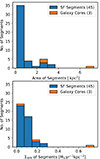 |
Fig. 3. The figure represents the stacked histogram for the detected segments. The top and bottom panels show the stacked histograms of the area and ΣSFR for the detected segments (blue) and galaxy cores (orange) in Hα. |
4.3. Gas and stellar velocity
The accreted external gas during galaxy interactions can have angular momentum that may not be perfectly aligned with the pre-existing stellar disk, which results in kinematic misalignments between the gas and stellar disks. In some cases, the accreted gas orbits in the opposite direction to the stellar disk, leading to counter-rotation between the gas and the stellar disks. We derived the Hα and stellar velocity using the GIST pipeline to understand the effect of interaction on the kinematic properties of the AM 1054-325 galaxy group. The GIST pipeline uses GANDALF to estimate the gas emission line properties and PPXF to estimate the stellar kinematics. The left, middle, and right panels of Fig. 4 show the stellar velocity, gas velocity, and gas velocity dispersion, respectively. The gas disk is kinematically disturbed relative to the stellar disk in AM 1054-325B. Fig. 5 shows the Hubble Space Telescope (HST) maps with overlaid Hα intensity contours. These contours extend from the north-west and south-west towards AM 1054-325B. This indicates the presence of accreted ionised gas in AM 1054-325B. The gas velocity map (Fig. 4, middle panel) also shows redshifted and blueshifted velocities with respect to the stellar disk in the northern and southern directions, suggesting an inflowing gas. The gas layers are more easily disturbed by tidal interactions than stellar disks. The gas velocity dispersion is also higher in the outskirts of AM 1054-325B (Fig. 4, right panel). The star formation activity in AM 1054-325B is significantly lower, indicating insufficient gas content to dissipate the momentum of the incoming accreted gas. Thus, the accreted gas settles into a disk rotating opposite to the stellar disk. Such accretion events result in gas replenishment, contributing to the extensive gas reservoirs surrounding most spiral galaxies. Under quiescent conditions, the gas slowly spirals inwards. However, initial tidal interactions can drive the gas towards the centre, significantly impacting the abundance gradients (Montuori et al. 2010). In some cases, these gradients can even undergo reversal, as observed in the MASSIV survey (Queyrel et al. 2012) at high redshifts. This reversal involves low-metallicity gas flowing into the centre and diluting the abundance of the central gas. Low-metallicity gas is observed in the outer regions of AM 1054-325B (Fig. 6, bottom panel), suggesting a possible connection to the accreted gas.
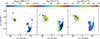 |
Fig. 4. The stellar and gas kinematics derived from GIST. The left and right panels show respectively the stellar and Hα gas velocities of the galaxy group. The galaxy AM 1054-325B displays counter-rotating gas and stellar disk. |
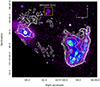 |
Fig. 5. HST image with overlaid Hα contours. The contours extend from AM 1054-325B towards the north-west. This shows the signature of accreted ionised gas in AM 1054-325B. |
4.4. Star formation history and metallicity
The SFH module in the GIST pipeline uses emission-line-subtracted spectra generated by the GANDALF module to estimate the non-parametric SFH. The non-parametric SFH is calculated by modelling the observed spectrum using PPXF. The GIST pipeline produces a linear combination of spectral templates and assigns them linear weights to match the model and observed spectra. These linear weights assigned to the template spectra are used to estimate the SFH and stellar population parameters. We estimated the SFH in AM 1054-325 using GIST. We also measured the gas phase metallicity of AM 1054-325 using the flux of the emission lines provided by GIST. The top panel of Fig. 6 shows the SFH map of AM 1054-325. Metallicity maps were derived using the following equation from Pettini & Pagel (2004).
![$$ \begin{aligned} 12+\log \left(\frac{\mathrm{O}}{\mathrm{H}}\right) = 8.73 - 0.32\times \log \Biggr [ \frac{{\text{ O}}{\small { {\text{ III}}}}/\mathrm{H}\beta }{{\text{ N}}{\small { {\text{ II}}}}/\mathrm{H}\alpha } \Biggr ], \end{aligned} $$](/articles/aa/full_html/2024/09/aa47999-23/aa47999-23-eq6.gif)
where O III, Hβ, N II, and Hα are the O III, Hβ, N II, and Hα emission line fluxes, respectively.
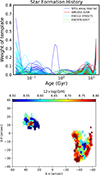 |
Fig. 6. The top panel shows the star formation history, and the bottom panel shows the metallicity of the galaxy group. Bins with an amplitude-to-noise ratio (A/N) of more than 4 in all the Hβ, O III, Hα, and N II lines were considered to be a reliable estimation of metallicity. |
The top panel of Fig. 6 shows the SFH of each galaxy component in the galaxy group. The galaxy group shows multiple peaks in the SFH. ESO-LV 3760271 and the star-forming clumps (SFCs) along the tidal tail indicate recent star formation activity in the SFH plot, while AM 1054-325B and ESO376-G027 exhibit star formation peaks in the past. The recent burst of star formation activity is also evident from the Hα map, which shows bright clumps in the tidal tail. The metallicity of these clumps is also higher (Fig. 6, bottom panel). The metallicity map indicates that ESO376-G027 has a lower metal content than both its tail and ESO-LV 3760271. The tail that stretches out is connected to a core (shown in the green rectangle in Fig. 1) beneath ESO376-G027. This core looks redder in the colour-combined image (Fig. 1) and has a metallicity similar to the tidal tail (Fig. 6). This suggests that the core might be the central, bulging part of another galaxy, AM 1054-325D, that has been pulled away along the tail.
4.5. Specific star formation rate
The specific SFR (sSFR) quantitatively measures the contribution of star formation to galaxy growth and its relationship with stellar mass and the SFR. It is defined as the SFR per unit stellar mass. Several observational studies have established a correlation between SFR and stellar mass in star-forming galaxies. To estimate the sSFR, we created an SFR map of the interacting group using the Hα map. The stellar mass map was created using the method given in Bell et al. (2003):

where the values of a and b are 0.006 and 1.114, respectively. We used PYMUSE (Pessa et al. 2018) to create r- and i-band images of the galaxy group from MUSE cubes. We converted the images into flux maps (erg sec−1 cm−2 A−1) by dividing the image by the central wavelength of the filter. We then converted the flux maps to magnitude maps and i-band flux map to luminosity map. Pixels with values above 27 magnitudes were removed to eliminate noisy data. Using the above formula, we then derived a pixel-wise stellar mass map. By dividing the SFR map by the stellar mass map, we generated a pixel-wise sSFR map. The sSFR of the galaxies is shown in Fig. 7. AM 1054-325A exhibits an elevated sSFR within both the tidal tail and ESO-LV 3760271 regions, whereas the sSFR of ESO376-G027 appears diminished, indicative of its quenched state. The sSFR of the tidal tail is different from that of ESO376-G027, and similar to that of the nucleus below ESO376-G027, which again supports the idea that the clumps in the tidal tail were not formed from ESO376-G027. These clumps were instead formed from the gas stripped from another galaxy, the nucleus of which is present below ESO376-G027. The increase in the sSFR in the tidal tail implies a substantial contribution of ongoing star formation to the galaxy’s overall stellar mass growth. This suggests the crucial role of star-forming processes in shaping the evolution of AM 1054-325A.
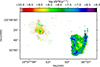 |
Fig. 7. sSFR distribution in the galaxy group AM 1054-325. |
4.6. BPT diagram
The investigation of AGN and star formation activity in interacting galaxies is essential as it provides insights into the influence of galaxy interactions on stimulating star formation and fuelling SMBHs. To elucidate the ionisation mechanism of the gas, the Baldwin-Phillips-Terlevich (BPT) diagram, as introduced by Baldwin et al. 1981, categorises sources based on the flux ratios of their emission lines. We generated BPT diagrams to investigate the characteristics of the emission mechanism. The BPT diagram utilises the [O III]λ5007/Hβ and [N II]λ6563/Hα line ratios as discerning indicators to distinguish and categorise different regions, such as Seyfert, low-ionisation nuclear emission-line region (LINER), composite, and star-forming regions. Fig. 8 shows the BPT diagram representing the galaxy group AM 1054-325. The emission detected from both the tidal tail and ESO-LV 3760271 regions falls within the star-forming region of the BPT diagram, while AM 1054-325B exhibits composite emission. The stacked spectrum from some of the bins confirms the high level of [O I] emission, which lies in the LINER part of the [O I] BPT diagram. Since we only studied bins with A/N > 4, the high [O I]/Hα line ratios are unlikely to be due to measurement errors. The regions characterised by elevated [O I]/Hα ratios are primarily ionised by field OB stars, which emit photons from HII regions or by shocks. These shocks can originate from processes such as gas accretion and/or stripping or stellar feedback resulting from recent starburst activity. The redshifted and blueshifted velocities (Fig 4) show the gas flowing towards the inner regions. This inflowing gas collides with the interstellar medium of the host galaxy and can produce powerful shocks. The interaction processes in galaxy groups can produce tidal stripping and shock-heating of the gas, leading to LINER emission. A comprehensive study using IFU data revealed a substantial proportion of shock excitation induced by tidal forces in nearby luminous infrared galaxies (Monreal-Ibero et al. 2010). In studies by Farage et al. (2010) and Rich et al. (2010, 2011), advanced models were used to analyse the shocked gas. In all cases, the shock excitation shows features similar to extended LINER-like emission with widened line profiles. These shocks result from substantial movements of gas triggered by the merger process. During a major merger, tidal forces and accretion processes drive gas inwards, causing shock excitation (Farage et al. 2010). This infalling gas fuels significant increases in star formation and AGN activity, leading to massive galactic outflows and additional shocks in the interstellar medium and beyond.
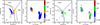 |
Fig. 8. BPT diagrams of the galaxy group AM 1054-325. The left and right panels show the [N II] and [O I] BPT diagrams. Bins with an amplitude-to-noise ratio (A/N) of less than 4 in any of the lines are shown in grey. |
5. Summary
This study uses archival data from the MUSE to present the properties of interacting galaxy group AM 1054-325. MUSE’s high spatial and spectral resolution played a crucial role in identifying the clumps and understanding their properties.
-
The galaxy group AM 1054-325 is composed of two subgroups, AM 1054-325A and AM 1054-325B. AM 1054-325A shows massive star-forming clumps, which are formed due to tidal stripping.
-
The clumps along the tidal tail are brighter in Hα, which suggests that they have formed recently: these clumps also have higher metallicities.
-
AM 1054-325B shows disturbed gas kinematics, possibly due to gas accretion onto the disk.
-
The galaxy group shows multiple episodes of star formation; ESO-LV3760271 and SFCs along the tail show recent episodes of star formation activity.
-
The sSFR is higher along the tidal tails, leading to the growth of stellar mass in the galaxy.
-
The BPT diagram indicates ionisation due to shocks, which suggests that interaction and/or mergers can lead to shock heating of the gas.
Acknowledgments
We thank the anonymous referee for the thoughtful review, which improved the impact and clarity of this work. VJ acknowledges support from the Alexander von Humboldt Foundation. This paper has used the observations collected at the European Southern Observatory under ESO programme 106.2155. This research has also used data from DECaLS at CTIO. This publication has used the NASA/IPAC Extragalactic Database (NED), operated by the Jet Propulsion Laboratory, California Institute of Technology, under contract with the National Aeronautics and Space Administration.
References
- Acreman, D. M., Stevens, I. R., Ponman, T. J., & Sakelliou, I. 2003, MNRAS, 341, 1333 [NASA ADS] [CrossRef] [Google Scholar]
- Alonso, M. S., Lambas, D. G., Tissera, P., & Coldwell, G. 2007, MNRAS, 375, 1017 [NASA ADS] [CrossRef] [Google Scholar]
- Baldwin, J. A., Phillips, M. M., & Terlevich, R. 1981, PASP, 93, 5 [Google Scholar]
- Balsara, D., Livio, M., & O’Dea, C. P. 1994, ApJ, 437, 83 [CrossRef] [Google Scholar]
- Bell, E. F., McIntosh, D. H., Katz, N., & Weinberg, M. D. 2003, ApJS, 149, 289 [Google Scholar]
- Bertin, E., & Arnouts, S. 1996, A&AS, 117, 393 [NASA ADS] [CrossRef] [EDP Sciences] [Google Scholar]
- Bertola, F., Cinzano, P., Corsini, E. M., et al. 1996, ApJ, 458, L67 [NASA ADS] [CrossRef] [Google Scholar]
- Bettoni, D. 1984, The Messenger, 37, 17 [NASA ADS] [Google Scholar]
- Bittner, A., Falcón-Barroso, J., Nedelchev, B., et al. 2019, A&A, 628, A117 [NASA ADS] [CrossRef] [EDP Sciences] [Google Scholar]
- Calzetti, D., Kennicutt, R. C., Engelbracht, C. W., et al. 2007, ApJ, 666, 870 [Google Scholar]
- Cappellari, M. 2017, MNRAS, 466, 798 [Google Scholar]
- Cappellari, M., & Emsellem, E. 2004, PASP, 116, 138 [Google Scholar]
- Ciri, R., Bettoni, D., & Galletta, G. 1995, Nature, 375, 661 [CrossRef] [Google Scholar]
- Corsini, E. M. 2014, ASP Conf. Ser., 486, 51 [NASA ADS] [Google Scholar]
- Di Matteo, T., Springel, V., & Hernquist, L. 2005, Nature, 433, 604 [NASA ADS] [CrossRef] [Google Scholar]
- Duc, P. A., & Mirabel, I. F. 1999, in Galaxy Interactions at Low and High Redshift, eds. J. E. Barnes, & D. B. Sanders, 186, 61 [NASA ADS] [CrossRef] [Google Scholar]
- Ellison, S. L., Patton, D. R., Mendel, J. T., & Scudder, J. M. 2011, MNRAS, 418, 2043 [NASA ADS] [CrossRef] [Google Scholar]
- Ellison, S. L., Mendel, J. T., Scudder, J. M., Patton, D. R., & Palmer, M. J. D. 2013, MNRAS, 430, 3128 [NASA ADS] [CrossRef] [Google Scholar]
- Falcón-Barroso, J., Bacon, R., Bureau, M., et al. 2006, MNRAS, 369, 529 [Google Scholar]
- Farage, C. L., McGregor, P. J., Dopita, M. A., & Bicknell, G. V. 2010, ApJ, 724, 267 [NASA ADS] [CrossRef] [Google Scholar]
- Fitzpatrick, E. L. 1999, PASP, 111, 63 [Google Scholar]
- Galletta, G. 1987, ApJ, 318, 531 [NASA ADS] [CrossRef] [Google Scholar]
- Hernquist, L., & Mihos, J. C. 1995, ApJ, 448, 41 [NASA ADS] [CrossRef] [Google Scholar]
- Imanishi, M., Kawamuro, T., Kikuta, S., Nakano, S., & Saito, Y. 2020, ApJ, 891, 140 [Google Scholar]
- Johnston, E. J., Merrifield, M. R., Aragón-Salamanca, A., & Cappellari, M. 2013, MNRAS, 428, 1296 [Google Scholar]
- Kauffmann, G., & Haehnelt, M. 2000, MNRAS, 311, 576 [Google Scholar]
- Kennicutt, R. C., Jr 1998, ARA&A, 36, 189 [NASA ADS] [CrossRef] [Google Scholar]
- Koss, M., Mushotzky, R., Treister, E., et al. 2012, ApJ, 746, L22 [Google Scholar]
- Krajnović, D., Weilbacher, P. M., Urrutia, T., et al. 2015, MNRAS, 452, 2 [Google Scholar]
- Lambas, D. G., Alonso, S., Mesa, V., & O’Mill, A. L. 2012, A&A, 539, A45 [NASA ADS] [CrossRef] [EDP Sciences] [Google Scholar]
- Momcheva, I. G., Lee, J. C., Ly, C., et al. 2013, AJ, 145, 47 [NASA ADS] [CrossRef] [Google Scholar]
- Monreal-Ibero, A., Arribas, S., Colina, L., et al. 2010, A&A, 517, A28 [NASA ADS] [CrossRef] [EDP Sciences] [Google Scholar]
- Montuori, M., Di Matteo, P., Lehnert, M. D., Combes, F., & Semelin, B. 2010, A&A, 518, A56 [NASA ADS] [CrossRef] [EDP Sciences] [Google Scholar]
- Moreno, J., Torrey, P., Ellison, S. L., et al. 2021, MNRAS, 503, 3113 [NASA ADS] [CrossRef] [Google Scholar]
- Osterbrock, D. E., & Bochkarev, N. G. 1989, Sov. Astron., 33, 694 [NASA ADS] [Google Scholar]
- Osterbrock, D. E., & Ferland, G. J. 2006, Astrophysics of Gaseous Nebulae and Active Galactic Nuclei (Sausalito, CA: University Science Books) [Google Scholar]
- Pessa, I., Tejos, N., & Moya, C. 2018, ArXiv e-prints [arXiv:1803.05005] [Google Scholar]
- Pettini, M., & Pagel, B. E. J. 2004, MNRAS, 348, L59 [NASA ADS] [CrossRef] [Google Scholar]
- Pizzella, A., Morelli, L., Coccato, L., et al. 2018, A&A, 616, A22 [NASA ADS] [CrossRef] [EDP Sciences] [Google Scholar]
- Queyrel, J., Contini, T., Kissler-Patig, M., et al. 2012, A&A, 539, A93 [NASA ADS] [CrossRef] [EDP Sciences] [Google Scholar]
- Rasmussen, J., Ponman, T. J., & Mulchaey, J. S. 2006, MNRAS, 370, 453 [NASA ADS] [CrossRef] [Google Scholar]
- Renaud, F., Bournaud, F., & Duc, P.-A. 2015, MNRAS, 446, 2038 [Google Scholar]
- Rich, J. A., Dopita, M. A., Kewley, L. J., & Rupke, D. S. N. 2010, ApJ, 721, 505 [NASA ADS] [CrossRef] [Google Scholar]
- Rich, J. A., Kewley, L. J., & Dopita, M. A. 2011, ApJ, 734, 87 [NASA ADS] [CrossRef] [Google Scholar]
- Rosa, D. A., Dors, O. L., Krabbe, A. C., et al. 2014, MNRAS, 444, 2005 [NASA ADS] [CrossRef] [Google Scholar]
- Rubin, V. C., Graham, J. A., & Kenney, J. D. P. 1992, ApJ, 394, L9 [NASA ADS] [CrossRef] [Google Scholar]
- Sanders, D. B., Soifer, B. T., Elias, J. H., et al. 1988a, ApJ, 325, 74 [Google Scholar]
- Sanders, D. B., Soifer, B. T., Elias, J. H., Neugebauer, G., & Matthews, K. 1988b, ApJ, 328, L35 [NASA ADS] [CrossRef] [Google Scholar]
- Sarzi, M., Falcón-Barroso, J., Davies, R. L., et al. 2006, MNRAS, 366, 1151 [Google Scholar]
- Satyapal, S., Ellison, S. L., McAlpine, W., et al. 2014, MNRAS, 441, 1297 [Google Scholar]
- Tonnesen, S., & Cen, R. 2012, MNRAS, 425, 2313 [Google Scholar]
- Urrutia, T., Lacy, M., & Becker, R. H. 2008, ApJ, 674, 80 [Google Scholar]
- Yadav, J., Das, M., Barway, S., & Combes, F. 2021a, A&A, 651, L9 [NASA ADS] [CrossRef] [EDP Sciences] [Google Scholar]
- Yadav, J., Das, M., Patra, N. N., et al. 2021b, ApJ, 914, 54 [Google Scholar]
- Yadav, J., Das, M., Barway, S., & Combes, F. 2022, A&A, 657, L10 [NASA ADS] [CrossRef] [EDP Sciences] [Google Scholar]
- Yadav, J., Das, M., Barway, S., & Combes, F. 2023, MNRAS, 526, 198 [Google Scholar]
- Yee, H. K. C., & Ellingson, E. 1995, ApJ, 445, 37 [NASA ADS] [CrossRef] [Google Scholar]
Appendix A: Additional figure
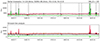 |
Fig. A.1. GIST-fitted spectra for one of the bins. The top and bottom panels show stellar and gas emission line fitting. Top panel: Black, red, and green lines represent the observed spectrum, fitted stellar continuum, and observed stellar continuum. The grey-shaded regions show the emission lines, which were masked during the fitting of the stellar continuum. Bottom panel: Black, red, orange, and green lines represent the observed spectrum, fitted gas emission spectrum, fitted stellar continuum, and observed-(stellar+gas) emission (residual) spectrum. |
All Tables
All Figures
|
Fig. 1. Colour-combined image of the AM 1054-325 galaxy group. The red colour represent z-band data from The Dark Energy Camera Legacy Survey (DECaLS), the green represents HST F336W data, and the blue represents the Hα emission. The tidal tail shows clumps that are bright in Hα emission. White rectangles represent the galaxy AM 1054-325B and the galaxy subgroup AM 1054-325A. The yellow rectangles represent the merging galaxies ESO376-G027 and ESO-LV3760271, and another possible merging candidate galaxy AM 1054-325D is shown in the green rectangle. |
| In the text | |
|
Fig. 2. Background image representing the Hα emission, with different colours indicating different segments from SEXTRACTOR. The cyan regions show the detected clumps overlaid on the Hα map. |
| In the text | |
|
Fig. 3. The figure represents the stacked histogram for the detected segments. The top and bottom panels show the stacked histograms of the area and ΣSFR for the detected segments (blue) and galaxy cores (orange) in Hα. |
| In the text | |
|
Fig. 4. The stellar and gas kinematics derived from GIST. The left and right panels show respectively the stellar and Hα gas velocities of the galaxy group. The galaxy AM 1054-325B displays counter-rotating gas and stellar disk. |
| In the text | |
|
Fig. 5. HST image with overlaid Hα contours. The contours extend from AM 1054-325B towards the north-west. This shows the signature of accreted ionised gas in AM 1054-325B. |
| In the text | |
|
Fig. 6. The top panel shows the star formation history, and the bottom panel shows the metallicity of the galaxy group. Bins with an amplitude-to-noise ratio (A/N) of more than 4 in all the Hβ, O III, Hα, and N II lines were considered to be a reliable estimation of metallicity. |
| In the text | |
|
Fig. 7. sSFR distribution in the galaxy group AM 1054-325. |
| In the text | |
|
Fig. 8. BPT diagrams of the galaxy group AM 1054-325. The left and right panels show the [N II] and [O I] BPT diagrams. Bins with an amplitude-to-noise ratio (A/N) of less than 4 in any of the lines are shown in grey. |
| In the text | |
|
Fig. A.1. GIST-fitted spectra for one of the bins. The top and bottom panels show stellar and gas emission line fitting. Top panel: Black, red, and green lines represent the observed spectrum, fitted stellar continuum, and observed stellar continuum. The grey-shaded regions show the emission lines, which were masked during the fitting of the stellar continuum. Bottom panel: Black, red, orange, and green lines represent the observed spectrum, fitted gas emission spectrum, fitted stellar continuum, and observed-(stellar+gas) emission (residual) spectrum. |
| In the text | |
Current usage metrics show cumulative count of Article Views (full-text article views including HTML views, PDF and ePub downloads, according to the available data) and Abstracts Views on Vision4Press platform.
Data correspond to usage on the plateform after 2015. The current usage metrics is available 48-96 hours after online publication and is updated daily on week days.
Initial download of the metrics may take a while.