Fig. 1.
Download original image
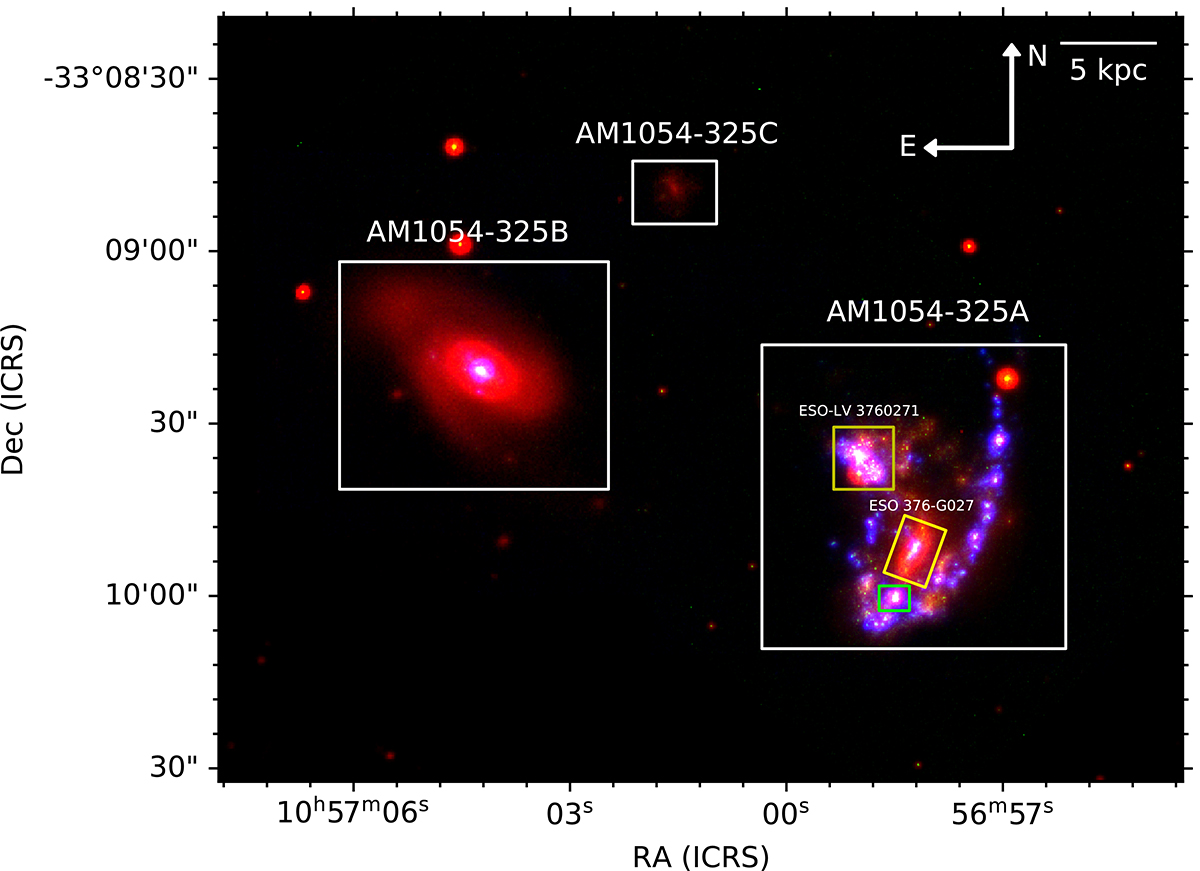
Colour-combined image of the AM 1054-325 galaxy group. The red colour represent z-band data from The Dark Energy Camera Legacy Survey (DECaLS), the green represents HST F336W data, and the blue represents the Hα emission. The tidal tail shows clumps that are bright in Hα emission. White rectangles represent the galaxy AM 1054-325B and the galaxy subgroup AM 1054-325A. The yellow rectangles represent the merging galaxies ESO376-G027 and ESO-LV3760271, and another possible merging candidate galaxy AM 1054-325D is shown in the green rectangle.
Current usage metrics show cumulative count of Article Views (full-text article views including HTML views, PDF and ePub downloads, according to the available data) and Abstracts Views on Vision4Press platform.
Data correspond to usage on the plateform after 2015. The current usage metrics is available 48-96 hours after online publication and is updated daily on week days.
Initial download of the metrics may take a while.