Fig. 4.
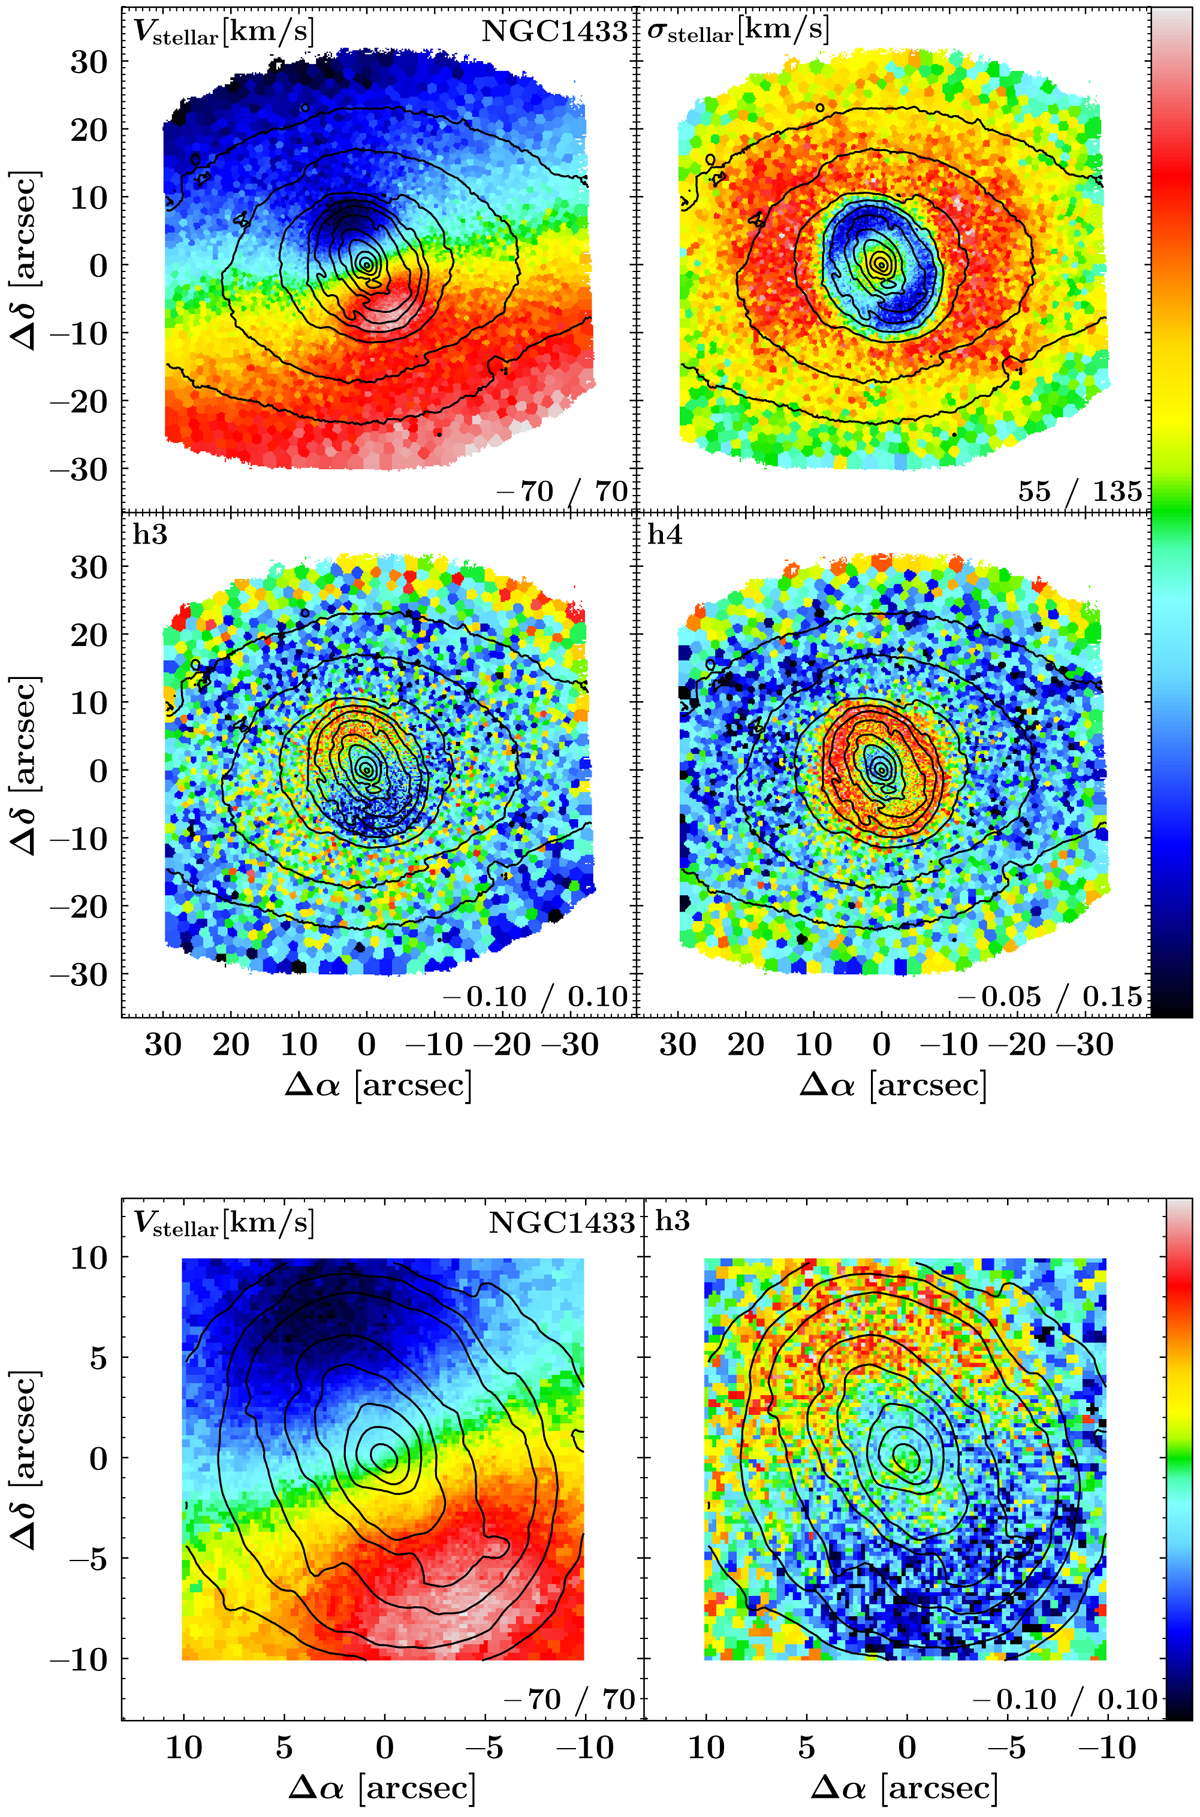
Upper group of panels: line-of-sight velocity (Vstellar), velocity dispersion (σstellar), and higher-order moments h3 and h4 of the stellar component of NGC 1433. Lower panels: spatial distribution of line-of-sight velocities (left) and h3 moment (right) in the innermost part of the galaxy. The limits of the colour bar is given in the lower right corner of each panel. Isophotes are based on reconstructed intensities from the MUSE cube and are displayed in steps of 0.5 mag. North is up; east is to the left.
Current usage metrics show cumulative count of Article Views (full-text article views including HTML views, PDF and ePub downloads, according to the available data) and Abstracts Views on Vision4Press platform.
Data correspond to usage on the plateform after 2015. The current usage metrics is available 48-96 hours after online publication and is updated daily on week days.
Initial download of the metrics may take a while.