Free Access
Fig. 3.
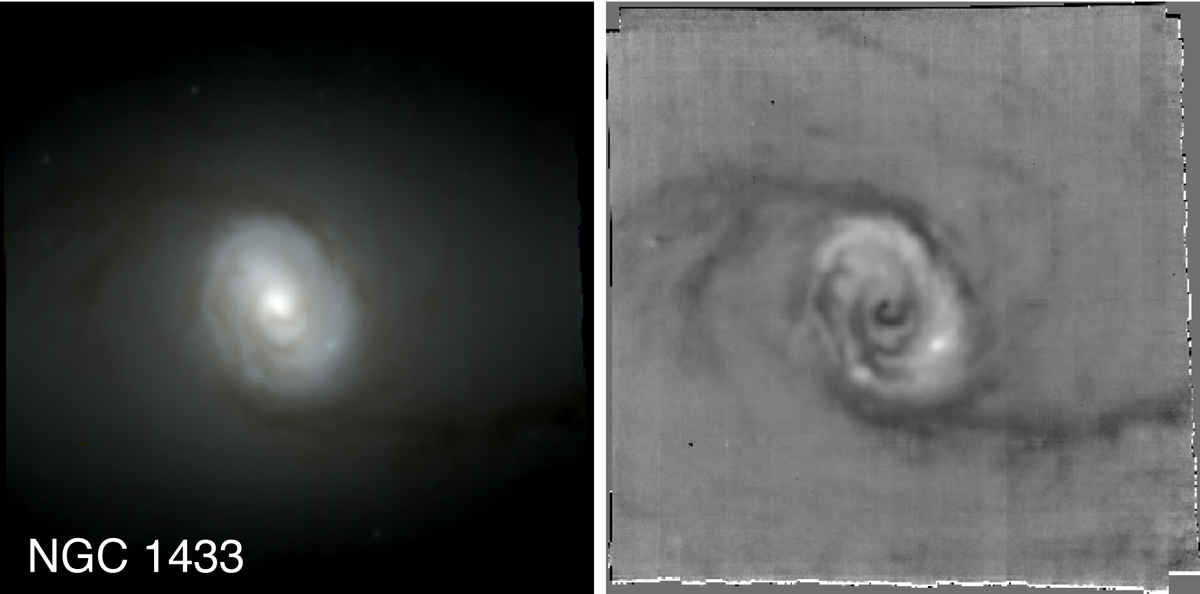
Colour composite (left panel) and colour map (right panel) of NGC 1433. Colour composites are built by collapsing the data cube in a blue (4750–6000 Å), green (6000–7000 Å), and red (7000–9000 Å) wavelength band and combining the resulting images. Colour maps are obtained by subtracting the red image from the blue.
Current usage metrics show cumulative count of Article Views (full-text article views including HTML views, PDF and ePub downloads, according to the available data) and Abstracts Views on Vision4Press platform.
Data correspond to usage on the plateform after 2015. The current usage metrics is available 48-96 hours after online publication and is updated daily on week days.
Initial download of the metrics may take a while.