Fig. 2.
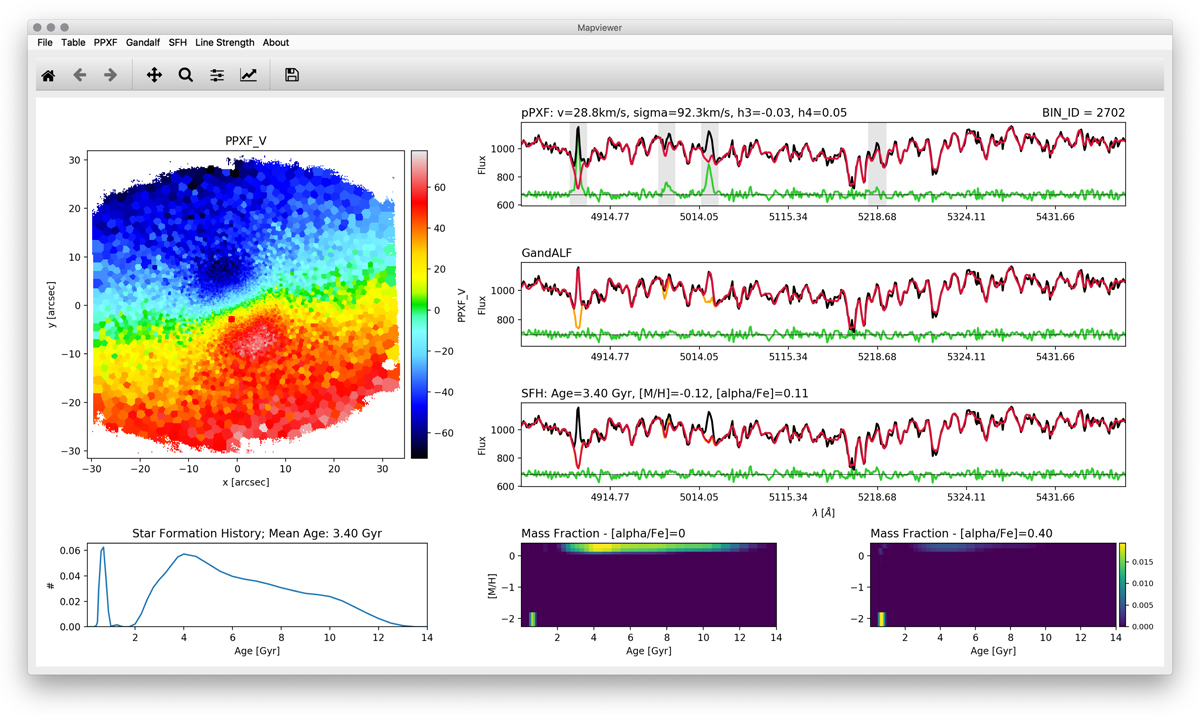
Screenshot of the visualisation software Mapviewer in its default layout, illustrating the results of the galaxy NGC 1433. High-level data products of previous analysis runs of the GIST pipeline can be selected and displayed through the items in the menu bar. A map of the selected quantity is displayed in the upper left panel of the window. Individual bins in this map can be selected by simply performing a mouse-click on the map or providing the bin ID. The selected bin is subsequently shown by a red circle, while the other panels display more detailed information. In particular, the upper three panels on the right side of the window display observed spectra, and the fits generated by the PPXF module (first panel), GANDALF module (second panel), and SFH module (third panel). Observed spectra are displayed in black, fits in red, emission-subtracted continuum spectra in orange, and residuals in green. Masked spectral regions are highlighted in grey. The three bottom panels display further information on the stellar population properties: non-parametric star formation histories are displayed in the left panel, while the centre and right panels illustrate the weights of the templates in the age-metallicity-alpha grid. The corresponding quantitative results of the measurements are provided next to each panel. Different layouts of the Mapviewer routine are available to highlight the results of the line strength module.
Current usage metrics show cumulative count of Article Views (full-text article views including HTML views, PDF and ePub downloads, according to the available data) and Abstracts Views on Vision4Press platform.
Data correspond to usage on the plateform after 2015. The current usage metrics is available 48-96 hours after online publication and is updated daily on week days.
Initial download of the metrics may take a while.