Fig. 6.
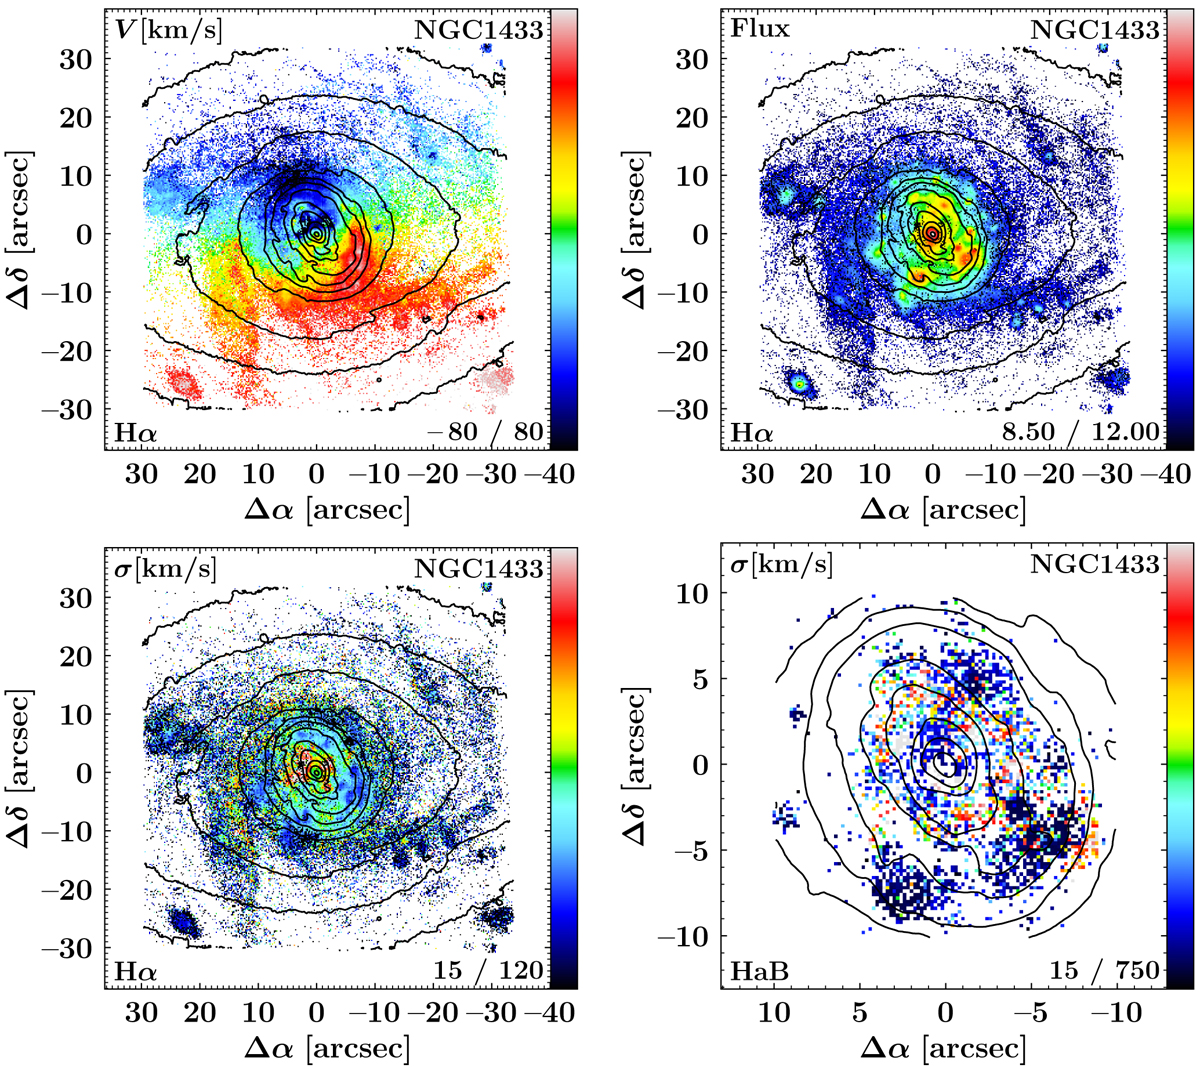
Maps of the Hα line-of-sight velocity (upper left panel), velocity dispersion (lower left panel) and flux (upper right panel, in arbitrary units with logarithmic scale) of the primary component in the emission-line fit of NGC 1433. The velocity dispersion of the secondary Hα component is displayed in the lower right panel. We note that this panel shows a different spatial scale in order to highlight the innermost region of the galaxy. Only spaxels in which the Hα line exceeds an A/rN ratio of 4 are displayed in this figure. The limits of the colour bar are given in the lower right corner of each panel. Isophotes are based on reconstructed intensities from the MUSE cube and displayed in steps of 0.5 mag. North is up; east is to the left.
Current usage metrics show cumulative count of Article Views (full-text article views including HTML views, PDF and ePub downloads, according to the available data) and Abstracts Views on Vision4Press platform.
Data correspond to usage on the plateform after 2015. The current usage metrics is available 48-96 hours after online publication and is updated daily on week days.
Initial download of the metrics may take a while.