Fig. 9.
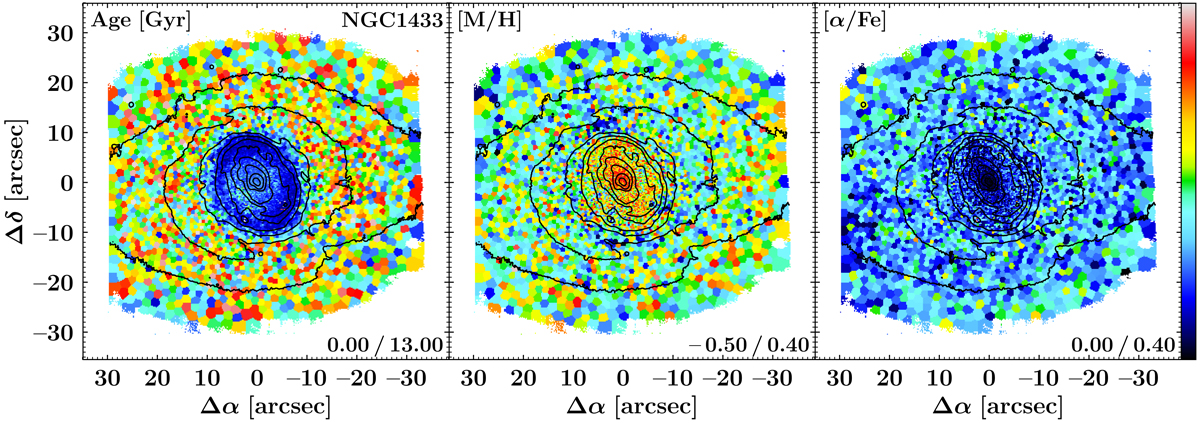
Maps of the light-weighted stellar population content of the galaxy NGC 1433, as derived from full-spectral fitting. Displayed are age (left panel), [M/H] (centre panel), and [α/Fe] (right panel). The limits of the colour bar are stated in the lower right of each panel. Isophotes are based on reconstructed intensities from the MUSE cube and displayed in steps of 0.5 mag. North is up; east is to the left.
Current usage metrics show cumulative count of Article Views (full-text article views including HTML views, PDF and ePub downloads, according to the available data) and Abstracts Views on Vision4Press platform.
Data correspond to usage on the plateform after 2015. The current usage metrics is available 48-96 hours after online publication and is updated daily on week days.
Initial download of the metrics may take a while.